

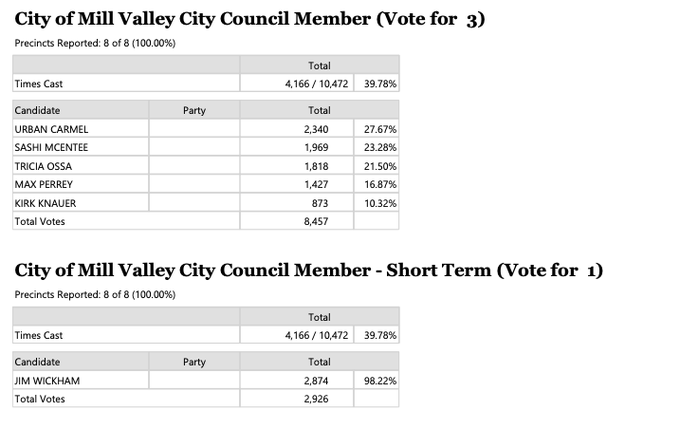
Urban Carmel
@ukarlewitz
Followers
84,239
Following
158
Media
6,101
Statuses
38,742
Wharton. McKinsey. UBS. Securities industry since '94. Asia ex-pat in '80s-90s. Elected to Mill Valley City Council in '20. Blocked by Zero Hedge since 2010.
San Francisco
Joined May 2009
Don't wanna be here?
Send us removal request.
Explore trending content on Musk Viewer
Gojo
• 300954 Tweets
Yuta
• 168931 Tweets
キスの日
• 115106 Tweets
Gege
• 90647 Tweets
बुद्ध पूर्णिमा
• 72223 Tweets
鈴鹿詩子
• 69716 Tweets
PANLY KOBARAH
• 57646 Tweets
サマソニ
• 54663 Tweets
#LINEMANคุ้มชัวร์xBUS
• 45072 Tweets
भगवान बुद्ध
• 37047 Tweets
シャドウバン
• 19199 Tweets
LINEMAN x THAINEX
• 18389 Tweets
I.N SHINES WITH DAMIANI
• 13112 Tweets
レガレイラ
• 13059 Tweets
詩子おねえさん
• 11642 Tweets
トラップ
• 10689 Tweets


Pinned Tweet

1. There’s no PPT
2. The Fed has been hated for 105 years
3. High probabilities do not imply certainty
4. It can always be different this time
5. Things go up over time
6. We’re not all going to agree
83
120
824
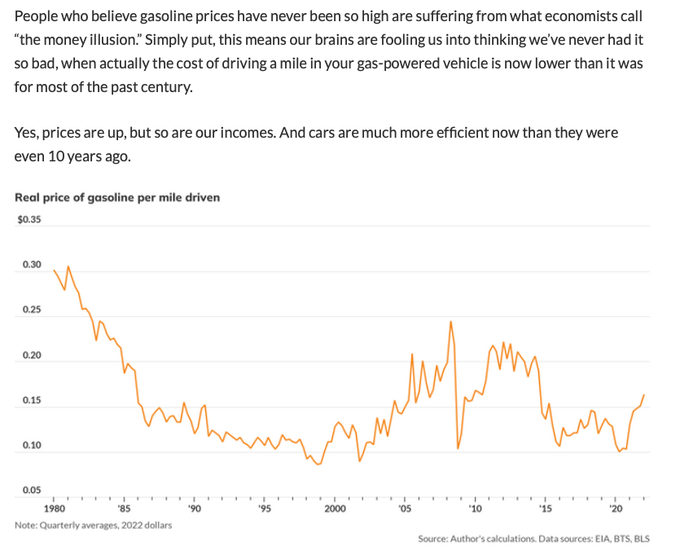
Allow me to piss you off with some data on the price of gas
203
497
2K
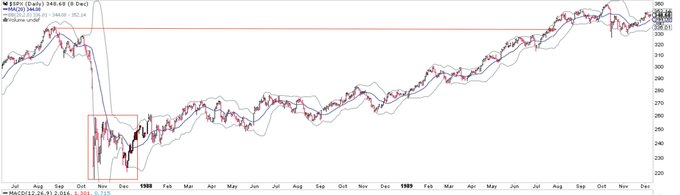
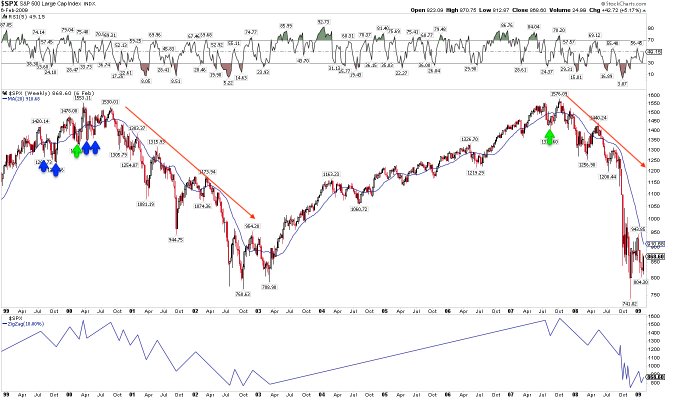
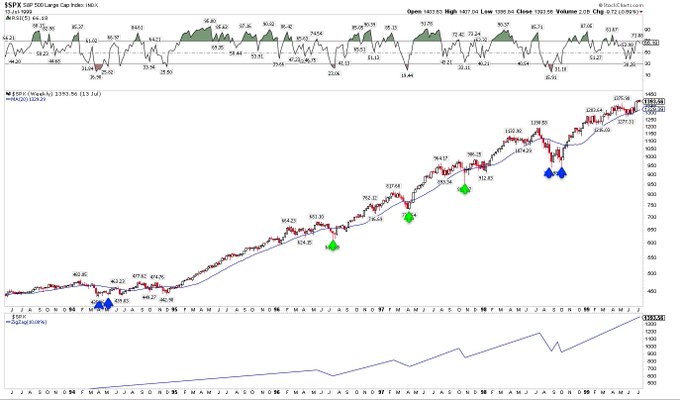
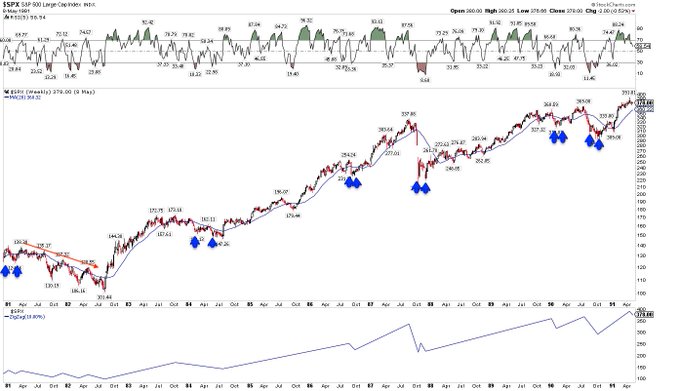
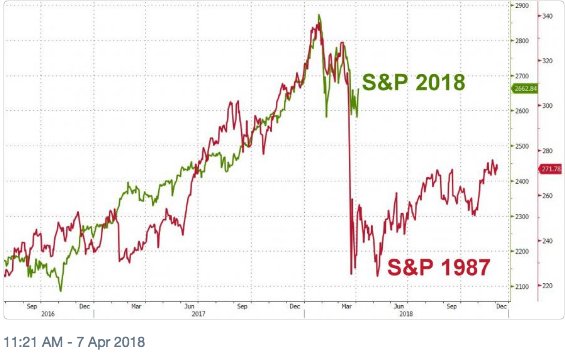
The only modern comparable to now is 1987
- $SPX fell 20% in one day, rose 15% the next 2 days, then returned to the low the following week
- Then rose 15% again and then retested the original low 6 weeks later
- It was up 25% a year later and back at prior highs 2 years later
54
335
1K
Some personal news. Please read and share. From The Fat Pitch
216
97
887
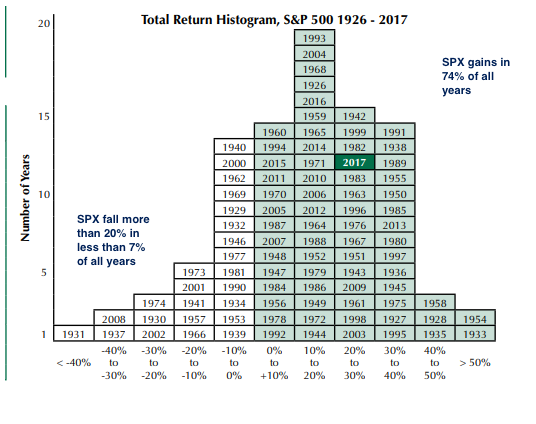
The single most important chart to understand the stock market. Gains happen 78% of the time. It's 6x more likely to gain >+15% than lose <-15%. You are hard wired to avoid risk and that's why almost everyone underperforms


17
149
729
When I used to write a monthly macro update, this was the precise point I'd made. You set your sails based on macro and trim based investor psychology. That’s how this works


7
34
202
17
94
586
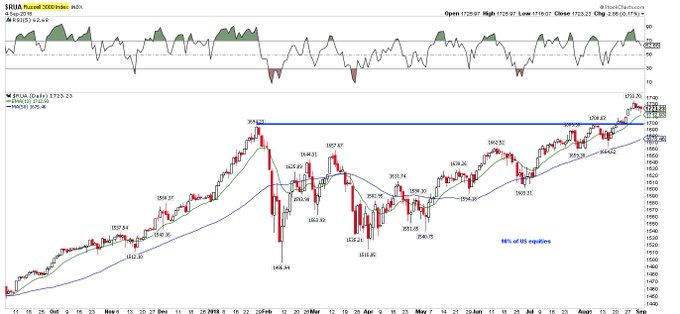
Nearly 1900 stocks ticked up at the open. This is the highest in 10 years and probably of all time $tick $spx
27
143
560
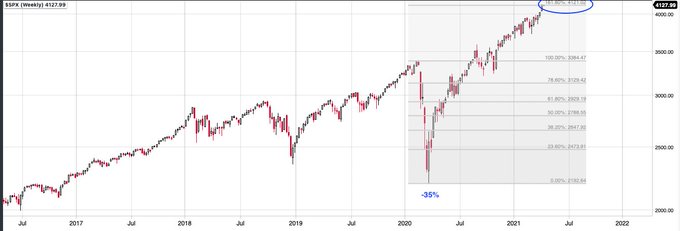
$SPX has reached the 162% Fibonacci extension of the Covid plunge. A short thread on why this *might* matter
32
120
551
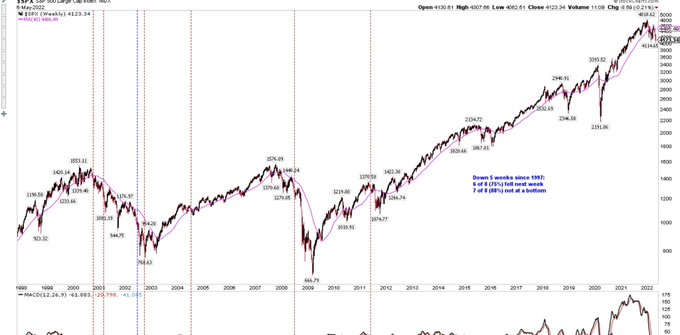
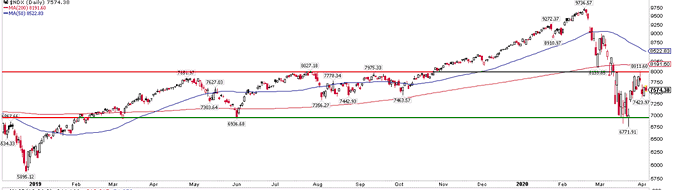
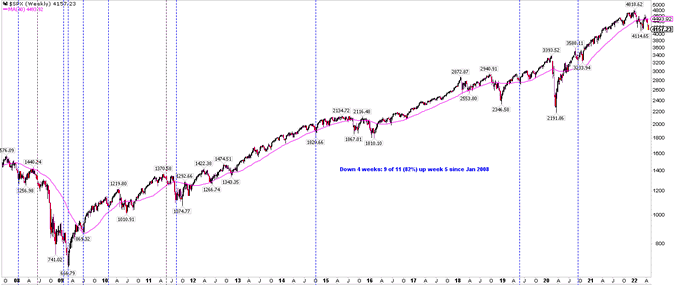
$SPX down 5 wks in a row for the first time in 11 years and only the 9th time in 25 yrs. Notes on chart
29
133
544
The last time $DJIA fell 10% from an ATH in less than 2 weeks was 1928
27
210
474
At ATH: ‘market is overbought’
Down 5%: ‘it will fall 10%’
Down 10%: ‘it will fall 20%’
Up 5%: ‘bear market rally’
Up 10%: ‘it will retest low’
Up 15%: ‘low is in, now overbought'
20
59
478
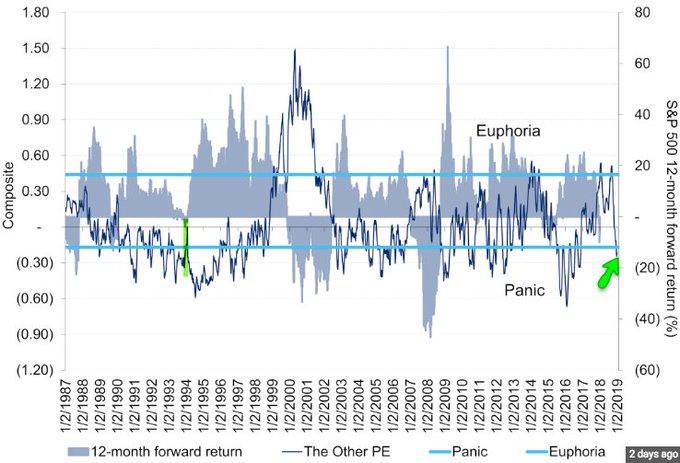
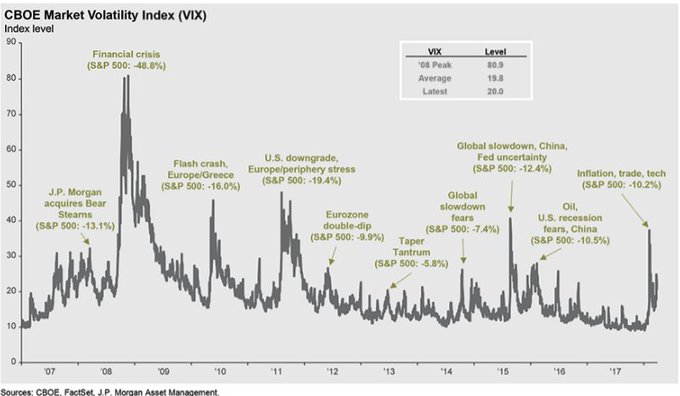
$Vix under 15; it normally stays elevated during a bear market. Number of times it has fallen under 15 during an ongoing bear market in the past 30+ years: zero. More evidence the low in $Spx was two months ago
48
129
460
Equities have fallen and can’t seem to get back up. What is going on here? New from The Fat Pitch
31
124
450
What usually happens in the stock market versus what gets written about most often
14
154
446
Long story short, it doesn’t matter if this is the longest bull market ever. That’s not how any of this works
7
59
442
Stocks can go sideways longer than you can be alive. Just sayin
40
109
436
If you’re not enjoying the irony of 5, 10 and 30 year yields at 7 month lows on day of rate hike, you are missing the rich beauty of life
8
154
428
Equities are in a consolidation phase. These can last a half year, or longer. The 2018 high likely lies ahead. New from The Fat Pitch
30
149
419
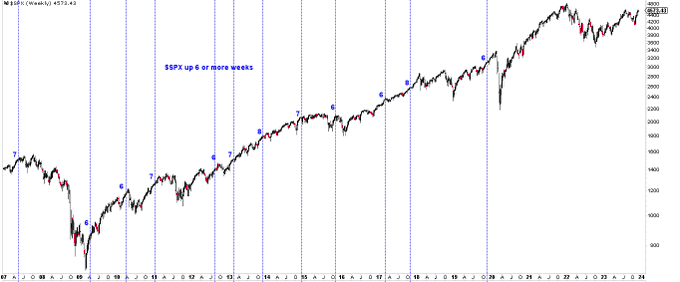
If $SPX holds today's gains it will be up 5 weeks in a row. It has not been up 6 weeks in a row this decade
20
83
425
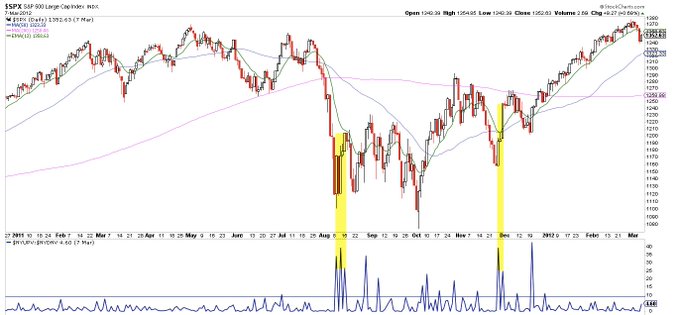
TDA clients net sellers in December (green line). Sentiment about as low as it has gotten in the past 13 years
23
88
418
This might feel like the start of a bear market, but that is the least likely outcome. New from The Fat Pitch
17
140
412
An objective investor should be bullish 80% of the time. From First Trust and Schwab
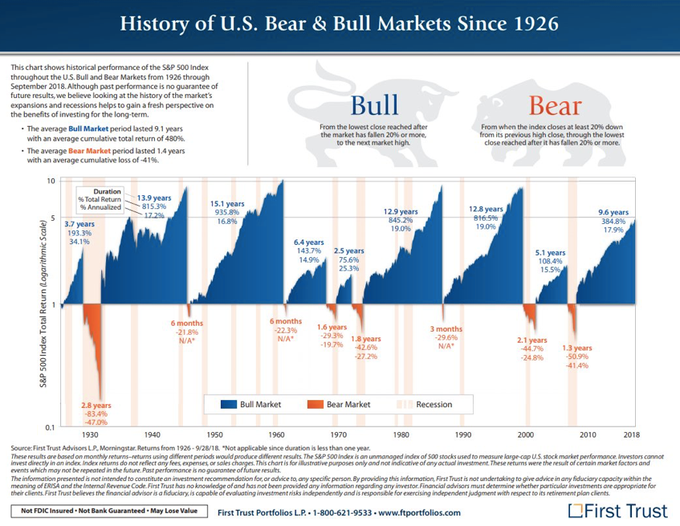
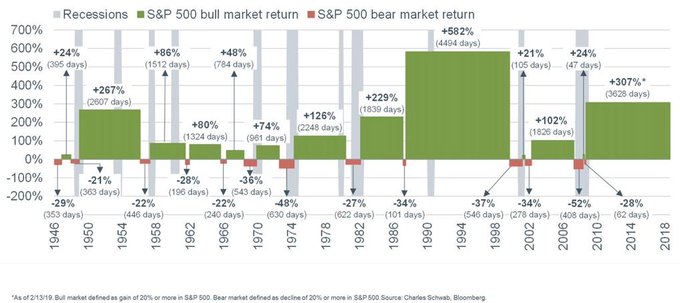
18
137
402
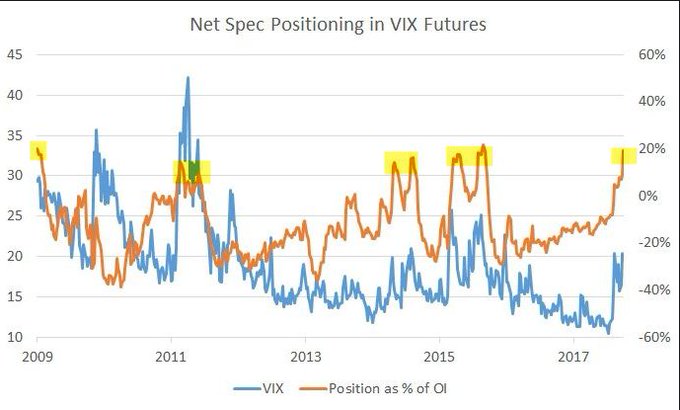
Not sure where the "$Vix must be +40 for there to be a low" comes from. 6 prior corrections of 10-20% since 2009, 3 bottomed <40. The 1990 bear market bottomed with $Vix at 36.
27
92
396
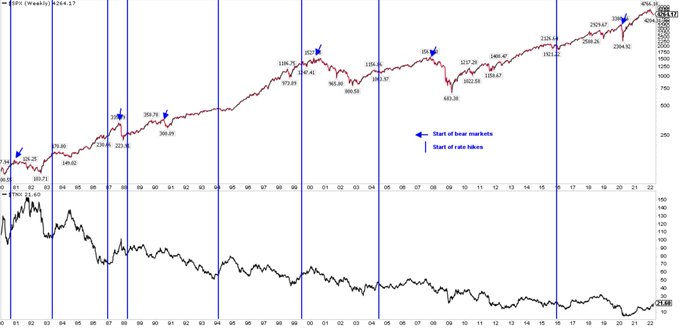
Tomorrow the FOMC is expected to raise rates for the first time in the current cycle. You’d have to go back before even the geezers on FinTwit were born to find a case where equities peaked BEFORE the first hike. Shown here is just the last 40+ years
22
86
391
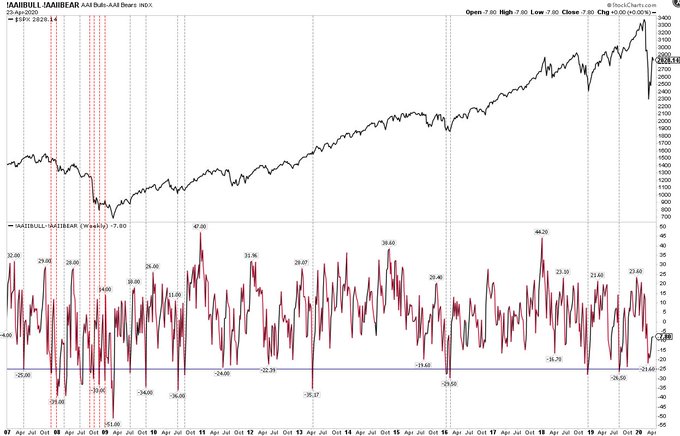
Two weeks later and ‘retail’ sentiment is still weak (-29%). Same conclusion $spx
Likewise, AAII bulls minus bears at -25% this week. That’s bearish sentiment. A durable low in a bull market, but not in a bear market $spx
4
23
120
20
70
371
This is the “low retest” that accompanies most market corrections. The trend is bearish, but the balance of evidence suggests this ultimately resolves in favor of the bulls. New from The Fat Pitch
28
108
371
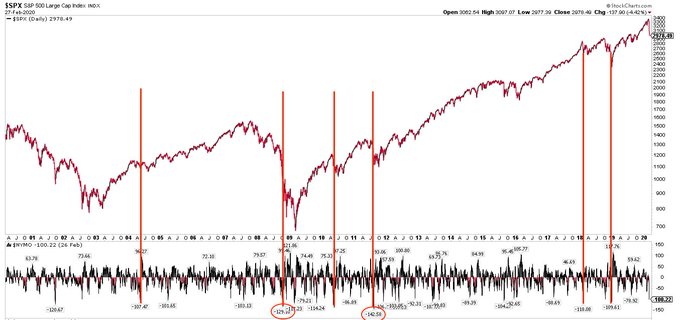
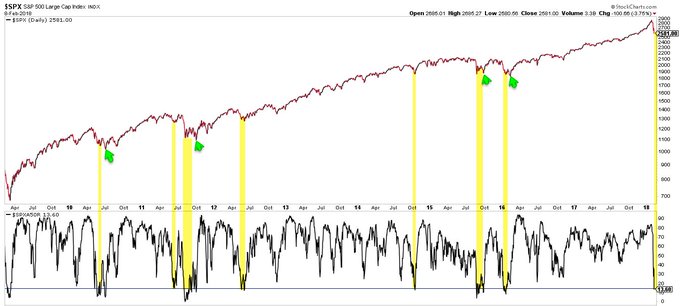
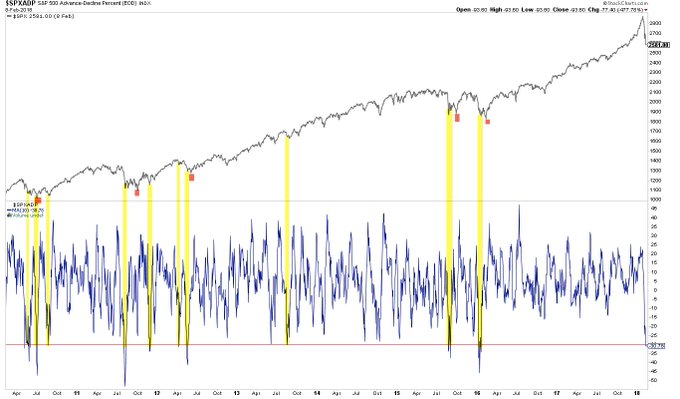
Breadth: $NYMO -127 at the close. Last 20 years, only 2 closed lower. $SPX continued to sell off after each. This kind of momentum isn’t how lows in $SPX usually form
23
115
370
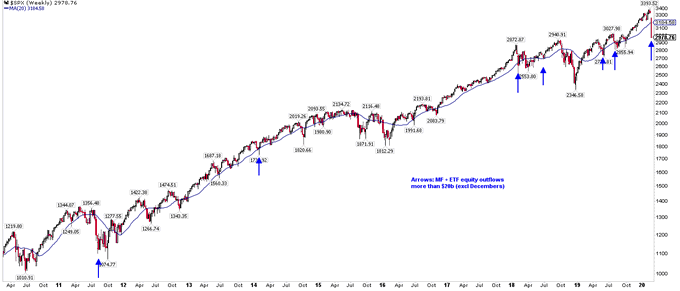
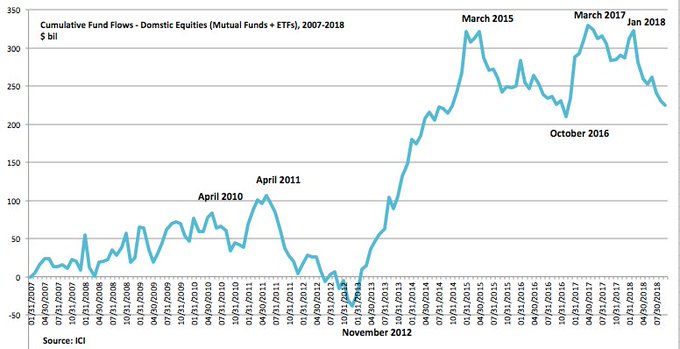
Massive $62b outflow from equity mutual fund and ETFs last week. That’s never happened before (Lipper)
27
99
355
One Hindenburg Omen signal has fired. This marks tops about half the time. The best take has been that clusters are a useful signal, so watch for that
16
60
360
US equities fell 20% but have since rallied 8%. Two similar rallies in Nov and Dec failed. What’s different this time? New from the Fat Pitch
19
90
348
Exactly a year ago $SPX plunged 35% in 4 weeks (fastest ever!) and then jumped 70% so, yes, there has never been more 52 week highs than now. It’s a math thingy
5
36
352
A market that bottomed 9 days ago while cases rise and macro data worsens is a market that has stopped panicking and accepted that news will be bad for a while $NDX
38
81
348
Breadth has been so bad that Summation (momentum) will drop -1000 tomorrow, just the 6th time in 20 years. Marked the low in 2019 and 2009, the initial low in 2002 and the start of July 2008 rally. It also meant nothing during the Oct 2008 panic $spx
10
89
343
The current equity trend is being termed unprecedented; it’s not. It's also being called unsustainable, but in most prior cases, equities have continued higher. New from The Fat Pitch
20
133
343
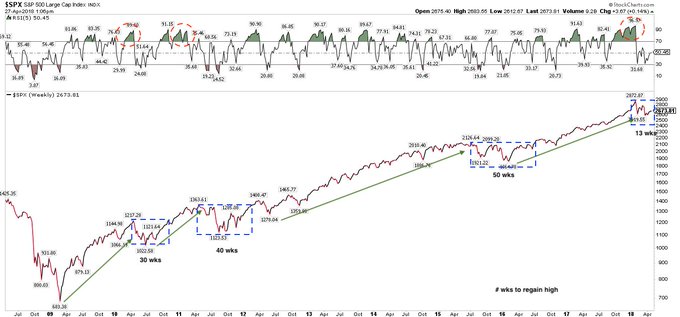
So far, this is one of 56 pullbacks since 1945. On average, $SPX takes 2 months to regain all of the loss

11
128
337
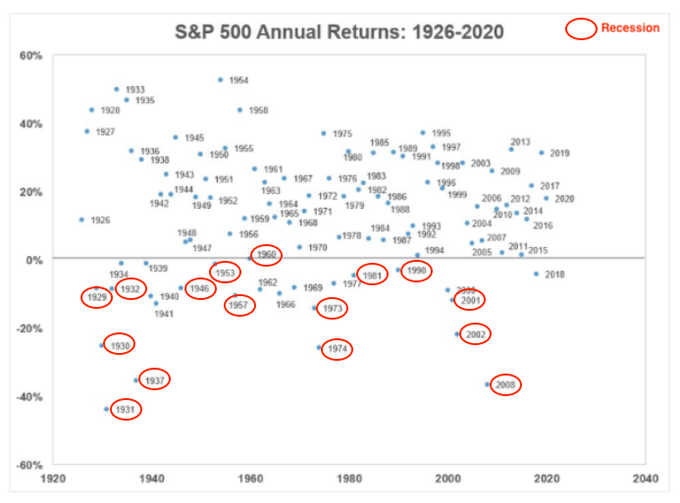
If you bought the S&P in 1997 and held it for the next 20 years - a period which included two recessions and stock market crashes of 50% and 60%, the largest of the past 80 years - your return would still have been 300%
An objective investor should be bullish 80% of the time. From First Trust and Schwab
18
137
402
28
105
317
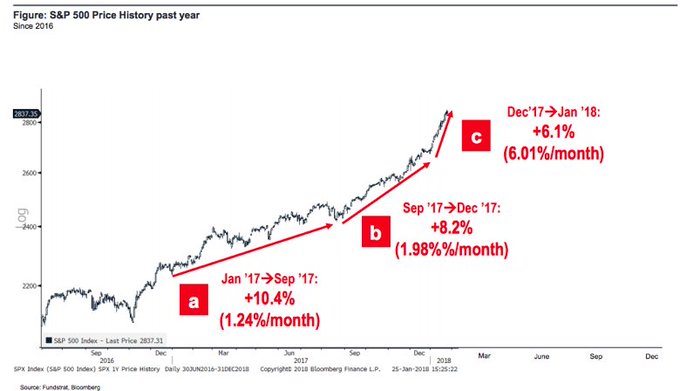
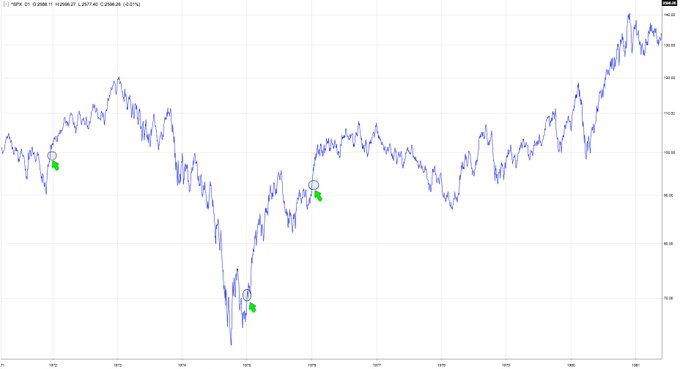
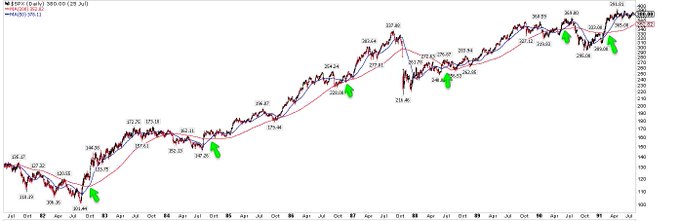
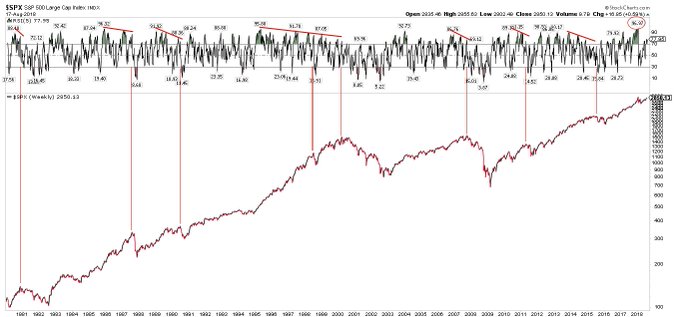
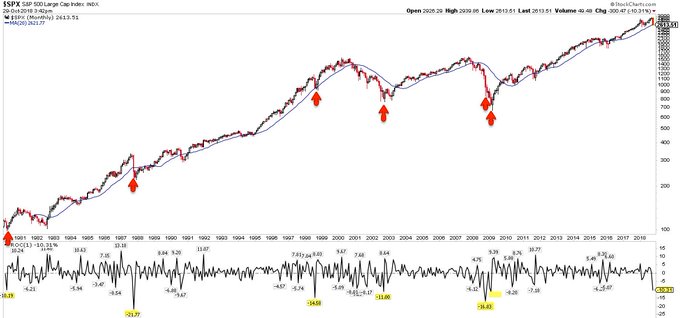
It’s 1987 time again. Here are some of the other 30 times it’s been 1987 in recent years
27
124
317
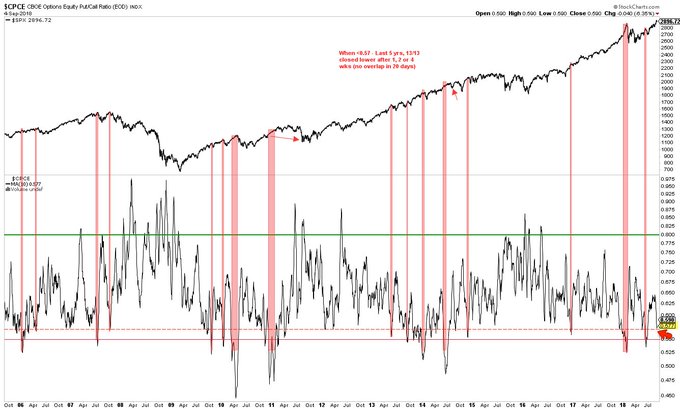
Today’s equity only put/call ratio (0.5) was the lowest since the peak in $SPX on Feb 19
10
68
323
If you have a factual point to make, show the numbers, the chart, the facts. Otherwise it’s just postulation and not very useful. jmo
25
35
306
The bearish trend in equities should not be taken lightly. But the set up for higher prices, at least before a significantly lower low, appears strong. This is not a certainty, but it is a high probability. New from The Fat Pitch
13
99
318
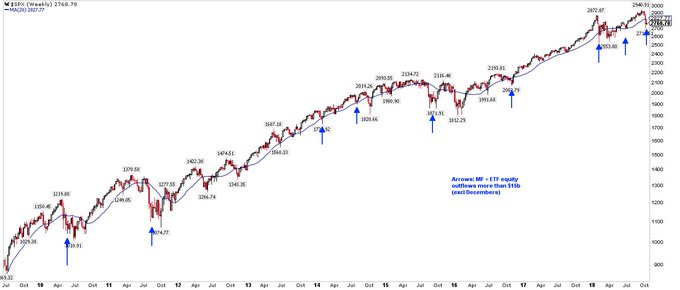
Sentiment: Substantial -$22b outflow from equity MF + ETFs this past week. When this happens outside of December, at least a near-term rally is not far off (arrows) $SPX
28
85
313
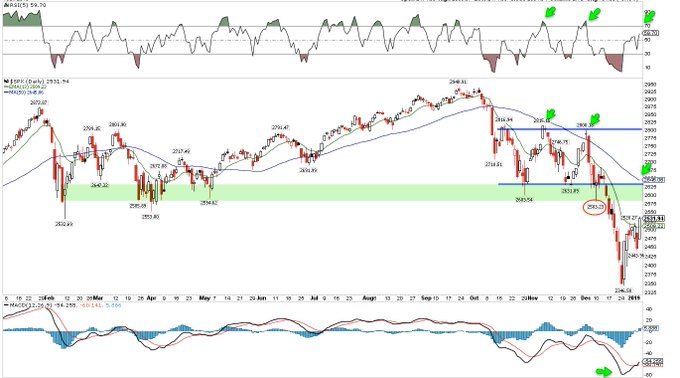
US equities are closing in on new highs. Meanwhile, fund managers’ risk exposure sinks to a 2-1/2 year low. New from The Fat Pitch
16
104
314
This doesn’t look like a bear market. New from The Fat Pitch

18
98
308
All baby boomers will have retired in the next 10 years. Behind them are generations 3 times larger, all in the working age population
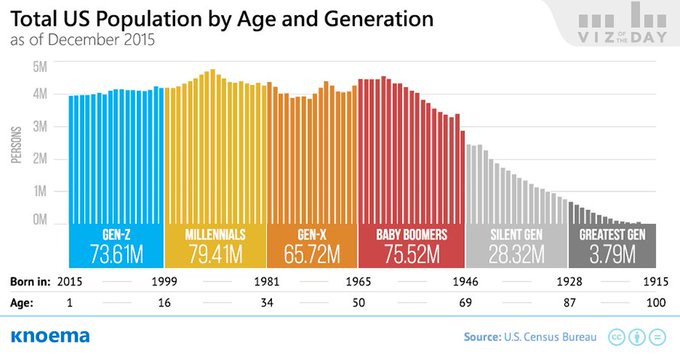
20
166
303
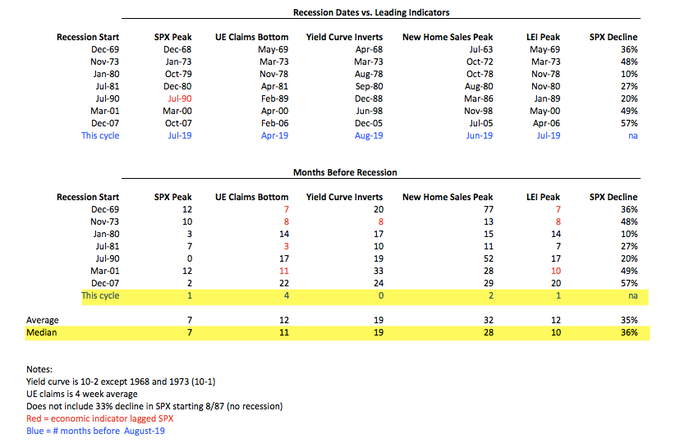
In the past 50 years, 10-2 yield curve inversion has occurred an average/median of 19 months before the next recession and 12 months before the final peak in $SPX
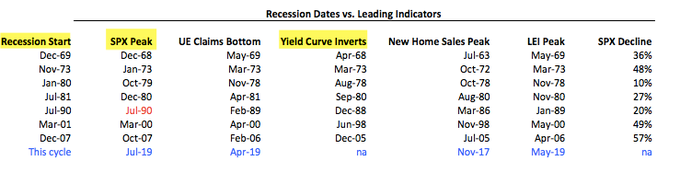
16
140
299
Historically, a 3% dip takes place on average every 1-3/4 months and a 5% dip every 3-1/2 months. We haven't had more than a 2% dip in over 3-1/2 months $SPX
10
43
304
Stocks fall further and faster from an ATH than any time in the past 90 years. What happens next. New from The Fat Pitch
11
114
296
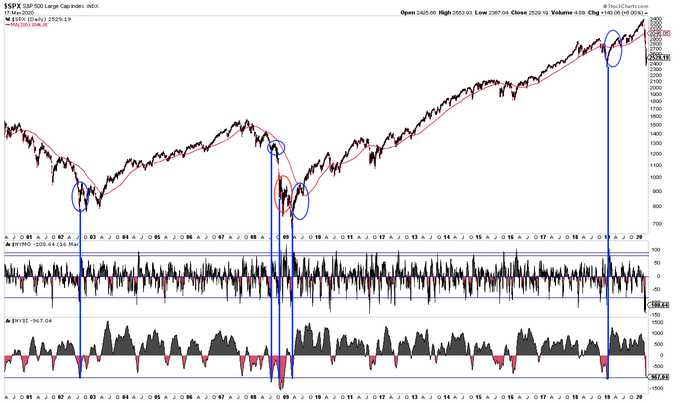
$SPX bullish percent index (the percentage of stocks on a P&F buy signal) has fallen to the level at the March 2009 low
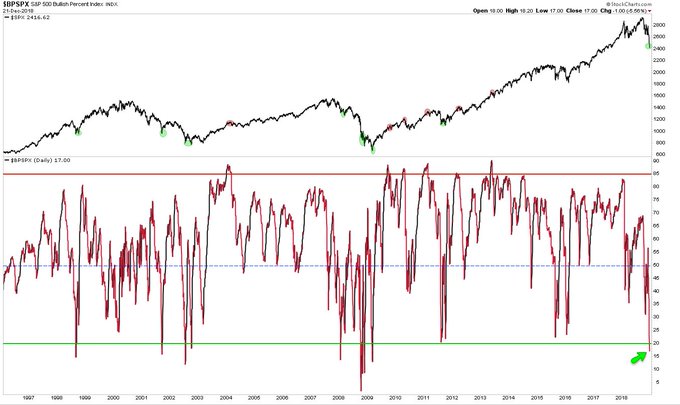
28
126
294
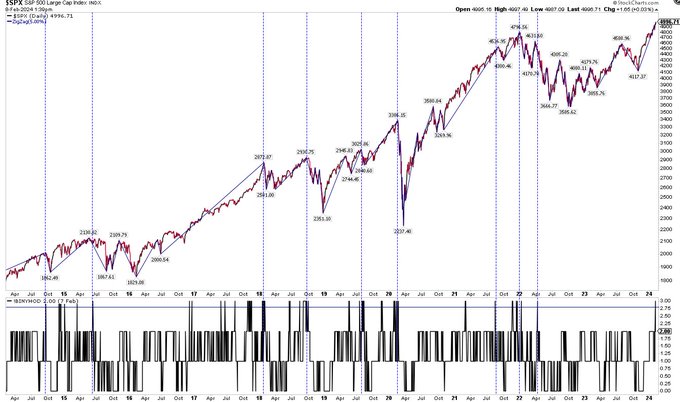
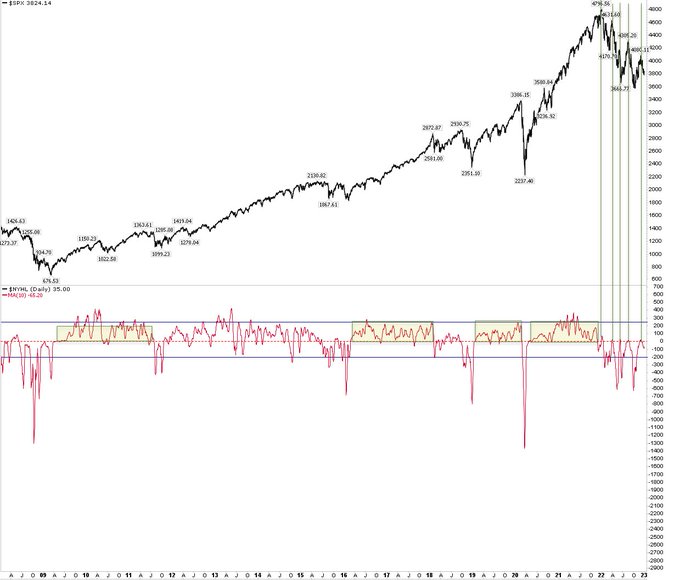
At its closing low, $SPX fell 25.5% in 2022. Almost all of that (93%) happened by mid-June. Since then, more sideways than down (i.e., a possible base). 4100 then 4300 key upside
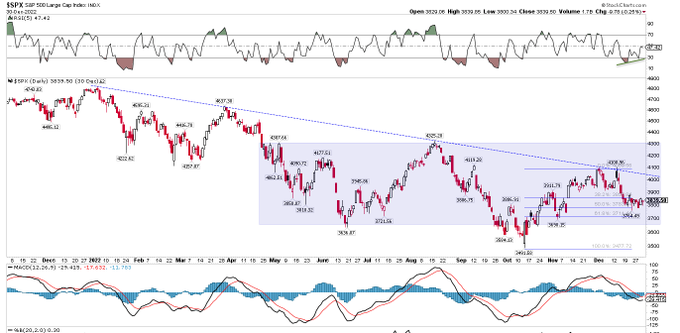
13
43
301
Persistent selling and volatility like this is ultra-rare (like once in 50 yrs rare)
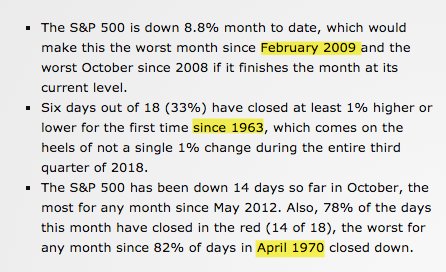

Here's a special blog taking a look at 5 takeaways from the rough October ride ...
1
11
32
13
111
292
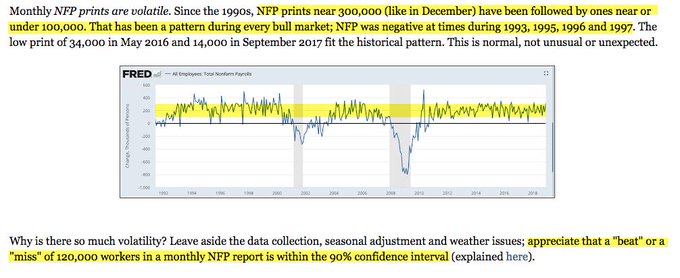
If you’re surprised by today’s weak NFP after last month’s blow out NFP, then you don’t know jack about NFP
15
92
296
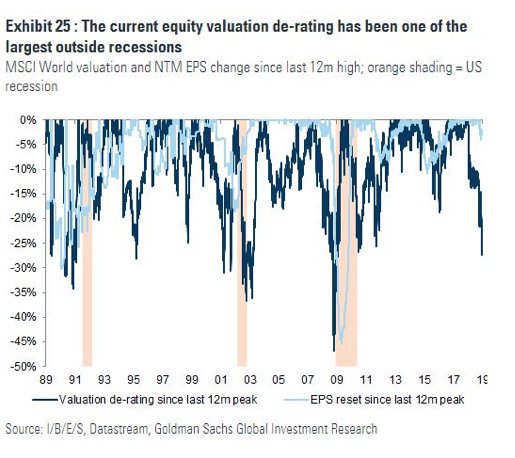
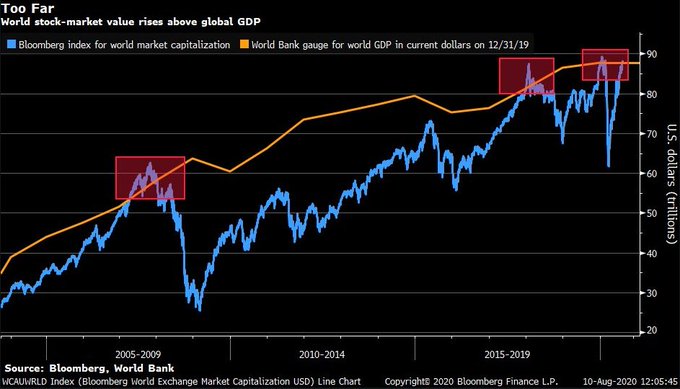
This valuation chart from Bloomberg is making the rounds, showing that world equities are overvalued because they exceed world GDP, like 2007, 2017 and the start of this year
15
97
294
A trend following sell signal triggered today. What happens next. New from The Fat Pitch

8
84
290
The beauty of ‘the market’ is that the same things happen over and over but far enough apart that many forget and repeat past mistakes over and over
7
35
296
$SPX up 3 months in a row by >15%. Since 1980, 9 other instances. None was a top, all mostly were the initiation of an uptrend, but a few 3-7% corrections in the interim (circles)
10
60
292
2020 so far
Fastest bear market
Highest % down days
Fastest bull market
Shortest bear market
Highest % up days
Best 5 month gain
Fastest correction
4 months left. Good luck
10
56
279
The whole ‘people are going to forever leave big cities and telecommute from cheap suburbs’ strikes me as 1) being advanced by pundits who already live in suburbs (projection) and 2) the latest example of recency bias
23
25
284
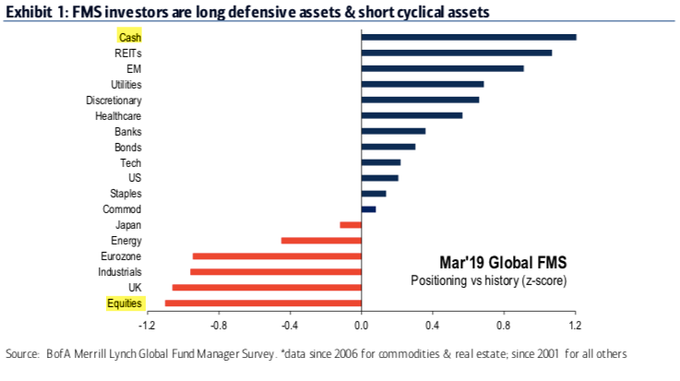
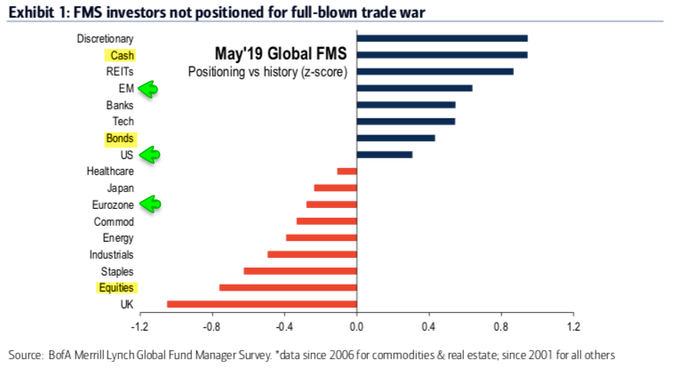
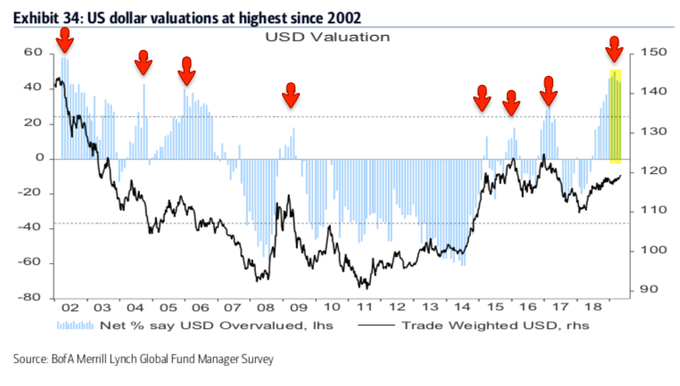
Global fund managers:
- Overweight cash
- Equity allocations almost a standard deviation below avg
- Bond allocations at a 7 yr high
- View $USD as most overvalued in 16 yrs
New from The Fat Pitch
10
99
283
$SPX down 2 days in a row. Hasn’t been down on Day 3 since March 9. Looking at you, Monday
15
35
274
If you assume the stock market is fairly random (with a long term bias higher) and that you use fundamental and technical analyses to get a slight edge, you’ll be on the right track (and a lot happier)
11
39
279
Golden Cross likely within 3 days. Since 1980, not something that has happened during an ongoing bear market $spx
21
79
274
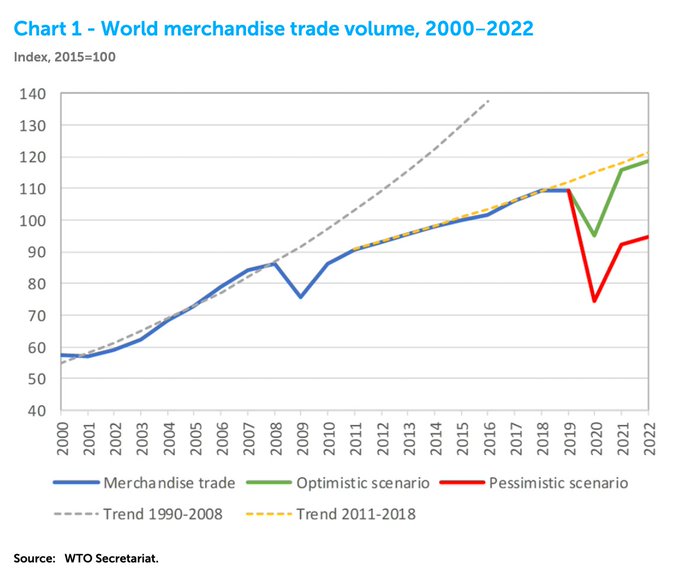
Plunge and bounce. All the market is doing now is debating whether we’ll be on the red line or the green line next year

World merchandise trade is set to plummet by btw 13 and 32% in 2020 - either of these numbers would be shocking & the range btw them is an indicator of our uncertainty right now.
@wto
basically saying we have no idea but its definitely terrible!
1
43
87
11
55
270
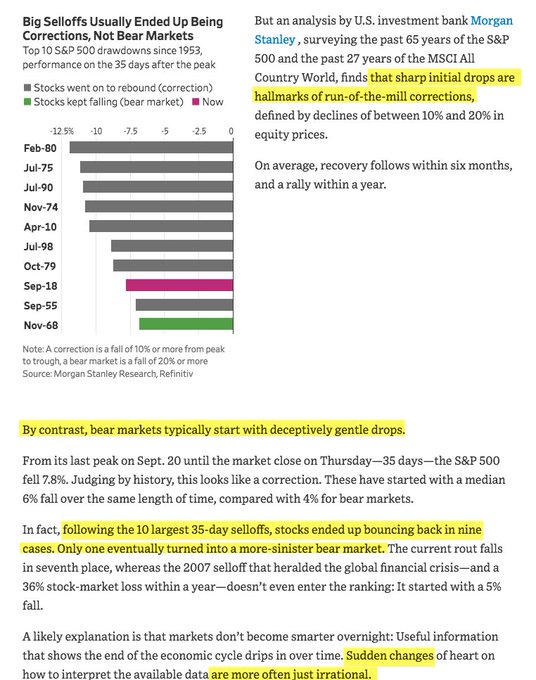
WSJ: following the 10 largest 35-day selloffs (this one is ranked 7th), stocks ended up bouncing back in 9 cases. Only 1 turned into a bear market
11
97
269
Holding overnight? In the past month, more than 100% of the gain in $SPY has been overnight. Gap ups 19 of last 22 days. Cash hours net negative
17
86
258
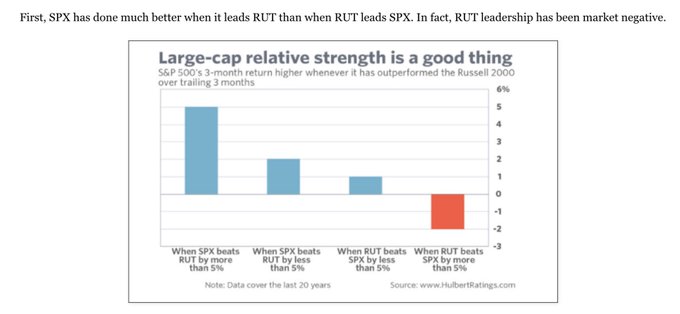
If you’re looking at small caps, remember $SPX is 80% of total US market cap and $RUT is about 8%. It’s the tail, not the dog.
Also, this
10
48
269
$SPX is down about 9% YTD. Anything can happen but, historically, for it to end the year with a loss like this, the economy would have to be in a recession (red circles) or the US in a world war. Chart from
@SethCL
; annotations are mine
15
70
265
Every rally in the past yr has stopped when $NYHL (10-dma) has gotten back to neutral (bottom panel). It'll be a useful confirmation of a new uptrend when it backs/stays above 0
9
45
266
Other times $SPX has fallen >13% without it becoming a nasty bear market
24
43
267
$VIX down 7 days in a row for the first time since March 2021 and Aug 2020. Neither made it to 8 in a row. Pretty uncommon
9
41
265
$SPY up >8% this month AND above its 10-mma.
only 8 prior instances in 30 yrs, of which 2 were stinkers (2000 was a mega stinker, 2015 was a mini). The other 6 went zoom
10
46
259
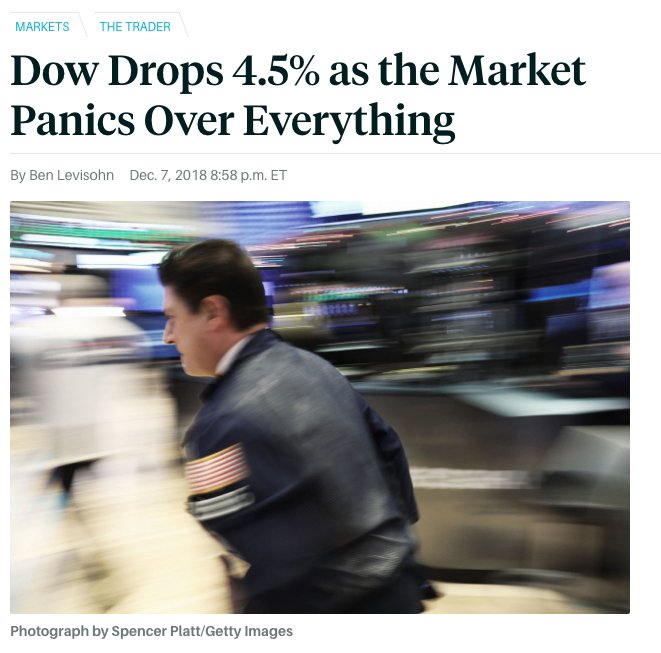
It was a quiet day on Wall Street today, with the S&P fractionally lower and the Nasdaq gaining 0.1%
23
18
258
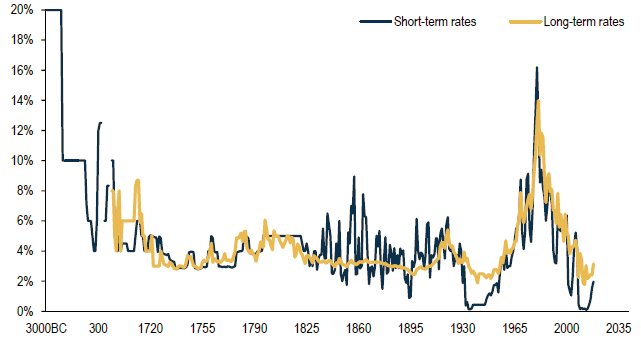
Note the central bank policy error in 300 AD that led to a 1400 year recession

10
60
250
$SPX down 4 wks in a row. Only 11 instances in 14 yrs. Tends to rally the next wk Two exceptions: 2008 bear market and in 2011 when the 4 wk drop was less than 3% vs nearly 9% now
13
53
255
1. Trade war rhetoric is driving equities
2. Speculators now view continued volatility as a guaranteed bet (it’s not)
3. The end of the long 200-d streak for $SPX usually leads to very good returns
New from The Fat Pitch
10
90
246
If it was obvious that lumber was going to fall 70% and bitcoin was going to jump 30% you probably wouldn’t be selling newsletter subscriptions on twitter
6
19
252
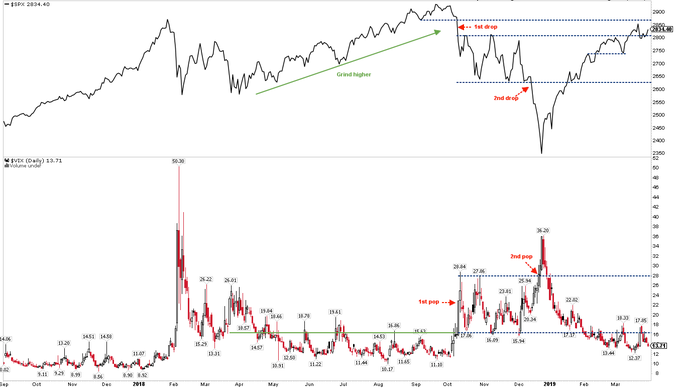
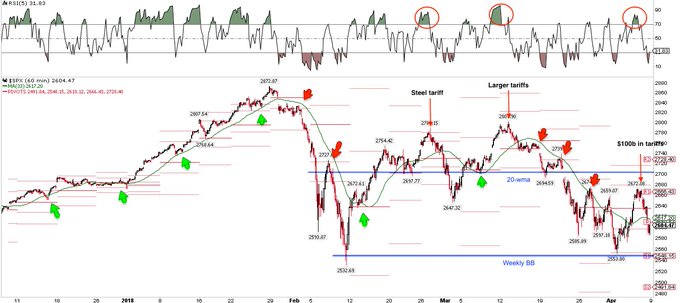
$SPX - still in the hot mess that started 2 mo ago. Wild guess: it’s a base. The 2640 area could probably withstand a 3rd hit. Next time to 2800 area (4th) likely ignites fomo
26
66
237
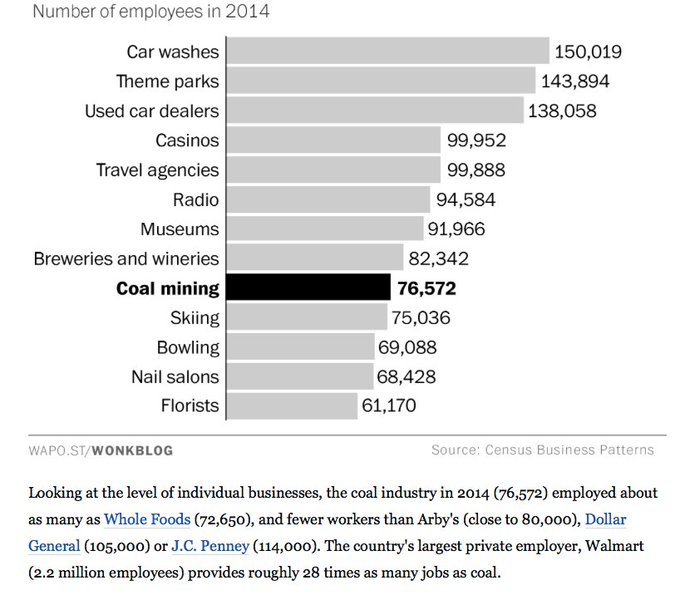
The entire coal industry employs fewer people than Arby’s (WaPo)
14
148
231
This is my view. It may be wrong. You may disagree with it. We are not all going to agree, and that’s ok. Your job is to read widely, do your own analyses, form your own opinion, make your own decisions and live with the results. That’s how this works
13
12
226
US equities are likely going higher by year-end. Risks are mostly short-term. New from The Fat Pitch
7
76
230
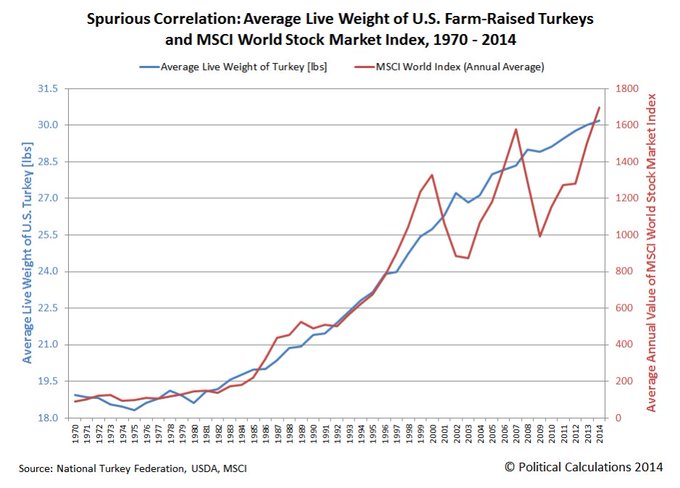
The US stock market also has a very high correlation to the average weight of live turkeys (r-sq 0.96)
23
82
230
Versions of this chart are making the rounds. The idea is that we are 285 days from last year’s low and 285 days after the 2009 low, $SPX plunged 15%. So, should you worry? A little thread 1/x
16
51
229
A reliable way to make people believe a lie is frequent repetition, because familiarity is not easily distinguished from truth - Kahneman
8
89
224
The great thing about mute is that trolls spend their time writing and you don’t spend any time reading it
10
10
220
Economists stink @ predicting recessions. So do fund managers, corporate insiders, retail investors, newsletter writers, Wall St analysts, twitter pundits, that dude from Yale, the Fed & lobsters. Expect to be wrong, try to be less so than most & you’re on the right track
14
52
223
Momentum suggests stocks rise into year end, but US equities now have a topping pattern in place. New from The Fat Pitch
13
76
223
Strongest gain since June 2020. Gurus say days like these are just bear market rallies but that isn’t true. More than a few at lows or during uptrends $SPX
23
44
224
A lot of time left but 3 good things today so far.
One, $SPY breaking the pattern of lower highs. Wild guess is 392 (WR1) magnet and (5th time is the charm) goes higher
Two, $NYMO positive for the first time since Feb 16. Now, +7
10
31
219
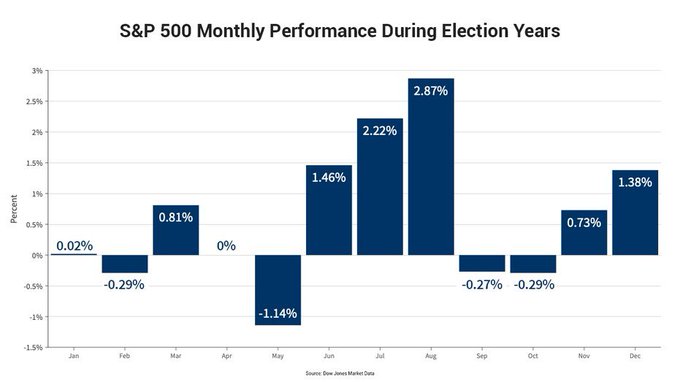
What to expect in an election year? Based on the averages:
1. Chop/flat through April
2. May swoon
3. June-August summer ramp
4. Flat Sept-Oct
5. Post election ramp into year-end

Here's how the S&P 500 performs during election years $SPY
Buy the May dip for the summer rally? 🏖️
14
103
422
7
47
222
Buffett’s a net seller. Accumulating cash. Not being greedy while others are fearful
38
55
215
Rising possibility of a recession in 2020:
- Employment growth weakening, lowest in 7 yrs
- 3Q19 real GDP growth expected to fall under 2%
- Housing starts and permits growth is slowing
- Manufacturing weakness broadening
New from The Fat Pitch

22
83
212
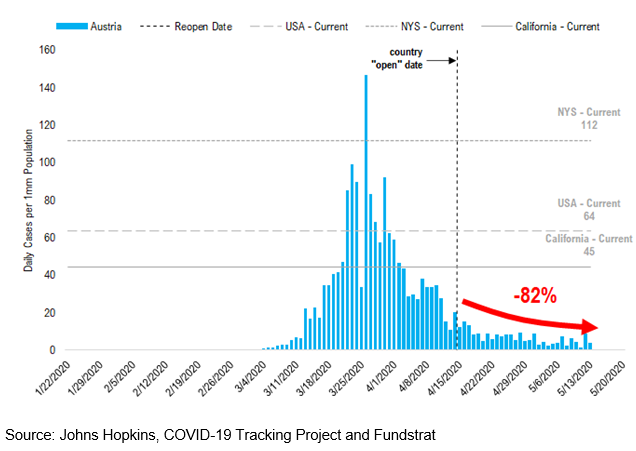
Austria Has 90% Drop in Coronavirus Cases After Requiring People to Wear Face Masks

@jonnajarian
Since the Austria eased restrictions 1M ago, daily COVID-19 cases have fallen another 82% since then...
18
43
139
23
84
215
$SPX down more than 10% in one month six other times since 1980. Last one was Feb 2009
11
104
215
How $SPX has traded from its high during OpX week (vertical lines) until the end of the month (shaded rectangle). Last 6 months
11
47
216
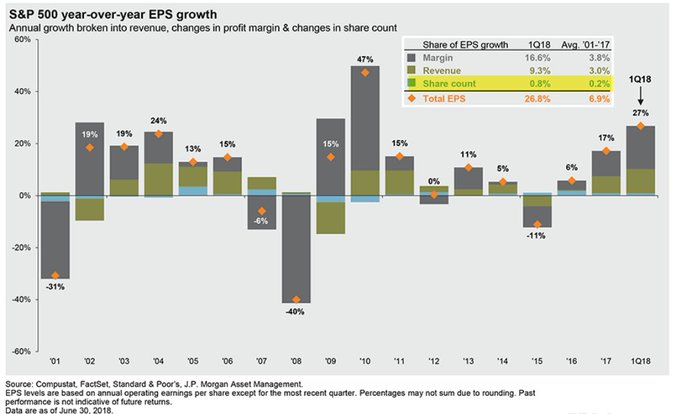
97% of EPS growth comes from margins or revenues, not buybacks (share reduction). From JPM
7
96
218
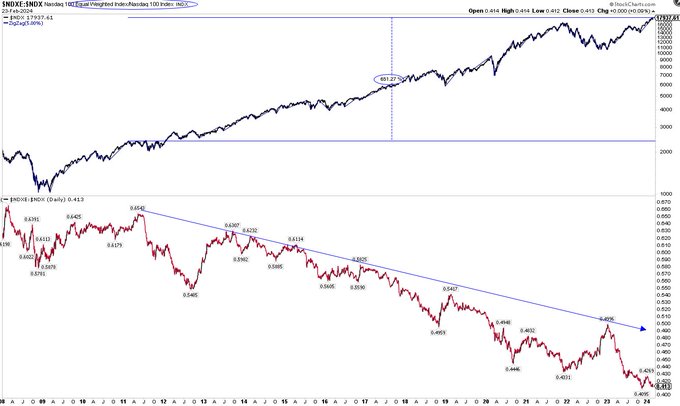
Nasdaq breadth has been narrowing for 13 years during with the index has gained 650%
11
42
218