
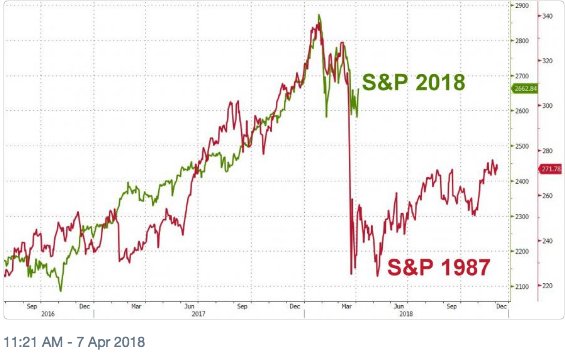
It’s 1987 time again. Here are some of the other 30 times it’s been 1987 in recent years
27
124
317
Replies


@ukarlewitz
awesome! 1987! I was back in college living it up at San Diego State! oh, those were the days...to relive them again.
0
0
6

@ukarlewitz
The drop is coming...question is will it stay down... Not breaking or retesting Feb low feels unnatural
0
0
1


@ukarlewitz
There was a very popular version of this chart in Nov '87: the Oct '87 crash with an overlay of the 1929 crash. It showed crash, stabilization, then another 75% down move into 1932.
0
0
2


@ukarlewitz
Wish I bought the market at the 1987 high with every penny I got when the $SPX peaked at over 330 and the $DJIA peaked around 2700.
0
0
0

@ukarlewitz
Just visually, I would move the 2018 graph about 2 years to the left. If seems to correlate better.
1
0
0


@ukarlewitz
Funnily enough, most market blow-off tops and subsequent nose-dives look vaguely smilar if you superpose, shamelessly squash time and price scales, and then squint determinedly at the result...
0
0
2


@ukarlewitz
Is it me or does the 1987 chart no look so bad? So if you hold on, about 8 months after you’re down 17%...and that’s literally if you bought everything right at the tippy top
0
0
0
