
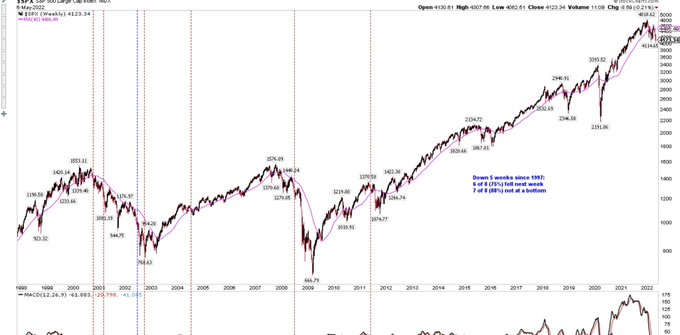
$SPX down 5 wks in a row for the first time in 11 years and only the 9th time in 25 yrs. Notes on chart
29
133
543
Replies


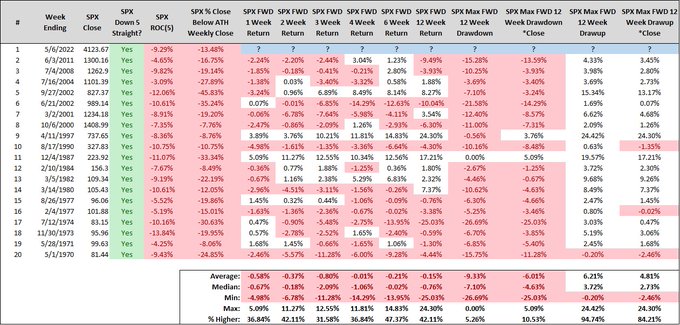
That's now a 5-week losing streak for the S&P 500, the 20th since 1970, which I think most would believe precede really strong market climates over the forward 3 months.
But that belief would be "just a bit outside!"
14
58
248
1
5
37
$SPX seems likely to finish lower 6 weeks in a row (scroll up). Since 1990 (not shown), it has fallen on Week 7 once (March 2001; red circle). Week 6 was the low once (Oct 2002; red arrow). Small n. Charts from
@TradewellApp


1
14
36
For completeness, $SPX fell 6 wks in a row once between 1990 and 2000 and it was up in Week 7 (Aug 1990) but that was not the low (which came in Oct 1990)
2
3
20
Mostly what you should take away from this is that down 6 wks is a rare event (7 instances in more than 30 yrs). With that major caveat, 6 of 7 up the next week and 6 of 7 not at The Low
2
9
73
$SPX ends the week down-2.4%, just the 8th 6-wk loss in more than 30 yrs
Mostly what you should take away from this is that down 6 wks is a rare event (7 instances in more than 30 yrs). With that major caveat, 6 of 7 up the next week and 6 of 7 not at The Low
2
9
73
3
5
31
Since 1980, $SPX has fallen 7 wks in a row only twice (arrows). In 1980, it was The Low. In 2001, it fell another 6% the next wk, rocketed 15% the next 2 mo and then dropped another 1-1/2 yrs. n=2


5
9
65
As of right now, it’s the worst 7-wk in a row tumble on record. -15.7%

7 consecutive down weeks is a lot for $SPX. Only 3 other instances ever. Interestingly, the amount lost over the 7 weeks was very similar each time. (Forward results were very different if you bother to look at charts.) Anyway...rare air here. $SPY

10
20
100
3
10
44
Worst start to a year since Tricky Dicky.
The worst starts to a calendar year for the S&P 500, through May's close, are:
1970: -16.85%
1962: -16.66%
2022?
We're currently down -19.31%.
< 3,962.60
Prediction:
We close May 31st > 3,962.60.
(Who remembers my garbage points tweet from March 2020?)
5
6
40
0
2
15


@ukarlewitz
And $SPY $SPX $DJI $DIA $IWM first April Bearish Engulfing Candle in 20yrs. $QQQ, never before this April.
Think about that.
0
1
4


@ukarlewitz
@Jedi_ant
This is the soft landing, instead of just getting March 2020 and stop the pain they are going to bleed this thing out slow. This will destroy a generation of investors for sure.
1
0
6

@ukarlewitz
@87AlwaysRed
Remember that huge market rise after the corporate tax reform? Wait until Biden’s tax increase and minimum tax on corporations
0
0
5


@ukarlewitz
Percentage of stocks above 200 day MA.
5 Red QTLY Candles
Comparison with same March 2008

1
0
2
