
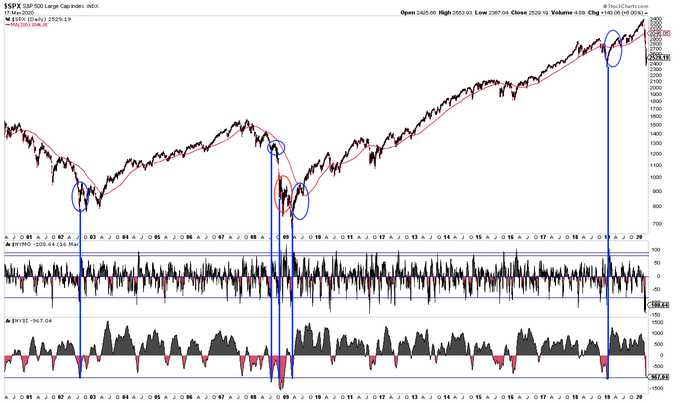
Breadth has been so bad that Summation (momentum) will drop -1000 tomorrow, just the 6th time in 20 years. Marked the low in 2019 and 2009, the initial low in 2002 and the start of July 2008 rally. It also meant nothing during the Oct 2008 panic $spx
10
89
341
Replies
Summation keeps falling until $NYMO turns positive; in other words, aside from Oct 2008, this is about the time when a series of accumulation days (>3:1) start. Last time $NYMO was positive was Feb 20 ($SPX peaked Feb 19)
5
14
92
Two more Summation -1000 occurrences in 1998 and 1999. All except the last one (Dec 2018) gave way to a lower low in $SPX in the following weeks. Momentum takes time to work off
2
5
89
Breadth: momentum ($nymo) +30 today, so Summation will rise for the first time since the peak in $SPX 5 weeks ago. Scroll up for the chart
2
6
41
$SPX up 17% in 3 days, the most in forever. The 3-day avg up volume (breadth) is strong but nowhere near the most in forever (lower panel). Sometimes all clear, just as often not (arrows)

1
24
62
$DJIA now up 20% from last week. It rallied at least 20% three times during 2001-02 and twice during 2008-09. It’s not an all clear signal

5
31
111
Extremes in both drops and rallies like this has only happened twice before in the past 40 years - 1987 and 2008. N=2 but the low in $SPX was still ahead

4
40
163

Goldman on bear market rallies:
"Between September and December 2008, the S&P 500 experienced six distinct 1-6 trading day bounces of 9% or more, with some rallies as large as 19%. However, the actual market bottom did not occur until March 2009."

16
199
480
4
11
66
Breadth: The premature talk of a breadth thrust last week (scroll up) killed by today's 9:1 down volume (major distribution)
2
11
58
Here’s a link to check breadth every day. Some of these take a few hours to update after the close. NYUPV:NYDNV measures accumulation (positive) breadth days; NYDNV:NYUPV measures distribution (negative)
8
16
114

@ukarlewitz
Interesting post and stats. Sometimes these help you see the horizon through the fog. Good work.
0
0
0

@ukarlewitz
Thanks Urban. IMHO, too early in this thing to mark anything other than horrible technicals. I hope I am very wrong! Thank you for all you do - big fan.
0
0
1

@ukarlewitz
@BobBrinker
What exactly are you saying here? 40 years experience on Wall St and you lost me.
1
0
0


@ukarlewitz
Thx Urban;
NOTE: NASI will be moving into the -1250 area; a traditional "bounce" level for Nasdaq (ex Oct 2008)
$COMPQ $QQQ
0
0
0

@ukarlewitz
For more insight. We tagged and bounced hard off the 100 monthly moving average. + Fed circuit breakers with the trillions, should see some gargantuan moves ahead! If only I didn’t blow up with margin calls I would of said I could participate. Maybe next time!

0
0
0