
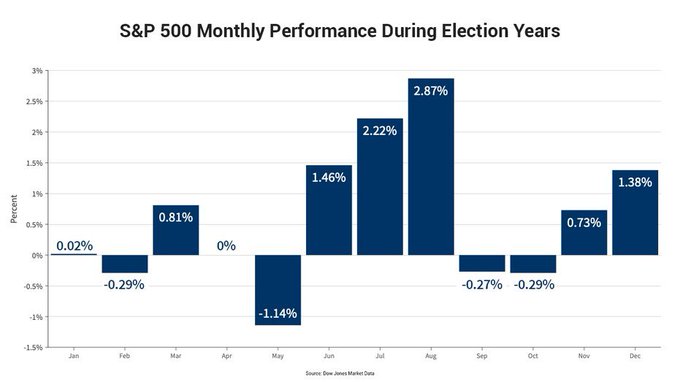
What to expect in an election year? Based on the averages:
1. Chop/flat through April
2. May swoon
3. June-August summer ramp
4. Flat Sept-Oct
5. Post election ramp into year-end

Here's how the S&P 500 performs during election years $SPY
Buy the May dip for the summer rally? 🏖️
14
103
423
8
51
240
Replies
But, if there's an incumbent:
1. Jan-Feb ramp
2. Chop/flat March-June
3. July-September ramp
4. Flat Oct
5. Post election ramp into year-end

Seeing a lot of seasonality chart this weekend. Here’s one for election years, specifically with a sitting president running (shown in green). $SPX $SPY

11
21
82
3
9
41
But, if $SPX was up 10% the year before:
1. Jan ramp
2. Feb-March swoon
3. April-Aug ramp
4. Flat Sept-Oct
5. Post election ramp into year-end

2
18
63
To summarize:
1. The year might start strong or weak or flat
2. There should be a swoon sometime before June
3. July-Aug should be strong. Might start in June. Or March
4. Oct flat. Maybe Sept too
5. Post election should be strong
3
8
52
The median annual drawdown is 11% for all years, and it's the same for election years (red boxes), so expect it. It could be just 6-8%. It's unlikely to be to more than 20%

1
4
36
The year is very likely to go higher (blue boxes) before the election (lines). The two losers (red boxes) were driven mostly by macro. Whether the incumbent party wins or loses is irrelevant

1
10
49
The median annual gain is 13% for all years; it's a bit less (10%) for election years (red boxes). It could be just 5%. It's unlikely to be 20% or more

1
1
28
Jan could end down 3% but the trailing 3-mo up 10%. In all but 1 of past cases, the rest of the year was up a median of 14%.

A January monthly close above 4,613.18 will leave the S&P 500's trailing 3-month returns above the 10% level.
Strength over the "turn of the year" (TOY)'s been popularized by
@WayneWhaley1136
& January's that end with 10%+ trailing 3-month returns support the notion - see below.

2
1
34
1
8
34
The consensus said this year would start flat (scroll up). Instead, up 5 of 7 weeks by 5.5%.
I still like this as a broad outline without falling into the trap of being too prescriptive
To summarize:
1. The year might start strong or weak or flat
2. There should be a swoon sometime before June
3. July-Aug should be strong. Might start in June. Or March
4. Oct flat. Maybe Sept too
5. Post election should be strong
3
8
52
1
1
18
Here's how the second half of February performed during the past 5 election years: two up, two flat, one down. Nothing to hang a hat on

1
0
5
And here's how the second half of all Februarys the past 20 years have performed : 7 up, 7 flat, 6 down. This is noise not signal


1
1
15
There are several different cycles you could follow (top of this thread). We'll know which one (if any) matters only with hindsight. It's not clear we are following any cycle right now so predicting the future with this doesn't make a lot of sense

It seems like the market is not following the expected pattern. While everyone is waiting for a pullback, there is a possibility that we may only be experiencing rotation under the surface and continue to move higher on an index level.

19
36
176
2
3
16
"Seasonally weak" February ends with SPX COMPQ NDX RUA at ATHs. SPX gained 5.2% this month and the seasonally weak second half gained 2%. Surprised? You shouldn't be. See below.
And here's how the second half of all Februarys the past 20 years have performed : 7 up, 7 flat, 6 down. This is noise not signal
1
1
15
3
6
28
Here's another seasonal roadmap for the year. We're not following any of these so far


2
3
19
Another seasonality chart

The chart below features the
@NDR_Research
2024 Cycle Composite for the NASDAQ. While we view cycle composites as second-tier inputs, this is particularly interesting given the current market environment.

2
9
66
1
1
14
Jan-March: expected to be weak or flat at best. Went up 10%
April: best month of the year. Down 5%
2
3
30
May: one of the weakest months in an election year. $SPY up 5%
Jan-March: expected to be weak or flat at best. Went up 10%
April: best month of the year. Down 5%
2
3
30
4
3
30
$SPY is up 13% YTD; we're not following the seasonal pattern (circle) at all, so there's no compelling reason to use it as a guide to the future. That said, the widely overlooked "base rate" is up to the right. See pinned tweet (chart from NDR)

1
5
34
June-August will either be flat/down or the best stretch of the year


5
5
22
July has been the best month of the year the past 9 years :)
But it was below average the prior 9 years :I
And it was the worst month of the year the 9 years prior to that :(


1
3
20
