

MarketCharts.com
@MarketCharts
Followers
6K
Following
2K
Media
114
Statuses
18K
Charts, backtesting, scanning and alerts, including breadth indicators for $SPX / $SPY, $MID / $MDY, $SML / $SLY, $NDX / $QQQ, $RUT / $IWM, ETFs and more.
Joined March 2009
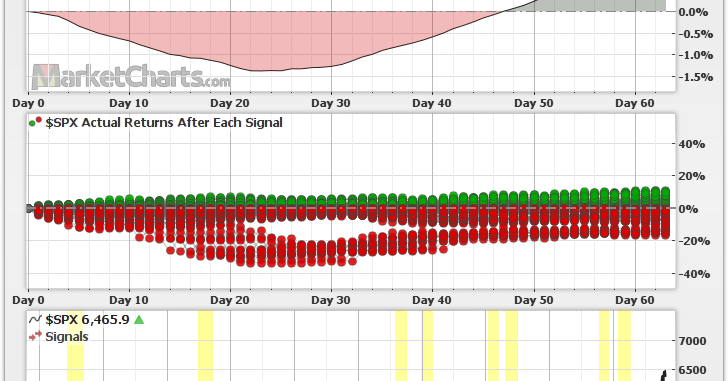
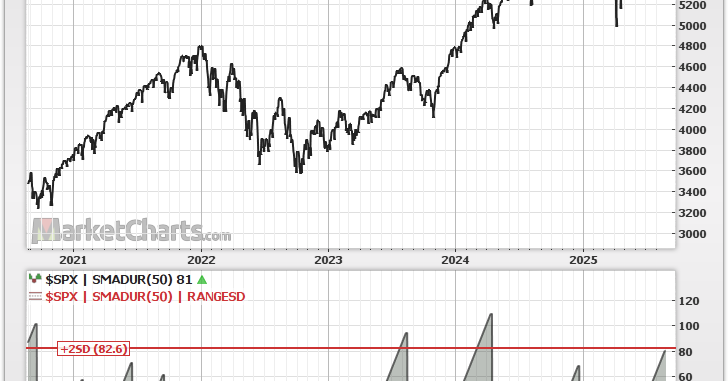
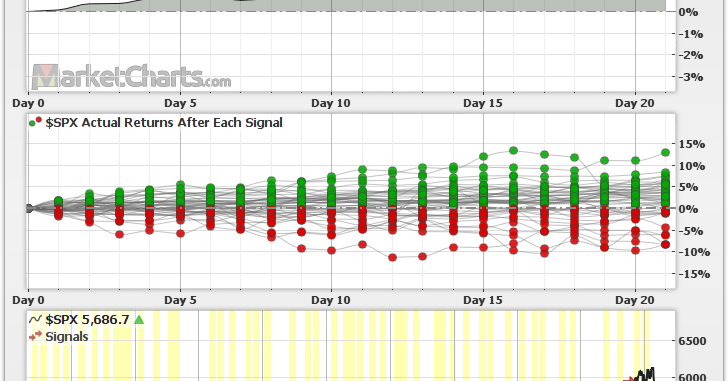
The $SPX has been trading above its 50-day simple moving average for 81 days. For the past 20 years, prolonged periods above the 50-day SMA have led to a month of negative average returns, followed by notably improving returns. Backtest in comments 👇.
marketcharts.com
MarketCharts.com
2
1
7

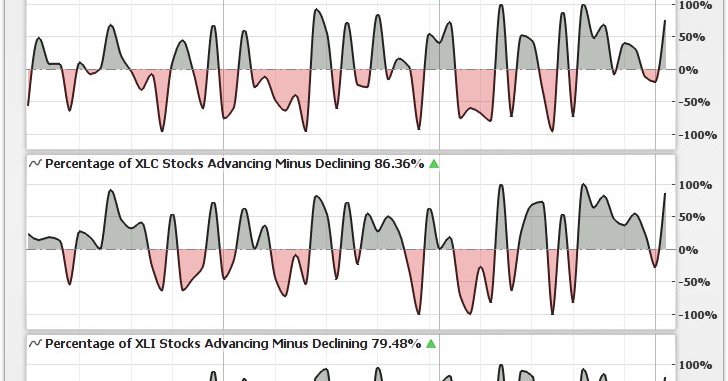
Bullish breadth expansion under way, and many more great insights 👇. Thanks @Callum_Thomas!.

ICYMI: Weekly S&P500 ChartStorm blog post Thanks + follow reco to chart sources.@topdowncharts .@MarketCharts .@SethCL.@TheDonInvesting.@neilksethi.@dailychartbook .@DeanChristians.
1
0
3
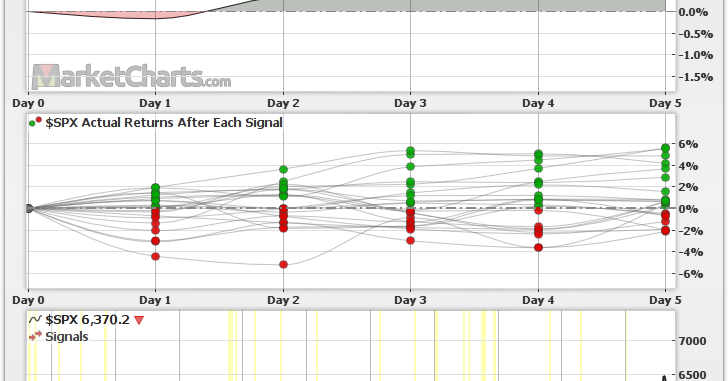
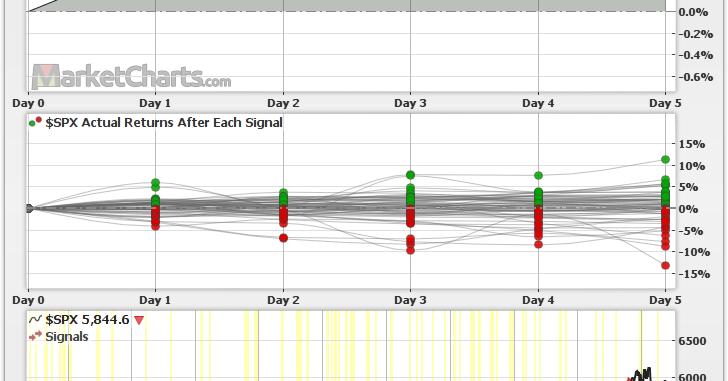
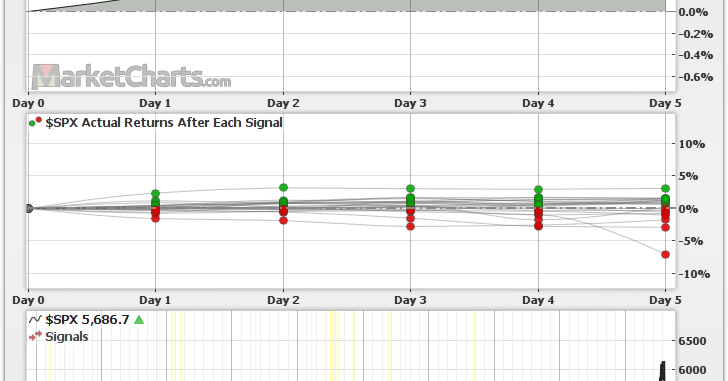
The $SPX is down 5 days in a row. Based on the past 10 years, the index was higher 95% of the time during the following 5 days. The average return at the end of the 5 days was over 1%. $SPY #StockMarket .
marketcharts.com
MarketCharts.com
0
0
3
$SPX golden cross in progress. .
ICYMI: Weekly S&P500 ChartStorm blog post Thanks + follow reco to chart sources.@topdowncharts .@MarketCharts .@DualityResearch.@SubuTrade.@BBGIntelligence.@NautilusCap.@AugurInfinity .@MichaelMOTTCM.
0
0
3
The 10-year backtest shows slightly positive average returns during the 5 days following the $SPX closing at an all-time high. $SPY.
marketcharts.com
MarketCharts.com
1
1
8
RT @Callum_Thomas: ICYMI: Weekly S&P500 ChartStorm blog post Thanks + follow reco to chart sources.@topdowncharts….
chartstorm.info
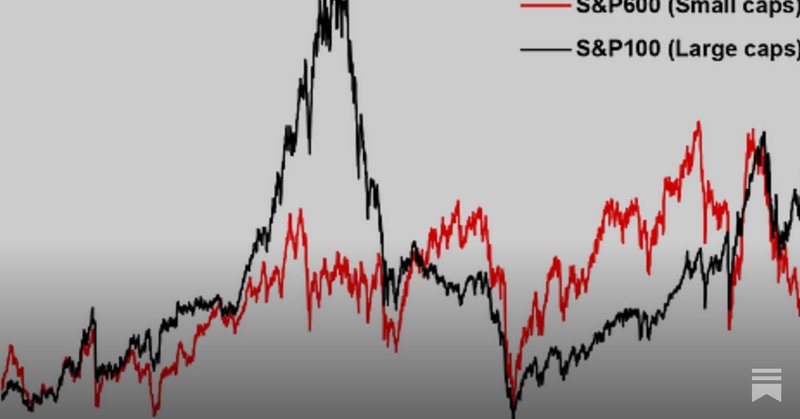
This week: technical check, 3rd year bulls, Mag 7 flows and earnings, Small Caps valuation and positioning, Europe vs US, big winners, market cap shifts...
0
9
0
Healthy pullback or lower high. ?.
ICYMI: Weekly S&P500 ChartStorm blog post Thanks + follow reco to chart sources.@topdowncharts .@MarketCharts .@SubuTrade .@MichaelKantro.@MarketWatch .@sentimentrader.@MikeZaccardi.@LizAnnSonders.
1
0
4
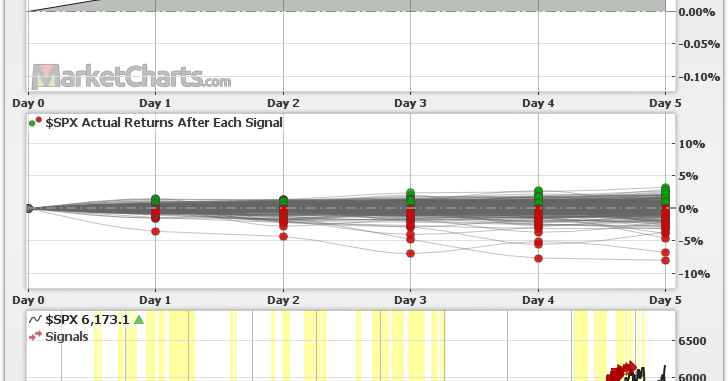
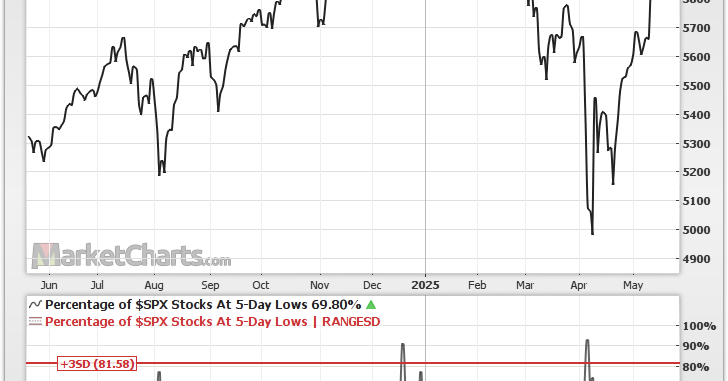
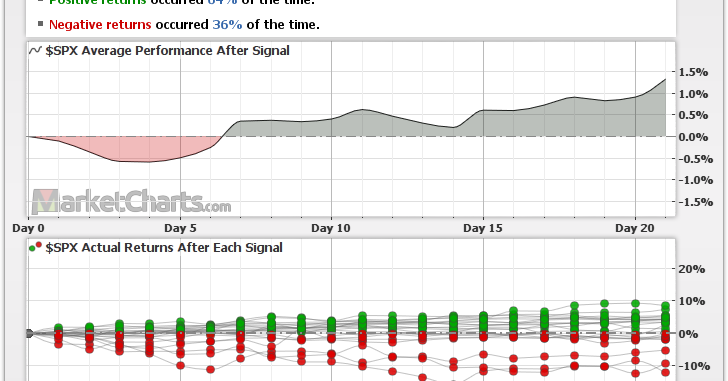
The percentage of $SPX stocks at 5-day lows just hit 70%, well above its average value of 25%. The 10-year backtest shows positive average returns during the following 5 days. The index was higher 88% of the time during those days. $SPY $VOO $XSP.
marketcharts.com
MarketCharts.com
2
0
3
The $VIX crossed below 20 today, for the first time in 30 trading days (6 weeks). The 10-year backtest shows positive average returns for the $SPX over the 3 months following the $VIX crossing below 20.
marketcharts.com
MarketCharts.com
0
0
9
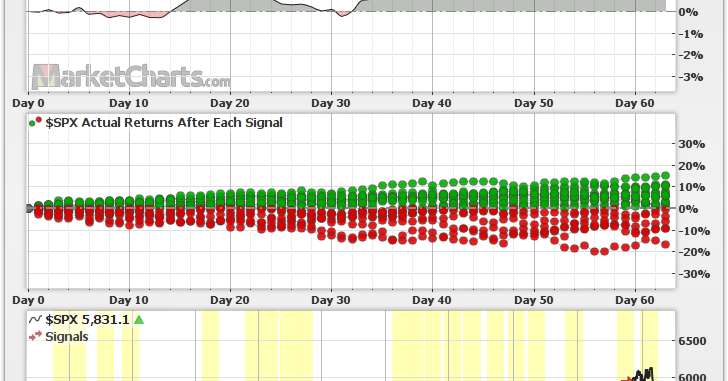
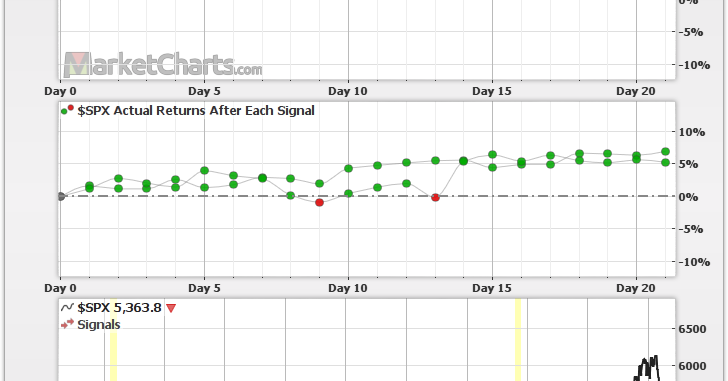
For the first time in over 2 months, the $SPX is now higher than it was a month ago. History shows positive average returns over the following month, whenever the index crosses back above its level a month ago. $SPY.
marketcharts.com
MarketCharts.com
0
0
1
The $SPX is up for 9 days in a row, which hasn't happened in over 20 years. Since 1957, this happened only 24 times. The 68-year backtest shows positive average returns during the following 5 days.
marketcharts.com
MarketCharts.com
0
0
1
The $SPX closed above its downwards trending 50-day moving average for the first time in over 2 months today. Over the past 10 years, whenever the index crossed above a downwards trending 50-day MA, average returns were positive a month later.
marketcharts.com
MarketCharts.com
0
0
2
Promising technicals, but. Thanks, @Callum_Thomas.
ICYMI: Weekly S&P500 ChartStorm blog post Thanks + follow reco to chart sources.@topdowncharts .@MarketCharts .@AugurInfinity.@MenthorQpro.@MacroCharts .@dailychartbook .@WallStJesus.@unusual_whales.
0
0
1
Debating the Death Cross, and much more. Thank you, @Callum_Thomas!.
ICYMI: Weekly S&P500 ChartStorm blog post Thanks + follow reco to chart sources.@topdowncharts .@MarketCharts .@QuantifiablEdgs.@finchat_io.@zerohedge .@albertedwards99.@dailychartbook.@SoberLook.
0
0
2
The $SPX has seen negative monthly returns for 39 days straight. Interestingly, in 2016 and 2022, the market bottomed when monthly returns were negative for 40 days. Average returns a month later were 6.10%. Backtest in comments.
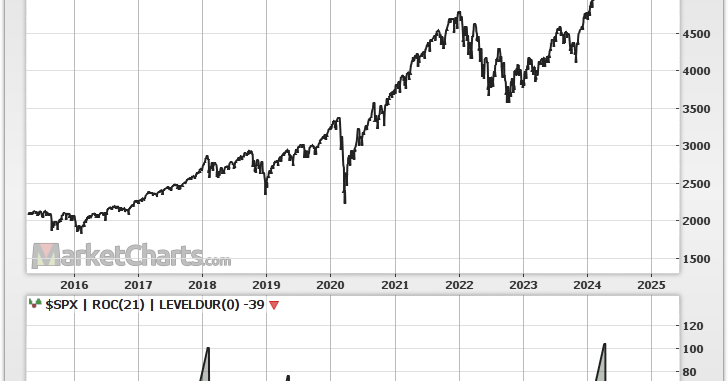
marketcharts.com
MarketCharts.com
2
2
6