

Andy West
@HedgeQuartersHQ
Followers
5,234
Following
373
Media
554
Statuses
2,366
Investor. Founder HEDGEQUARTERS & Longlead Capital Partners. Former Deputy Head at Regal Funds. PhD Economics (Finance). Personal views. Not financial advice.
Everywhere theres a market
Joined July 2009
Don't wanna be here?
Send us removal request.
Explore trending content on Musk Viewer
billie
• 262368 Tweets
Xavi
• 109160 Tweets
علي النبي
• 85839 Tweets
Laporta
• 42623 Tweets
デザフェス
• 35940 Tweets
#يوم_Iلجمعه
• 35120 Tweets
下半身露出
• 26757 Tweets
Scottie
• 22990 Tweets
OUROAD IN CHIANGMAI
• 20911 Tweets
#Aぇいきなりスペース
• 17864 Tweets
紫耀くん
• 16023 Tweets
イッシュ
• 14932 Tweets
تشافي
• 14923 Tweets
Flick
• 13173 Tweets
Isco
• 10874 Tweets
Louisville
• 10683 Tweets


The pivotal moment in
#Fed
press conference:
When (incorrectly) told the market had reacted positively, Jerome Powell seems frustrated and lists ONLY reasons why this is the wrong interpretation.
Very telling for
#stocks
.
$QQQ $SPY
#macro
#inflation
744
1K
6K
Have
#Fed
rate hikes led to the slowdown in
#inflation
we've seen so far?
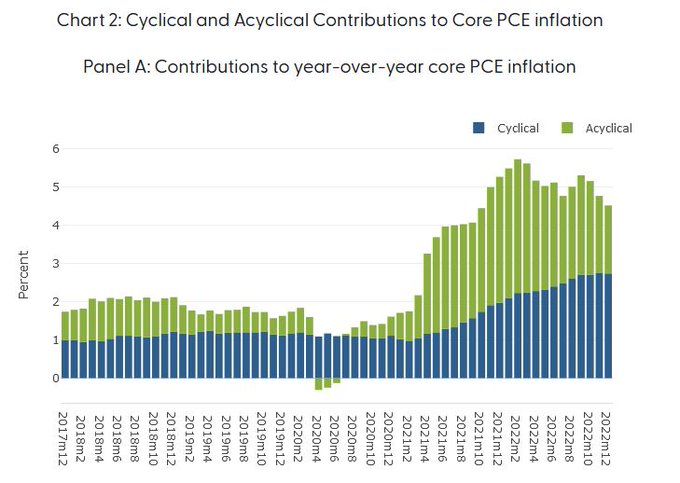
That's the conventional wisdom anyway. BUT, the San Francisco Fed's own index actually says "NO"!
Why & implications. A thread...
#macro
#Stocks
#SPX
$QQQ
1/8
11
66
229
My best advice to new
#investors
is to first understand that
#stocks
are not businesses. They are an artificial expression of Hype, Hope & central bank Manipulation that occasionally catch a fundamental flu. Flu season is coming back soon.

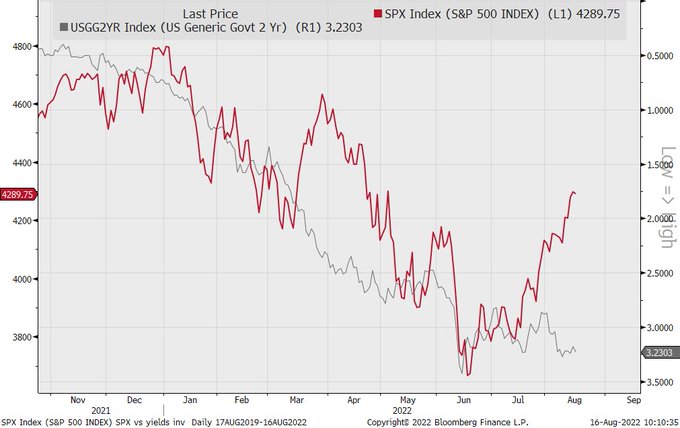
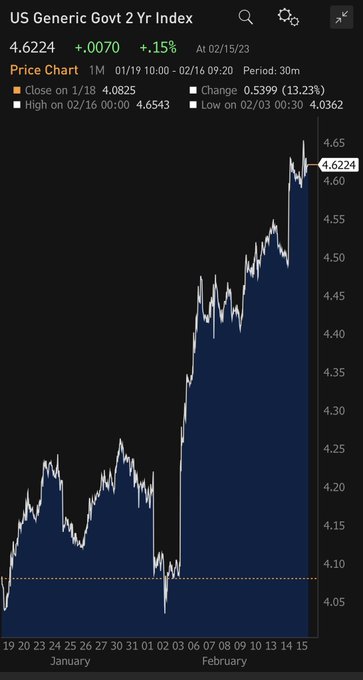
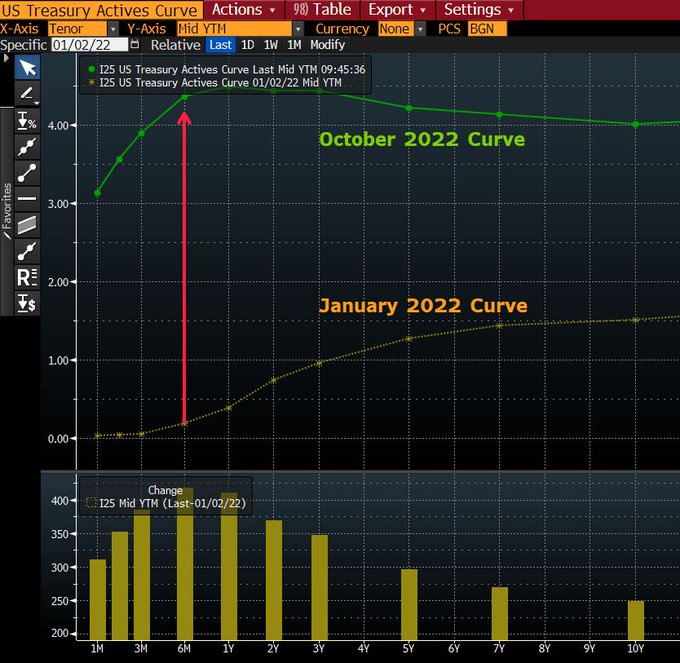
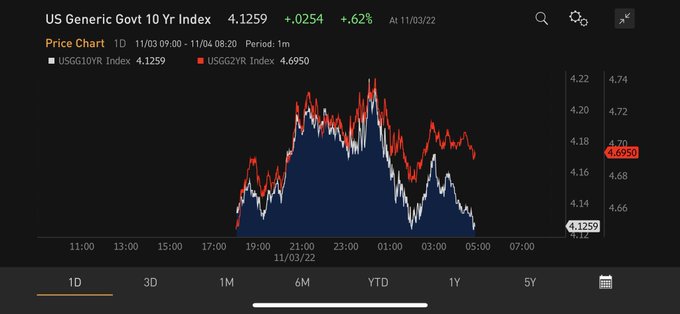
While equities have pivoted, 2 year yields have not. How does this gap close?
29
49
271
10
34
205
WHATS HAPPENING WITH US EMPLOYMENT / PAYROLLS and implications
a thread:
1/x
After a +517k Jan 23 payrolls & resilient employment mth after mth despite a year of rate hikes, whats really happening & does it mean soft landing?
read on
#macro
#unemployment
#stocks
$SPY $QQQ
11
48
229
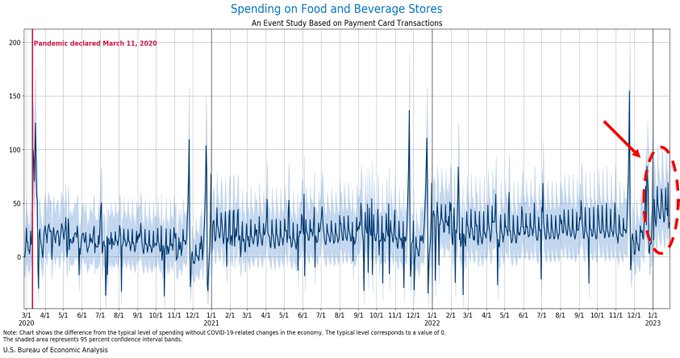
#Inflation
watch:
The stock market is pricing the disappearance of inflation & rates risk. But theres pretty good evidence that a bout of inflation is back:
CPI nowcast Jan +0.63% / Feb +0.49% mom. Charts are why - Food and Fuel.
#macro
#CPI
#stocks
$SPY $QQQ
15
37
205
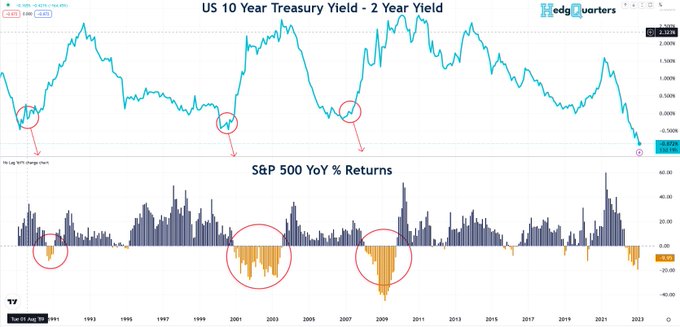
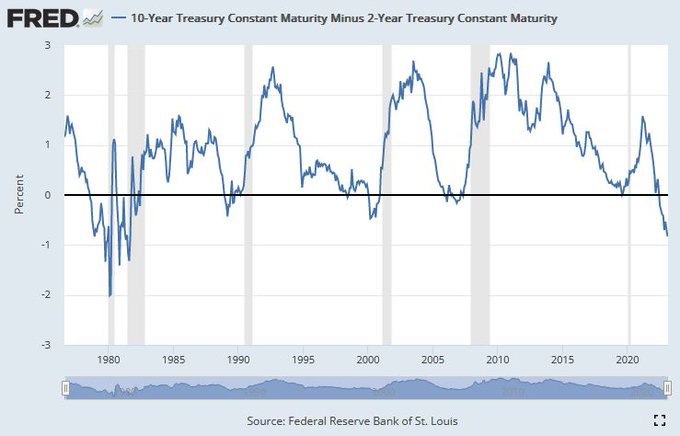
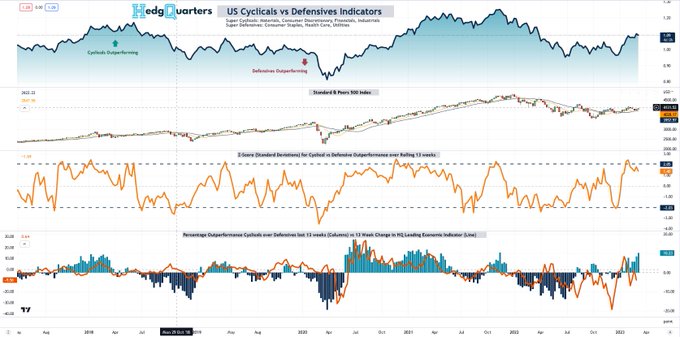
Lets be very clear about the potential risk to
#stocks
on a steepening yield curve such as we are experiencing now. This chart is worth studying closely...
The chart highlights 4 episodes where the yield curve underwent steepening over the last 35 years and what happened to
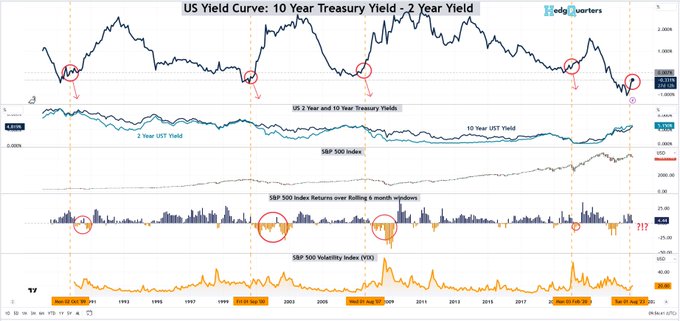
10
58
198
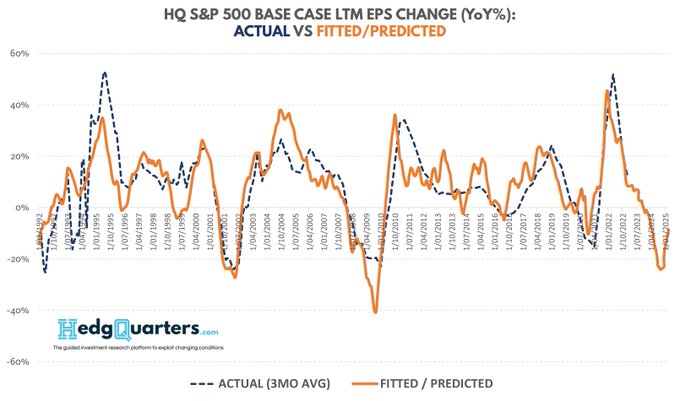
BREAKING: Goldman Sachs strategists slashed the 2023 EPS forecast for the S&P 500 to 0%, noting that the Q3 net margins contracted year-over-year for the first time since Covid
😂 If GS are at 0%, it’s guaranteed to be -15% or worse! (At HedgQuarters we’re modeling -22% for ‘23)
4
37
178
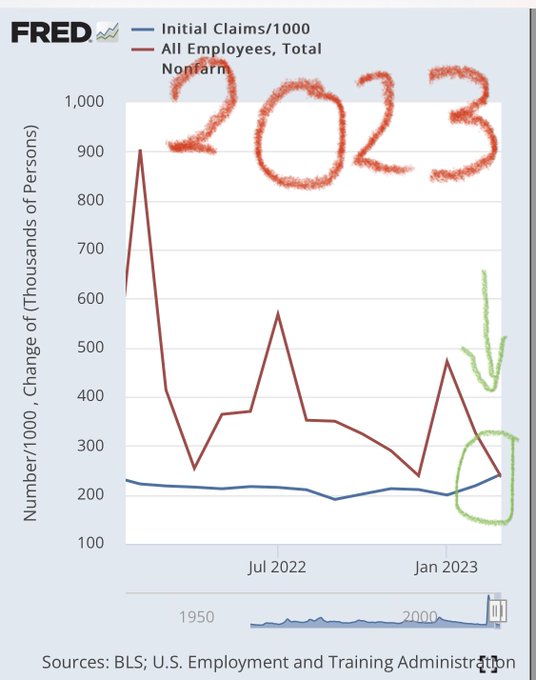
We’ve just arrived at the front door to the waiting room of “Recession House” on Main St, USA
Why say this with NFP at 236k? History & trend.
The typical preconditions for recession are:
Initial claims > 300k, rising
Payrolls < Claims for 6+ mths
Recession follows…charts
8
23
115
The last time the US 10 yr yield was at 3.5% was 2010. The Fwd P/E ratio of the
#SPX
was ~13x.
We’re still at ~17x. And the “E” will fall as well…
$SPY
7
18
92
To all the people who keep saying “everyone is bearish and short, so the market can’t go down” - just remember that when everyone is bullish and long the market kept going up.
$SPY $QQQ
#SPX
13
4
86
A little history lesson that is very apt for understanding markets today. Short 🧵
Blackstone said this week at a conference that their deal to buy Crown Resorts a yr ago could not happen today as the finance is not available. This is a red flag…
$SPY $QQQ
#stocks
2
14
87
Could Friday's
#Payrolls
report be a negatively biased news event?
One possible payout profile I'm considering (purely personal views, consensus is 170k):
- Payrolls > 170k:
#GOTHilocks
. Yields rise, more steepening. Bonds down, stocks down.
- Payrolls 130k - 170k:
15
9
85
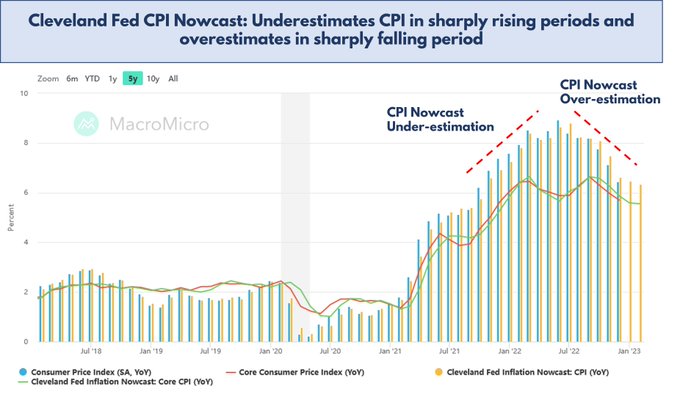
INTERPRETING THE CPI NOWCAST & how it works - a 🧵:
I, like many, have seen the rise in the CPI Nowcast over the last month & used it as a basis for expectations for Tuesday's
#CPI
release.
But how accurate is it at times like these. See chart:
#macro
#inflation
$SPY $QQQ
#SPX
6
23
82
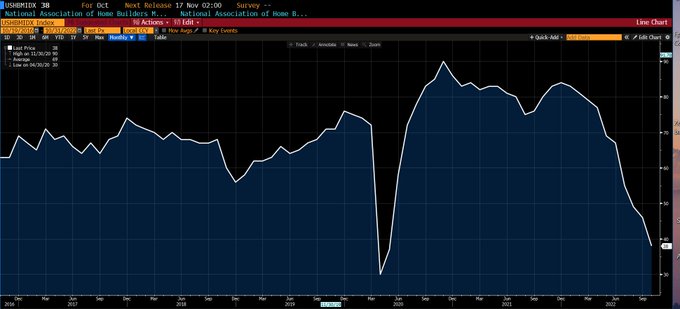
US Housing signals: The 6-mo drop in the NAHB Housing Market index is a 4 standard deviation event. This should happen once every 83 years. Let that sink in as a signal for housing &
#stocks
We've had 2 such events in 3 yrs but unlike 20, this ones not going to be saved by ZIRP.
9
23
81
Is the labor market really as strong as we think?
Perhaps not on this evidence...
The surprise of Summer was a multi month fall in initial and continuing unemployment claims after they had been rising since Q4 2022. This was a key plank of the
#softlanding
narrative as in past
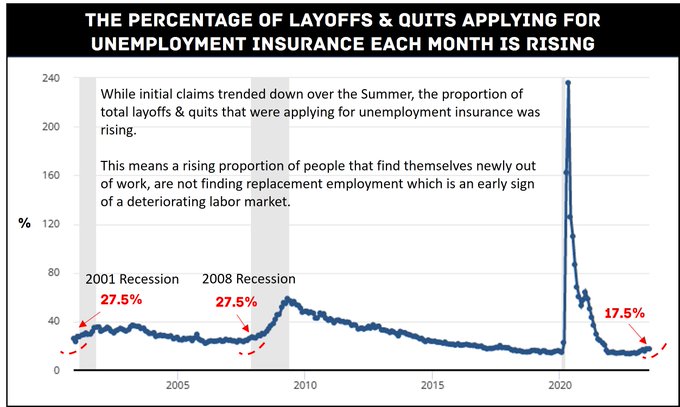
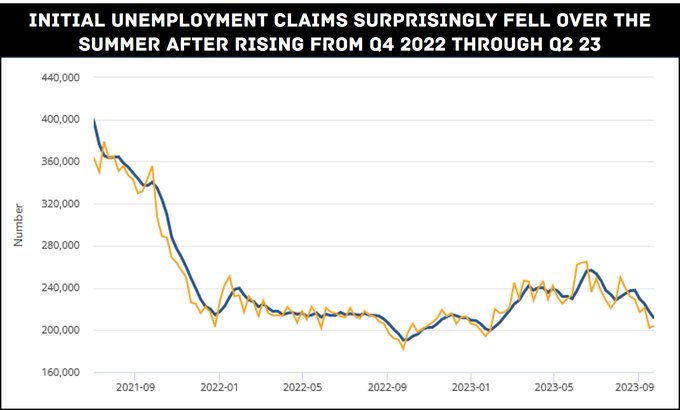
5
20
79
For those who think they have no exposure to the $SIVB, $SBNY etc issue & backed a moral hazzard depositor haircut - just consider this for a moment...
$IBKR - well managed broker. But see below where their client cash is partially held (from their website), then see the HTM
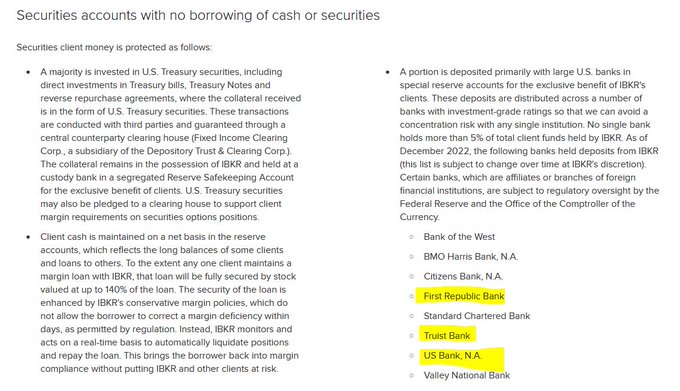
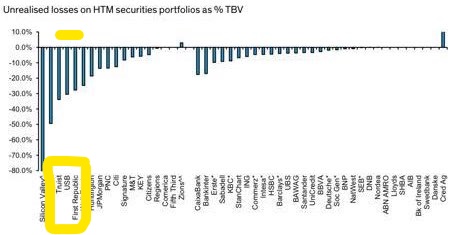
8
7
70

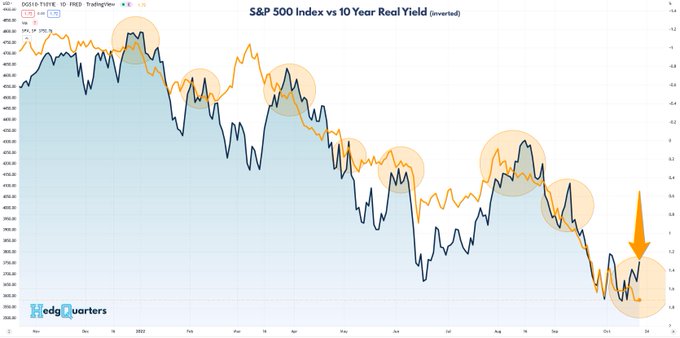
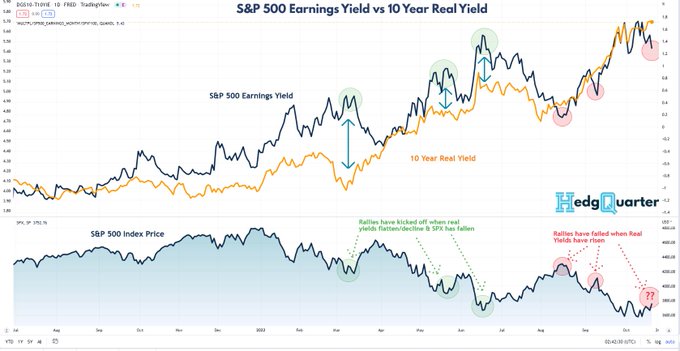
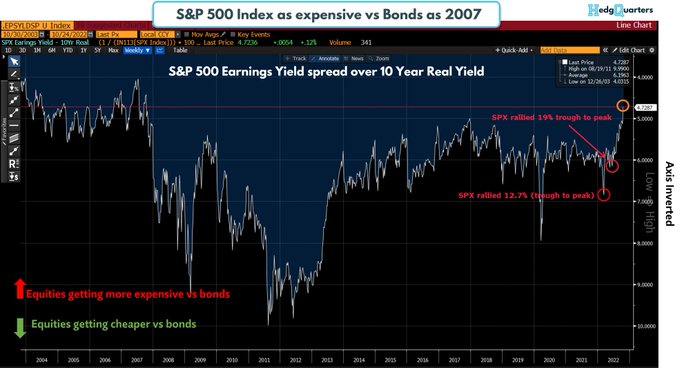
Another way to see this is to compare the
#SPX
Earnings Yield vs the 10 Yr Real Yield.
The conclusions are the same but the signals are often clearer. When real yields fall, the SPX can rally (lower earnings yield), when real yields rise, SPX rallies fail (red circles)
$SPY $QQQ
0
7
63
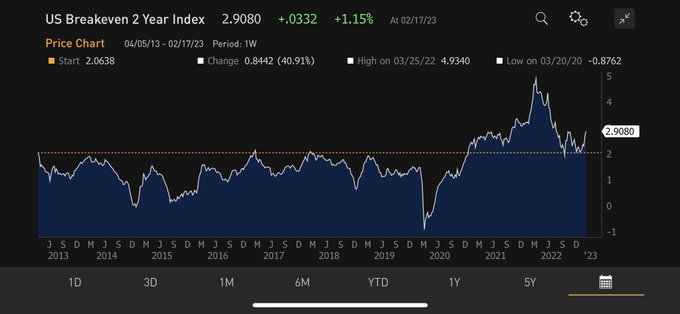
2% used to be the CEILING for
#inflation
expectations
Now it’s the FLOOR
We are in a very different environment to most of the last decade so why do brokers continue to use
#stocks
5-10yr avg P/E as a basis for price targets?
Hint: it’s irrelevant
$SPY $QQQ
4
13
61
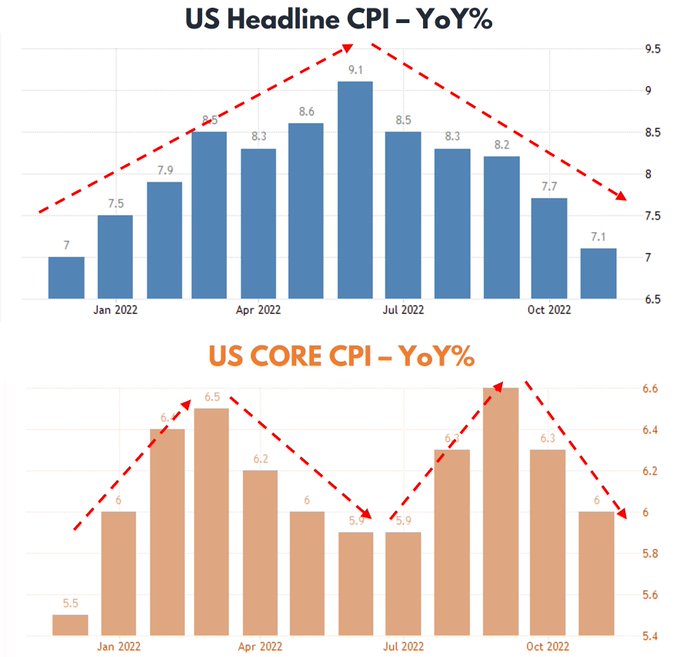
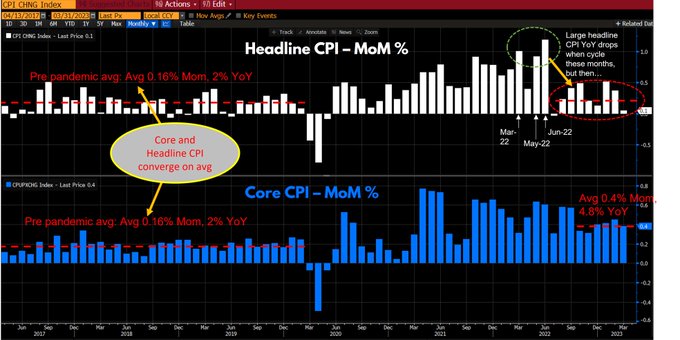
The
#inflation
eclipse, with headline falling below Core has turned some people dovish. The trouble is that looking at YoY CPI measures is seeing the most lagged version of a lagged indicator.
These charts show where the trouble lies for the
#Fed
:
1/
#macro
#stocks
$SPY $QQQ
12
22
63
@scienceisstrat1
@paulg
@ElbridgeColby
@Noahpinion
@erikbryn
The trouble with this is that you can’t replicate the localized 2ndry supply chains elsewhere without a long runway & sig cost inflation. $AAPL assembly plants in China are surrounded by suuportive infra of related components. So APPLs most valuable prods are manufactured there
6
5
58
Home Builder
#Stocks
:
Material divergence between $XHB (and its constituent stocks) and an index of STARTS - COMPLETIONS which is running negative and will get more so.
The rebound YTD was built on anecdotes from Builders in recent reporting that traffic & sales had improved

7
12
58
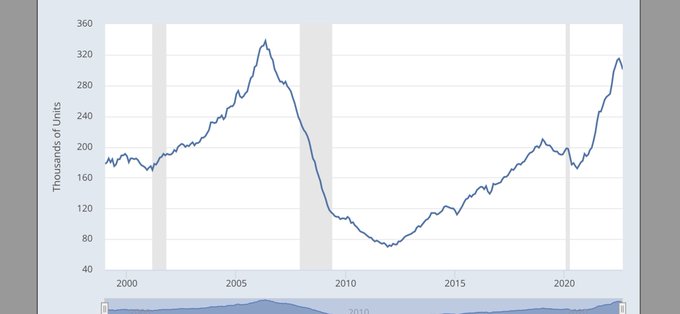
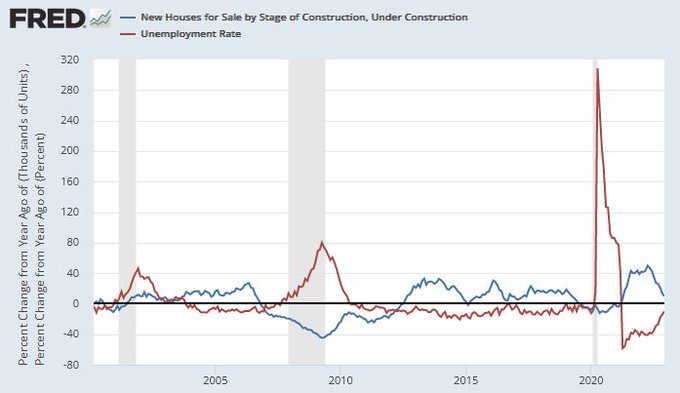
@MacroAlf
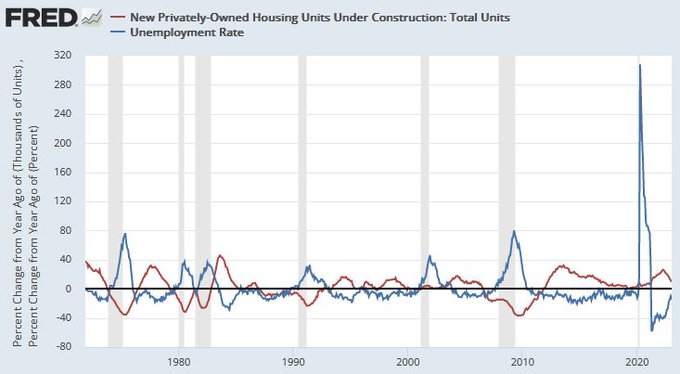
This is the best timing indicator for unemployment/ NFP contraction I have found: Watch the “homes under construction “ data. When backlogs are worked through, unemployment starts to rise. We are not far off…
0
9
56
4.4% by year end = new lows ahead. Never been a time since ‘08 that I’ve been more comfortable being net short. So comfortable I don’t even have a long.
$SPY $QQQ
6
4
51
"Jackson's HOLE" - ranking as one of the most costly 8 minutes due to one man in history- a 🧵
Chair Powell started by saying "Today, my remarks will be shorter, my focus narrower, and my message more direct."
- in other words, "you better listen carefully"
$QQQ $SPY
#stocks
3
13
55
HEDGE FUND ACADEMY Playbook
#1
A framework to forecast stock prices everyone can use - a 🧵
“HF PMs, whose clients expect consistent monthly profits with low drawdowns, use variations of this framework to identify, asses & actively manage ideas”
#investing
#stocks
$AMZN
#SPX
3
15
52
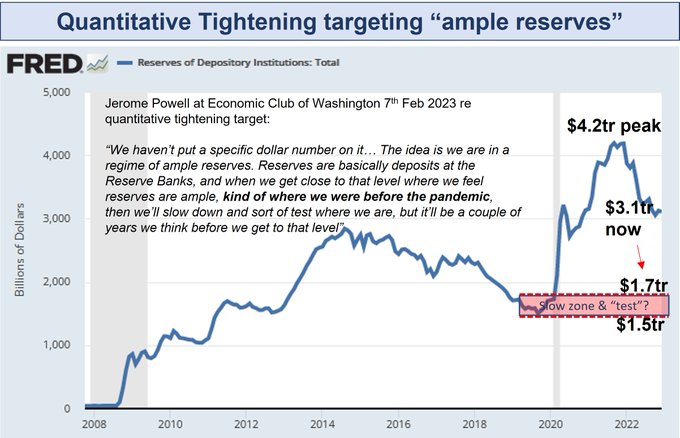
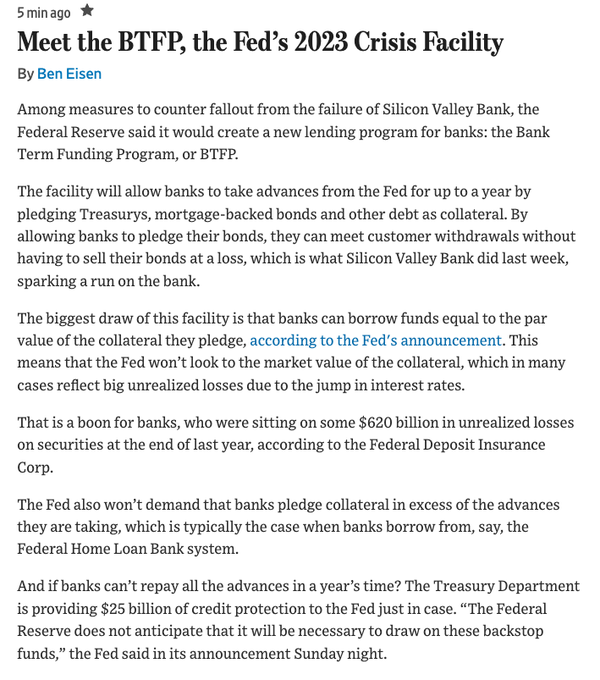
Is it just me or does this seem remarkably like
#QE
!?! You give us your treasuries at an inflated, non market price, and we'll give you the cash equivalent as if Fed Funds were back at 0.1%!
Not complaining, but market prices really are just for the plebs aren't they!!!
Gives a

Here's an explainer on the term facility that the Fed just rolled out
40
78
219
6
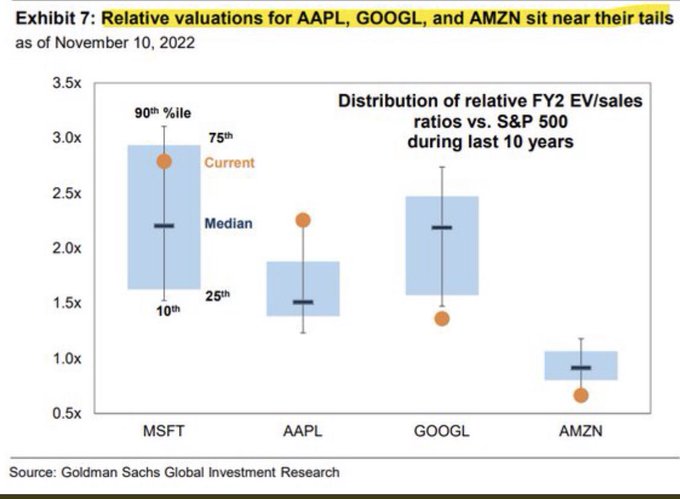
10
54
$GOOGL: I honestly don't even know where to start in breaking down this disaster of a quarter from $GOOG (and no, I'm NOT short, except by way of sector ETF).
Read the usual bulge bracket broker reports and you'd think this is ok. Its NOT and here's why
a 🧵:
$QQQ $SPY
3
4
49
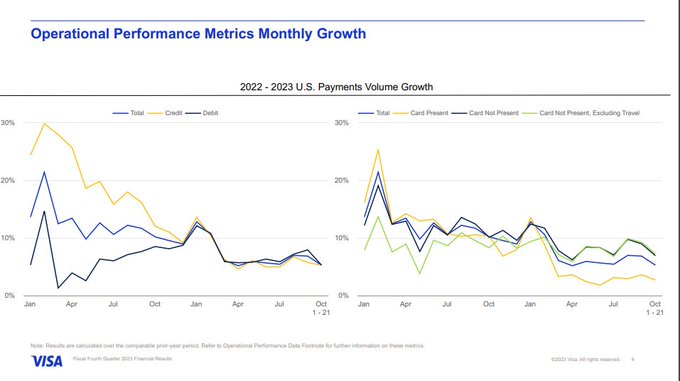
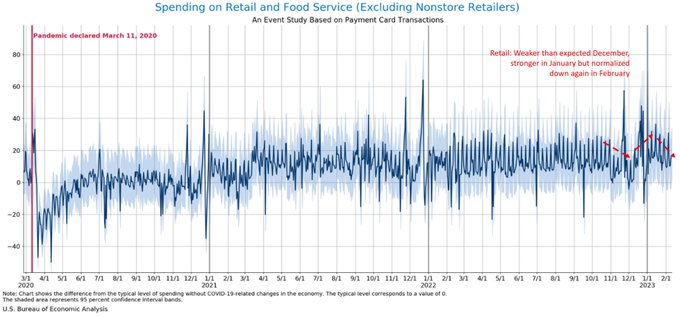
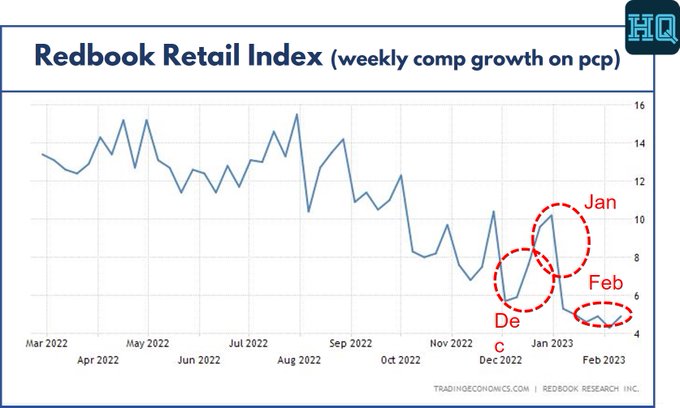
Chart on left has important message - Debit card (savings) mix shift due to high CC rates, has meant credit card stats were less reliable for tracking retail sales recently.
But the convergence in Oct between Debit and CC payments volume growth means we can likely start to place

Best Economy Ever!
Visa just reported. US card volume growth declined to its post-March trend after a brief bump in August. After accounting for secular cash-to-card conversion and impact of push payments, nominal US consumer spending growth is in the 0-2% range
15
40
360
1
4
53
HEDGE FUND UNIVERSITY coming:
1/ I've wanted to do this for a while for
#investors
. After 20 years of
#investing
in
#stocks
and derivatives, incl running my own hedge fund for ~ a decade, over the next month I'll be sharing a series of threads profiling:
$SPY $QQQ
#SPX
#macro
3
10
50
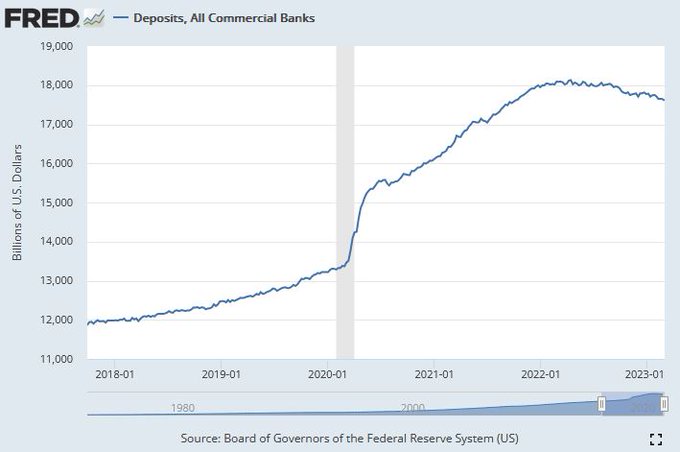
I'm setting a reminder for THIS data release! Its not till Mar 24 that we get the bank deposits number updated to Mar 15th
That should show a picture of what happened to bank deposits as the $SIVB closure news hit. The 50bps 6mth yield drop hints at it.
#macro
2
6
46
What’s the total equity capital of all US banks?
$2.2 tr
With Banks sitting on unrealized losses of $620bn, that’s ~30% of the entire industry’s equity that doesn’t actually exist today if the funds are required before interest rates get cut again
= Cap raises
#macro
$SVB
2
9
49
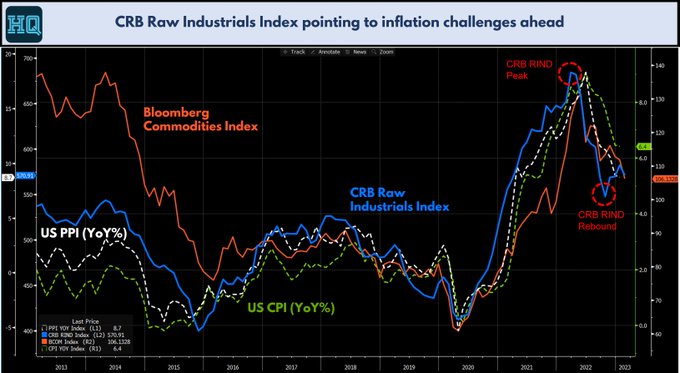
#INFLATION
WATCH 🧵
1/ Inflation drivers differ btw cycles & this pandemic driven cycle is unique in our lifetimes. So what gives us the best leading read on
#CPI
?
Many watch oil as thats historically a big driver, but this time evidence suggests an alternative
#macro
#stocks
1
14
49
@MichaelKantro
So true. Housing has already rolled (prices, activity, NAHB), Orders rolled (S&P PMIs), Profits are rolling now based on EPS forecasts and employment is the last domino to fall with less educated cohort unemployment already rising in the stats.
1
2
44
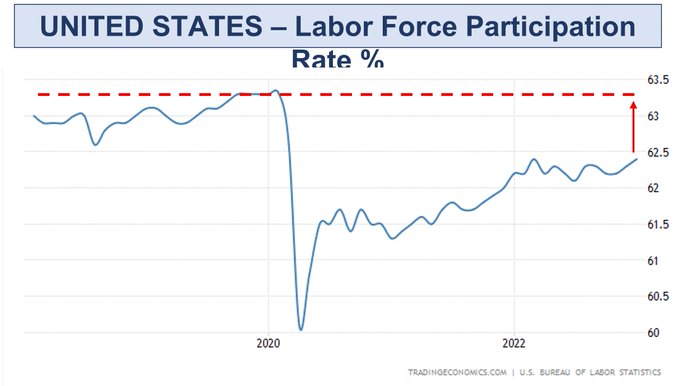
17/17 As a P.S., if you're wondering where all this labor can come from with unemployment at decade lows, it has to be from the participation rate normalizing upwards.
Pre COVID it was 63.3%, before the GFC 66%. Today 62.4%.
As savings disappear, people come out of retirement.
2
4
48
@TaviCosta
Interesting comparison but what if this simply reflects unsustainably low capex in energy that is insufficient to replace let alone grow production? Ie the Energy FCF is temporary
5
2
46
#YouveBeenWarrened
Senator Warren went full
#JudgeJudy
on Chairman Powell in today's testimony.
Even been in one of those arguments where its pretty clear the person doesn't care what you say - they just want to bash away?!?
#macro
#Fed
#inflation
#stocks
15
3
44
Blackstone’s message is a re-run of ‘07. With higher rates banks are tightening standards & with QT liquidity is drying up. The PE & M&A mkts are dead. Term sheets are cut if you can get one at all.
This means equity prices are coming down further. We’re heading no bid again.
3
5
41
16/x
DON't be surprised if the term "soft-landing" remains around for a while before the rug being pulled in Q3 or Q4 this year.
If this is useful insight, consider pre-registering for the platform launch this year.
Macro to micro connecting the dots
1
4
44
Interesting chart from Blackrock where they have used about 20 economic models to synthesize the GDP impact of rate hikes to 5%
See peak impact in Q3 this year:
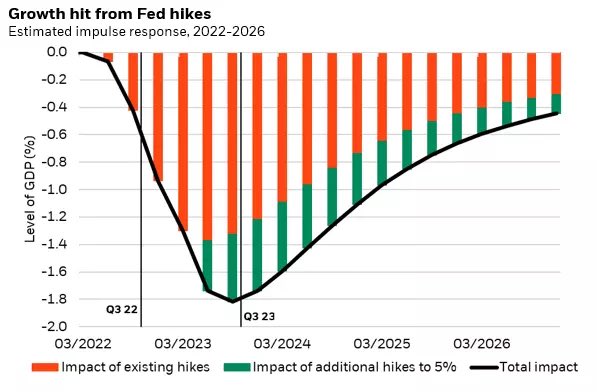
1
15
42
Core CPI (YoY%) is likely to fall to 4.0% next month but that will be the last fall for some time absent a material slowdown into year end.
Why? after the Sep print where we cycle out a 0.6% MoM from the core CPI calc (with current run rate ~0.3% MoM) the next 3 prints to cycle
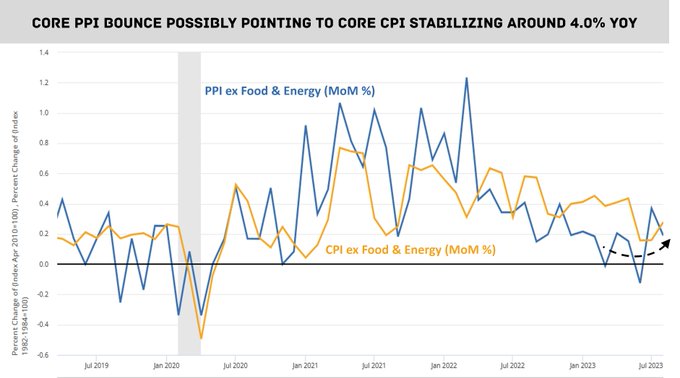
2
10
42
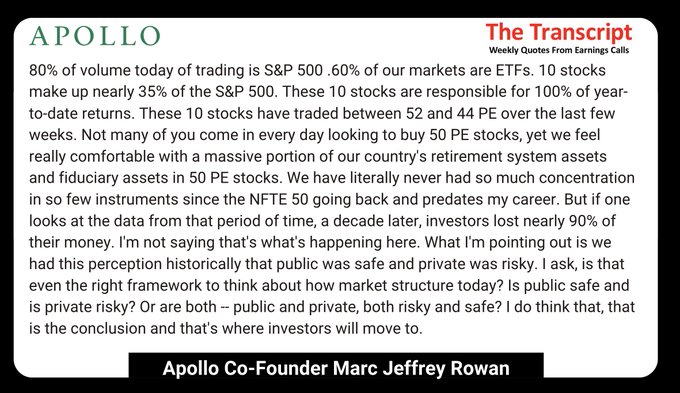
Man, that’s so well stated. Thats transcript of the year for me! Hats off Marc Jeffrey Rowan

$APO Co-founder: "80% of volume today of trading is S&P 500. 60% of our markets are ETFs. 10 stocks make up nearly 35% of the S&P 500. These 10 stocks are responsible for 100% of year-to-date returns"
2
14
63
2
5
38
@sentimentrader
Cue the CMTs with their “in the last X times this happened stocks were up Y% over the next yr” tweets
How bout the drawdowns in between? How bout looking whether the conditions in the last X times are in any way analogous to now?
3
0
36
If sequential MoM
#inflation
was allowed to continue at that 0.5% pace, from July the CPI would rise through the entire back half of the year
In other words the
#Fed
will be tempted to keep hiking at 25bps per month until MoM inflation is consistently below 0.25%
1
6
36
Cash bloated corp balance sheets
Consumers with record excess savings after pandemic
30 yr fixed mortgages taken at rate lows
Decade+ of QE
= Probability Policy transmission stuffed. Rates just keep going up till labor shortage expired & Econ breaks
This view will get louder
1
5
39
@DavidInglesTV
Question is - will we actually see this increase demand for credit? China consumer and business confidence is horrendous. There’s been no activity response yet. Very similar to 2008 US.
2
1
35
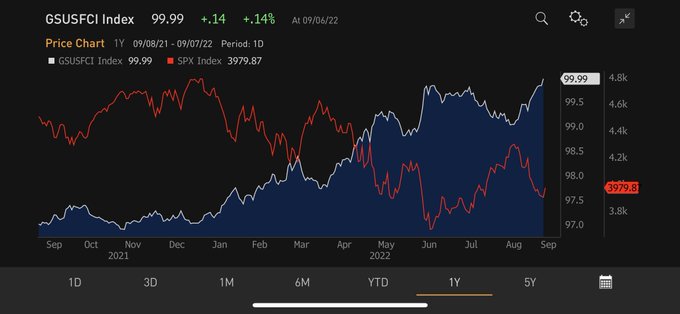
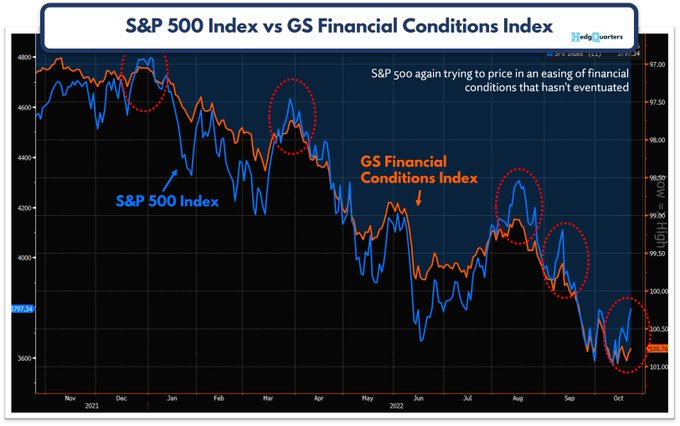
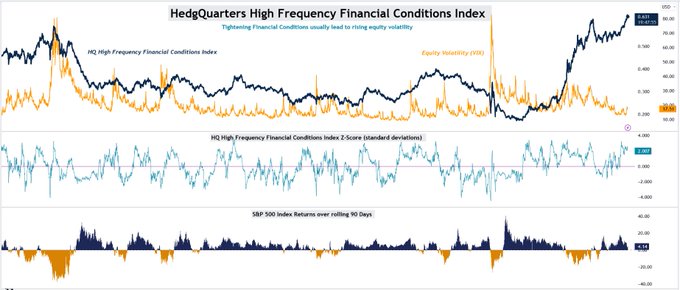
The recent movements in the US dollar, oil, short and long rates and spreads have resulted in a 2 standard deviation tightening of financial conditions. It is likely this will result in higher equity volatility over the next 2 quarters...
There is a well documented relationship
0
13
39
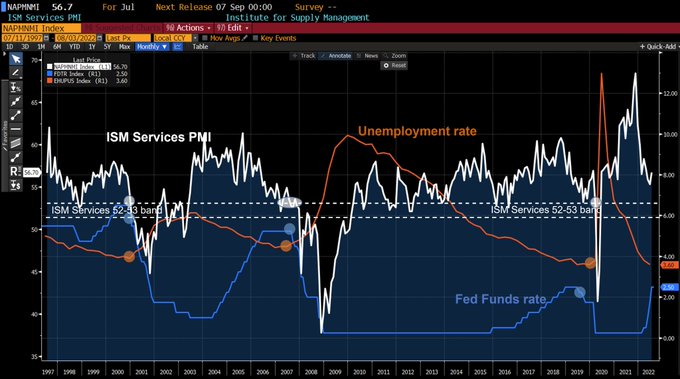
10/x Back to the US however and despite the rehiring trend post COVID still ongoing, we do still see evidence of the expected economic cycle playing out:
Contraction in the NAHB Home index, ISM manufacturing, ISM services and yield curve inversion
I always like this chart...
1
7
38
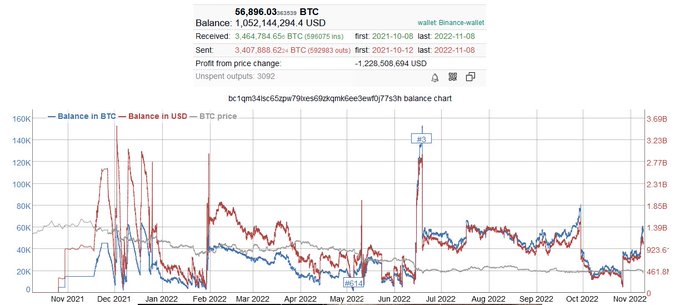
I'm no $BTC expert, but there appears to be evidence of price support from the big guys.
Here's a Binance wallet that buys BTC after price drops (blue line), then sells it out with this activity far more prevalent after June 22 as volatility in BTC mysteriously drops.
2
4
39
@DiMartinoBooth
Great chart. It shows how the yield curve inversion leads large scale equity downside as eventual recession hits. This is what I’ve explored below. It’s the Fed cuts you have to beware which makes this rally based on expectations of a near term pivot puzzling.
3
8
35
@BobEUnlimited
I agree -
I'm no $BTC expert, but there appears to be evidence of price support from the big guys.
Here's a Binance wallet that buys BTC after price drops (blue line), then sells it out with this activity far more prevalent after June 22 as volatility in BTC mysteriously drops.
2
4
39
1
2
38
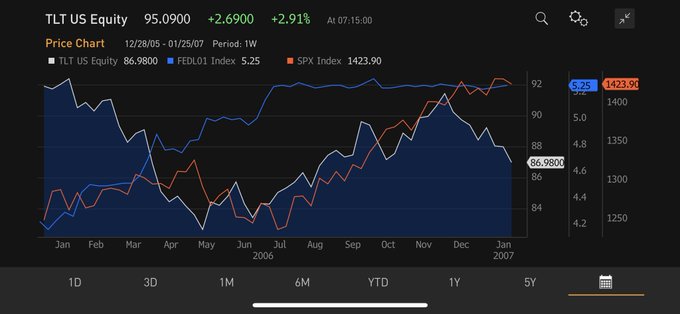
Shades of 2006?…the period of irrational exuberance where equities ignored deteriorating fundamentals.
Would a Fed pause do this again?
2
6
35
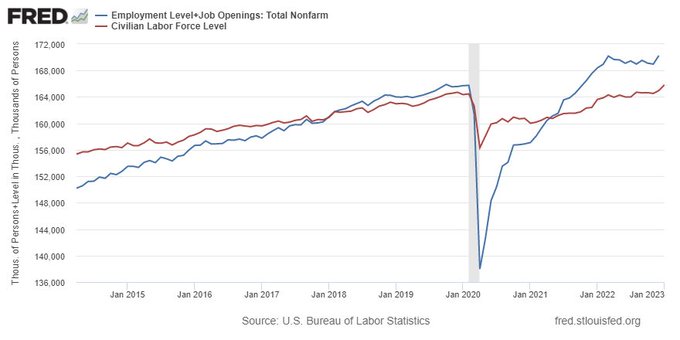
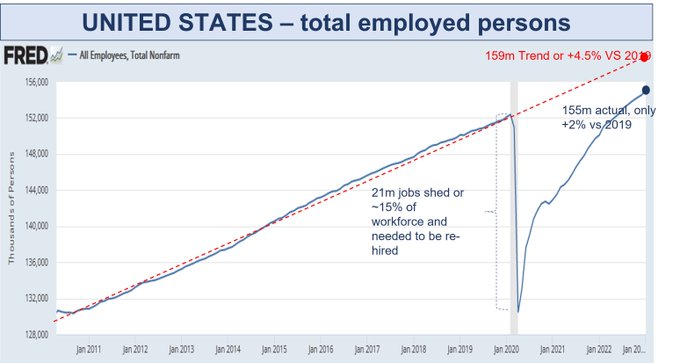
3/x Why were they elevated at the beginning of '22? Its all about the re-hiring of workers laid off during COVID. This is still on going.
The Chart shows US Total Employed. The US shed ~15% of its workforce as COVID hit and only recently surpassed 2019 levels, now +2% vs then.

1
1
37
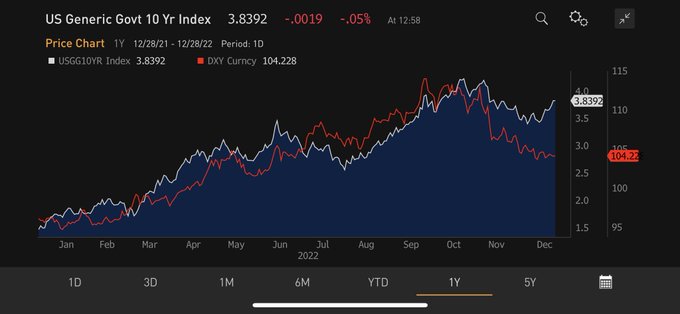
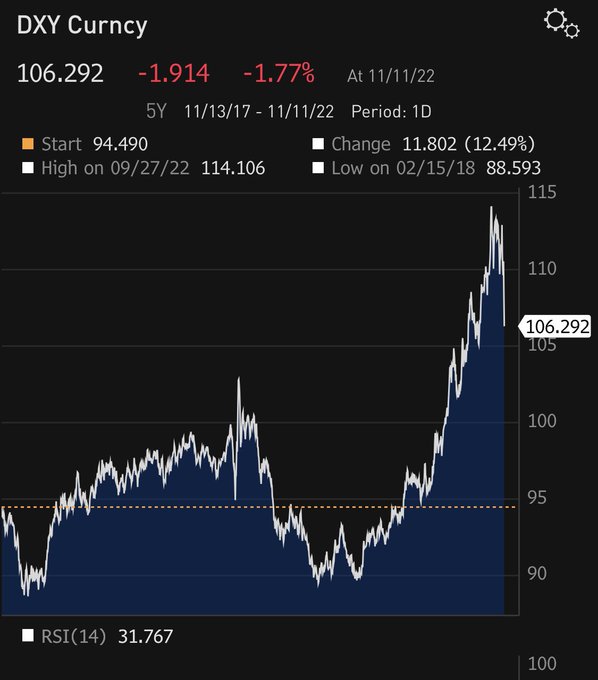
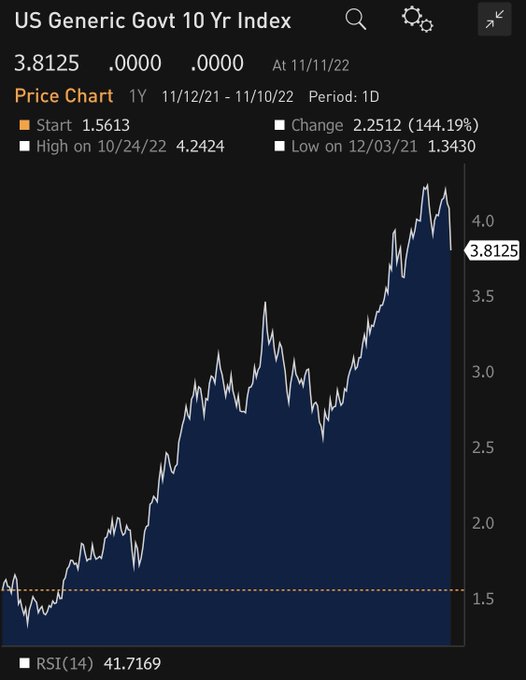
Hypothetical What-if to ruin the start of your 2023…
$DXY rips to 110?
Worth asking what happens to your portfolio if it does! The 10 year certainly thinks so.
$SPY $QQQ
#macro
3
3
33
Prediction: When
#Bonds
truly bottom, $AAPL will crater.
Why?
Big money needs somewhere to go before it sells its largest positions.
1
9
34
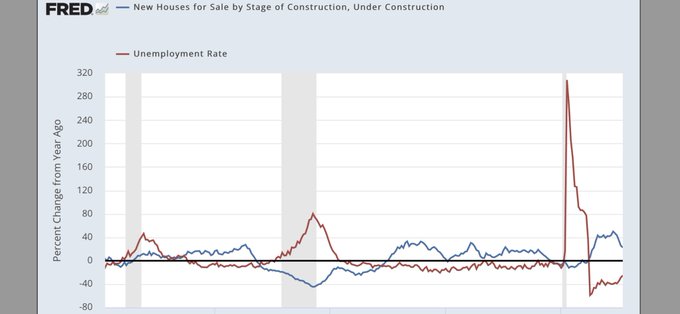
@EPBResearch
Great Thread. This chart tends to show the inverse relationship btw Units under construction and broad unemployment.
When the red line goes negative, we are within a few months typically of a rise in unemployment.
Not there yet but closer...
0
5
33
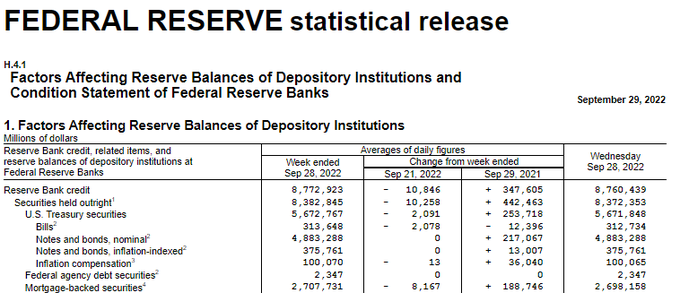
So here comes the real illiquidity crisis. Will gradually build as cumulative QT ramps then we'll get a break in some market that will require
#Fed
intervention just like the BoE did to save the pensions.

Sept 25th was settlement date for MBS. Fed balance sheet weekly update was released an hour ago. MBS down $8.16B on the week, Treasuries down $2.09B. Fed was telling the truth all along. 😜 Y'all ready for more? 'Cause it's coming, you just have to know where to look.
@Quillintel
12
60
256
2
6
32
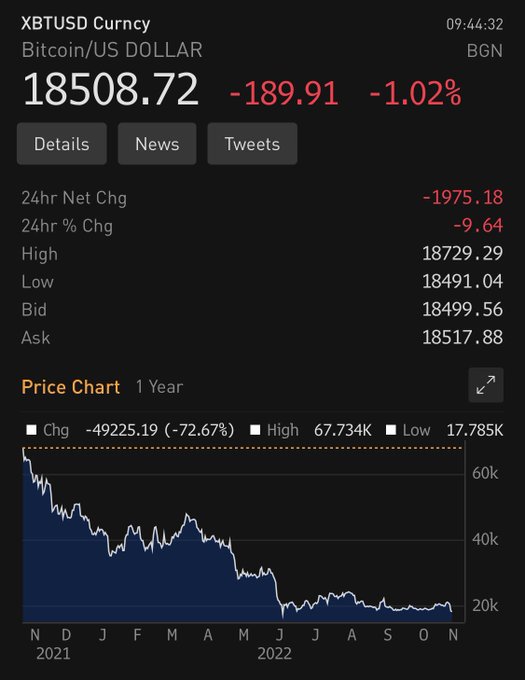
#Bitcoin
- has anyone considered that the artificially low volatility in $BTC since June (vol lower than stocks!) arose from crypto exchanges defending the price to avoid a further run on the whole crypto system?
With todays collapse that inventory may need to be liquidated!?!
5
3
33
The US Treasury 10Yr -2Yr yield spread just hit -58bps in the wake of the Hawkish
#Fed
press conference yesterday.
Bond market saying recession will be deeper.
Meanwhile equity volatility is having another day at the beach. 🏖🌊☀️
5
3
32
US hedge fund gross and net exposure trend c/o MS:
Both INCREASING so this “record bearish HF positioning narrative” from CFTC data is total, absolute rubbish
Index shorts are low cost leverage for longs particularly when positive returns are coming from a narrow segment of the

2
6
32
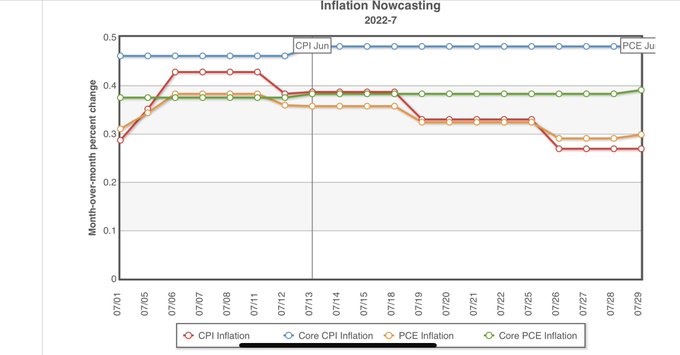
@carlquintanilla
@ClevelandFed
@fundstrat
That’s selective reporting. This is their chart for inflation NOWcasts across measures. All core inflation measures moving higher which as we know is what is focused on by Fed. The headline figure simple reflects a fall oil in July. Aug will
@move
higher again.
1
1
28
4/x Has re-hiring finished? NO and thats what is continually surprising the economists payrolls forecasts.
Trend can be looked at many ways. Simplistically, the past employment trend could put normal employment at 159m, +4m workers higher than now
1
3
31
I'm very concerned as the
#softlanding
narrative builds that a key dynamic is being overlooked. We know the resilient US consumer has been at the core of why there has been no
#recession
so far. But the resiliency of the consumer is facing a harder test each successive week due
2
4
31
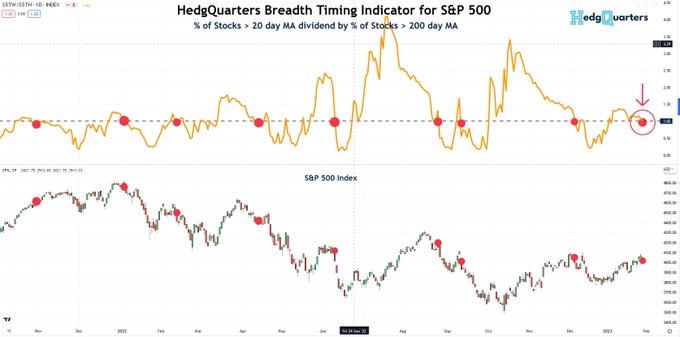
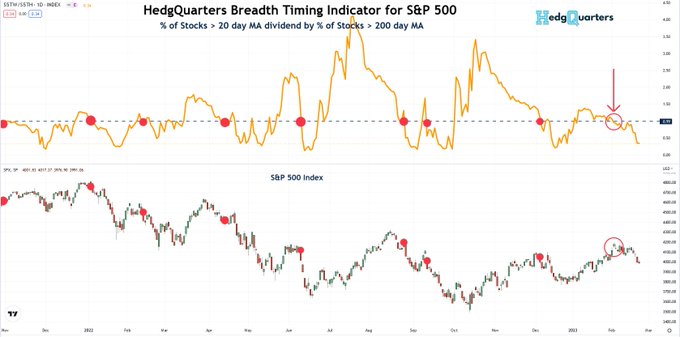
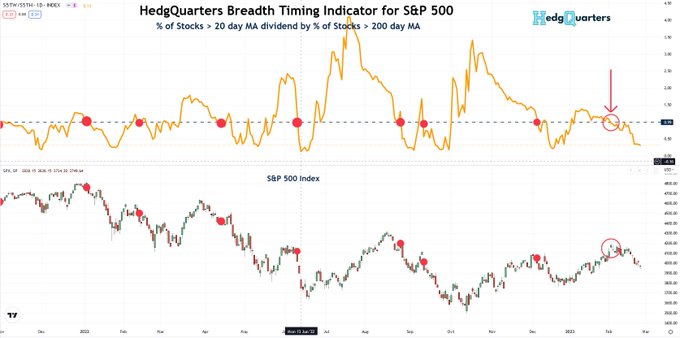
Breadth Update:
The breadth unwind continued with further falls in
#SPX
& $SPY over the last 2 days.
There is potentially more to this move based solely on past episodes in the chart, but also note that a ratio of 0.20 (0.34 now) has often signalled a near term trough
$QQQ
1
5
31
@PauloMacro
Your point is a good one. But what it ensures is bad. This will push the Fed to keep raising rates, possibly to 6% to get an overheated economy under control and rebalance Supply and Demand.
Because what you are implying is lower oil will boost Core PCE.
4
3
30
I love the fact that “pivot” has now been bastardized to mean more normal sized rate hikes by many.
People latch on to any narrative they can.
7
1
29
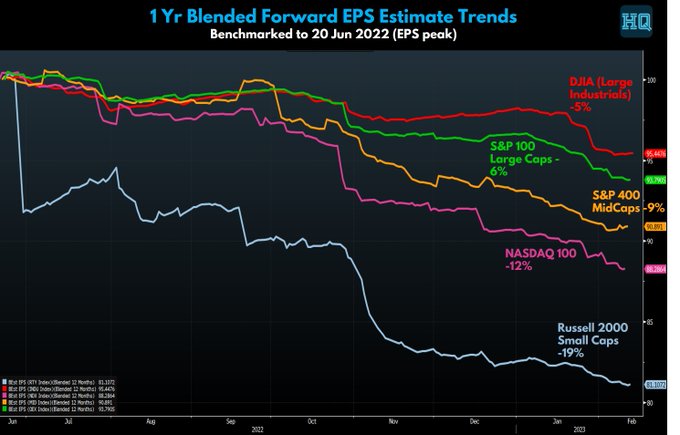
The hardest periods for equity investors are often when EPS rises but stock prices fall - like now.
Easy to dismiss as a blip but important NOT to. Framework to assess:
1. This says investors net selling - why, given EPS?
2. P/E multiples contracting by definition- what drives
3
4
31
$DXY and US 10 yr yield in free fall. That’s good right?
Actually it just gives the
#Fed
more room to hike rates without breaking something…yet.
Financial conditions MUST remain tight to fully normalize
#inflation
.
Don’t trust
#stocks
to beat the Fed.
0
5
30
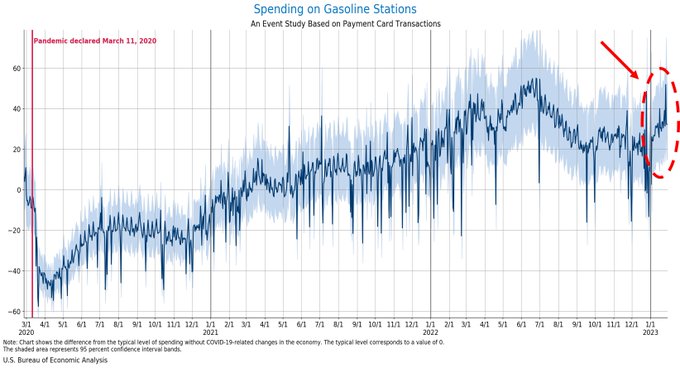
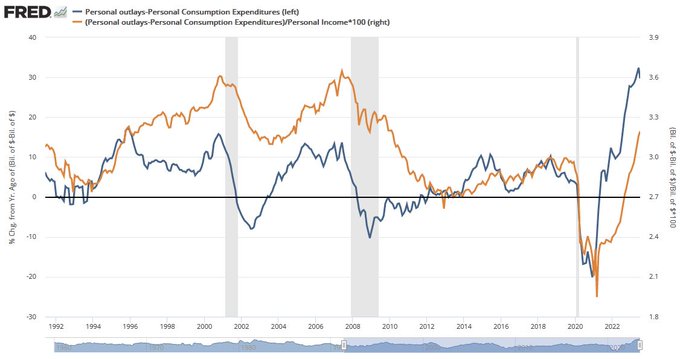
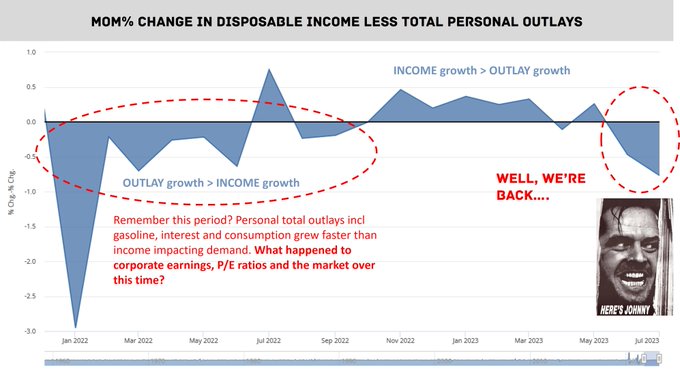
If you listen very carefully, that gurgling sound you hear is household savings once again being sucked down the drain due to the combination of residual
#inflation
,
#gasoline
prices climbing and
#interestRate
burdens still going up.
When we saw this in Jan-Oct 2022, consumption
2
6
29
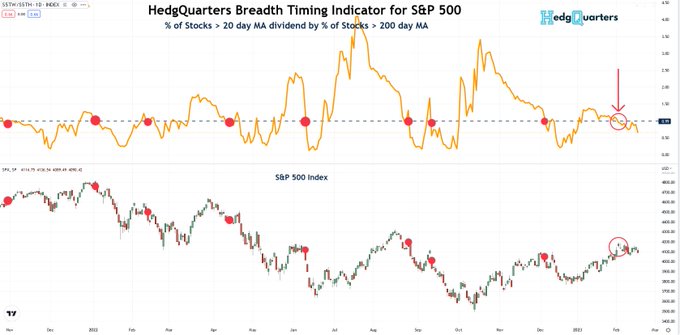
Breadth Update:
Data was HOT, HOT HOT! And so with rates fears at the forefront we saw breadth ratio break lower again. Current 0.31 (
#stocks
> 20DMA / 200DMA). Low but not extreme after such a January rally
Many prior lows around 0.20 or below.
$SPY $QQQ
1
10
30
@CathieDWood
What’s any of that got to do with the Phillips curve??? All you’ve said is lower prices stimulate demand. Pretty sure Charlie Munger knows that well.
3
0
25
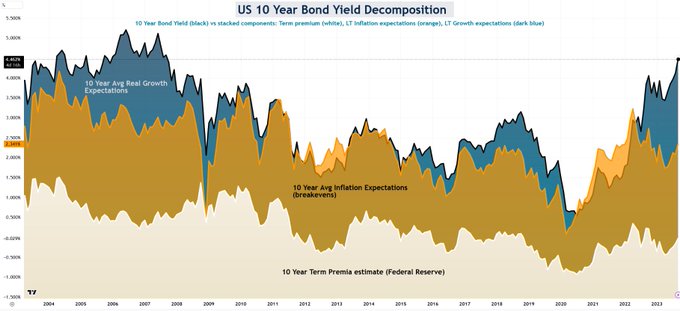
What is the current 10 Year Treasury Yield pricing? (using one type of methodology)
Real Growth: 2.12% avg over next 10 years which equals the highest priced growth since 2003
Inflation: 2.37% being 20bps to 100bps higher than the 2014-2019 period; In line with the avg between

1
7
29
If you accept the fact that the primary driver of equities falling over the last 3 months was rising long bond yields, then a dovish Fed pause, PMI drop and GDPnow cut to 1.2% put that factor back on the shelf.
Current earnings have been “fine”. Perhaps time for a bounce before
2
4
30