
Charlie Rafkin
@CharlieRafkin
Followers
892
Following
1,548
Media
16
Statuses
259
Economics PhD student @MIT
Boston, MA
Joined February 2013
Don't wanna be here?
Send us removal request.
Explore trending content on Musk Viewer
DeNiro
• 279715 Tweets
Begoña Gómez
• 170766 Tweets
Meyer Habib
• 161056 Tweets
Sura
• 112360 Tweets
Hollywood
• 105952 Tweets
Washed
• 64701 Tweets
Abascal
• 59783 Tweets
Diane Abbott
• 58739 Tweets
Julie
• 55723 Tweets
#خادم_الحرمين_الشريفين
• 45149 Tweets
$BOOST
• 44568 Tweets
Epstein
• 43446 Tweets
Barquisimeto
• 39517 Tweets
LOBA COM IFOOD
• 32775 Tweets
Derrota
• 30681 Tweets
Faker
• 30236 Tweets
Ahri
• 29661 Tweets
F-35
• 27314 Tweets
De Luca
• 25607 Tweets
#KohLanta
• 19738 Tweets
Fajna
• 17887 Tweets
Boulos
• 12169 Tweets
Dennis Quaid
• 11925 Tweets
Peñarol
• 11494 Tweets
MALA COSTUMBRE 6 MILLONES
• 10188 Tweets


Very happy to share that I will start as an assistant professor at
@ubcVSE
in Jan 2026, after postdoc visits at Berkeley and Stanford!
So grateful for my time at
@MITEcon
, and for my fantastic advisors, mentors, coauthors, and classmates.

We're happy to announce three new hires, marking the end of a very successful recruiting year. Join us in welcoming Ying Gao, Charlie Rafkin (
@CharlieRafkin
), and Miguel Ortiz (
@mortiz217
) to Vancouver, and to UBC! Article:

0
15
108
11
2
170
My paper on how changing government guidance affects the public’s beliefs — joint with
@AdvikSh
and
@plvautrey
— is now up on the
@JPubEcon
website!
This is my first publication (!), and I am excited to share a little about it (1/N)
2
17
97
Earliest documented instance of econ hating… absolutely wrecked by Proudhon in 1840
0
6
39
A charity scales up a development intervention, conducts rigorous testing, finds a null result, and then pulls back. Of course disappointing that this particular program didn't work, but this is exactly how policy should be done

Today, we’re proud to share an in-depth piece about why we
#TestAtScale
as an essential part of our
#Beta
process that takes
#evidence
-based interventions & incubates them for
#scale
to cost-effectively ↓ burden of
#poverty
for millions.
3
39
140
0
8
29
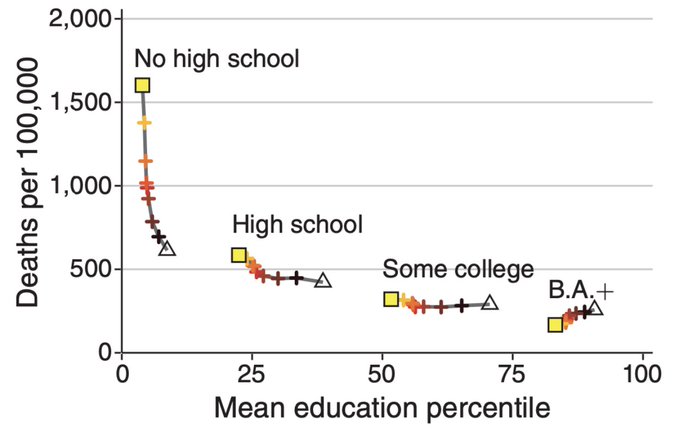
Mortality trends are catastrophic for people without a high school degree
In our new AEJ: Applied paper,
@thesamasher
@paulnovosad
and I show that selection alone is not responsible (using some nifty new tools)

A 🧵 on our work on US mortality change, just out in AEJ:App, with
@thesamasher
and
@charlierafkin
.
We ask: how concentrated is the U.S. pre-Covid mortality crisis? Is everyone doing a little worse, or is a small subset doing catastrophically worse?
The graph is a spoiler 1/N
19
281
971
1
2
25
when someone asks about my research plans for the semester
0
0
19
Sharing some simple Javascript code embeds that can improve Qualtrics surveys for econ/social science research
(+ if you have similar hacks, I'd love to see them!)
0
0
20
Sam, Paul and I have a new working paper on intergenerational mobility in India. We find evidence of very low (and declining) Muslim upward mobility in India — a stark contrast with mobility trends for India's other major demographics:
1
1
16
During a global crisis, it is nice to have some constants to rely on. Gives a sense of normalcy
e.g.: credulous coverage of correlational health studies as causal 🙃😩
2
1
14
Nothing to see here, totally normal democracy we have going

I will give $1,000/mo for the next 12 months FREE to someone who retweets this and follows me by July 4th 😃 Let's show why money is the answer & why this is the campaign for people. No purchase necessary. US citizens only.
7K
104K
48K
0
0
13
What is the German compound word for "feeling surprised, alarmed, and somewhat sad that I did not know this very basic fact about a computer programming language that I have used full time for several years" 😱

Important PSA:
@Stata
supports multiple missing values (not just “.” but also e.g., “.a”).
Using “!=.” as a test for nonmissing values is NOT robust and is asking for trouble! (Using the popular “<.” is even worse.)
PLEASE always use “~missing(•)” (even in joke tweets 😉)
3
39
196
1
1
12
thanks to
@Longreads
for featuring my article on Upper Valley poverty. let's start this conversation in Hanover.
http://t.co/wFvYIDI7b8
1
2
10
@salonium
One flag is that the indirect effect on dementia is larger than the direct effect on shingles (at least in pp). My guess (based on v little tbf!) is that biologically plausible “passthrough” could be no larger than 1 in 5, but the study is not powered to detect effects that small
0
0
9
Can both be true that:
a. The polls were very bad, at least in some states. WI and MI polls had larger errors than '16 (even if they ultimately called the winner correctly)
b. Polls are a better way of aggregating public opinion than the alternative (cringey diner interviews)
0
1
9
In a new working paper,
@paulnovosad
and I find that mortality has grown dramatically among whites in the bottom 10% of the education distribution. Runs counter to the trends all over the rest of the developed world. See thread 👇👇
Paper here:
1
5
9

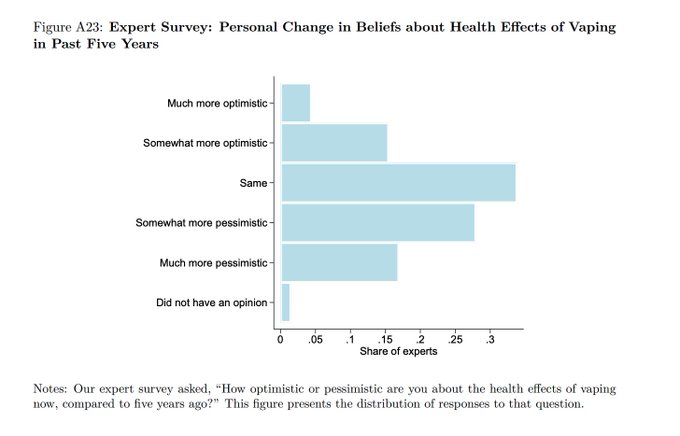
@s8mb
Agree that vaping is likely less harmful than smoking! But 20-100x less harmful is probably overstating it by an OOM.
e.g. Hunt Allcott and I did an expert survey in 2020, and experts reported e-cigs are ~40% as harmful as cigs:
4
0
8
lots of recent press about the stockton income demonstration (), which looks very cool
but I'm not actually seeing a formal "econ paper-style" write-up, just a white paper that's thin on quantitative material. am I missing something here?
1
0
8
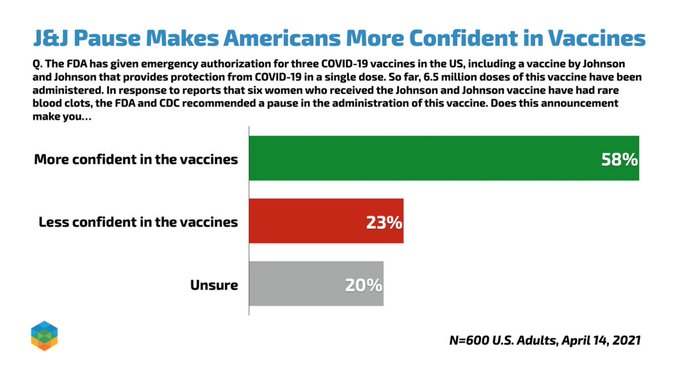
Even taking this poll about the J&J pause at face value, it doesn't move my priors much — targeting matters here
My concern is that people becoming more confident would always take the vax. Those becoming less confident are those who were previously unsure (marginal)

NEW POLL: The J&J pause makes people *more confident* in vaccines, not less.
M-O-R-E C-O-N-F-I-D-E-N-T
153
692
3K
2
0
7
This
@TheAtlantic
piece claims that
1. classical economics makes bad predictions
2. economists use too much statistics
if we want to come up with better models, feels like we should do more stats, not less?
1
0
7
@joshdkoenig
@v_rendleman
just wondering, did you first learn about the Cold War before or after you started your PhD in history?
1
0
6
@parapraxist
@paulnovosad
@thesamasher
Good question! The width doesn't come from sampling error but instead from interval censoring of education percentiles. The basic idea is that we can't observe the fathers in the bottom 50% perfectly, because we only see education in coarse bins (which cut across percentiles)
1
0
5
@paulgp
Nice! also check out scfses, a Stata program to get quantiles (and SEs on quantiles) of SCF variables
0
3
6
Earnest opinion is that "super long-term" (100 yr +) research projects are way too rare.
The reason is that PIs setting up the study don't get benefits from research 100 yrs in the future. Grants could easily address this with more dedicated funds for super long-term work!
1
0
5
We started this project when I was an undergrad (3+ yrs ago), and it's been a super instructive experience to see the paper evolve! We ran into some metrics problems along the way, so we developed some cool tools from set identification to solve them:
0
0
4
@owasow
@ciphergoth
Going further, there's even a Will Rogers phenomenon here where those ex-Republicans joining the Democrats pushes *both* the Democrats and the remaining Republican party to the right...
1
0
4
@MaxCRoser
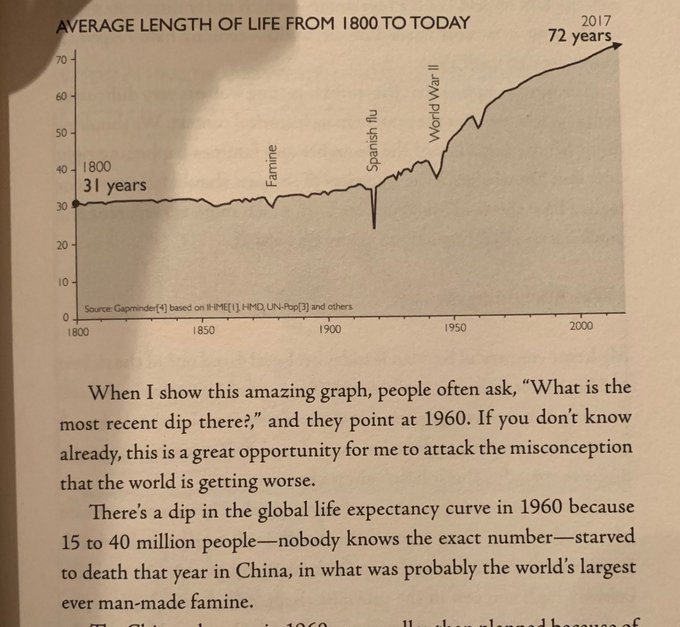
Nice! But, the child mortality point is often used when people say that life expectancy in 1850 = 40 -> "most people" in 1850 lived to age 40
These graphs still show that this reasoning is incorrect - if you lived to age 20 in 1850, you were pretty likely to grow old
0
0
4
The reality is that both interpretations are consistent with the data, and controlling for time shocks, aging, and cohort effects is tough to nail. Generally requires a functional form assumption.
Took
@jonpcohen
and me >3 months to understand this point when we were RAs!
0
1
4
This
@reason
piece claims that hate crimes have *not* gone up, even though the 2017 FBI report says they increased by 17%, because 1,000 new agencies reported crimes. Sadly, the back-of-the-envelope math suggests hate crimes *have* gone up, even net of the increase in agencies
1
1
4
@adamrpearce
extremely cool, thanks for making this
the justifications of the 538 negative correlations really seem like ex-post rationalizations. hard to believe this was this something they intended
0
0
3
But wondering what
@robbysoave
and
@nickgillespie
think about these really obvious calculations that suggest hate crimes have increased, even net of the increase in # agencies? Would love to be proven wrong here, but I just don't see it
0
0
3
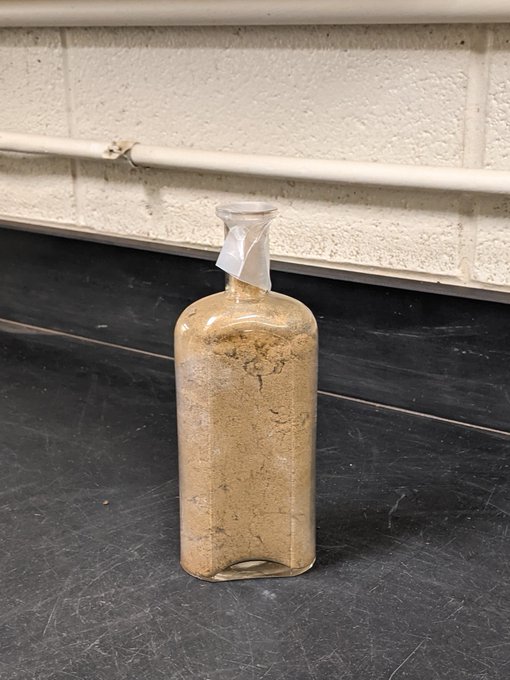
Brb, pitching a research idea that takes 141 years to my advisors

Big news about this amazing little bottle: After spending 141 years underground, it was unearthed this week by the Beal Seed Viability team (Frank Telewski, Margaret Fleming,
@DavidBLowry
,
@weber_mg
, and myself)!
53
871
3K
1
0
3
Ungated version here: (9/9)
And, thanks again to Advik and PL for a really fun collaboration!
1
0
3
@Gorman_Siobhan
@thedartmouth
Thanks Siobhan! Lots of challenges for engagement—but also many opportunities.
0
0
3
thanks to
@USATODAY
and
@collegemedia
for featuring the special issue on sexual assault that Min, Josh and I edited
http://t.co/0ZwbQfb9cn
0
0
3
@paulnovosad
Yeah, though it's also annoying when lab leakers act as if their posterior is > 90%
Maybe true of many conspiracy theories. Believers overstate their true certainty to shock people who currently think the probability is 0
1
0
3
@pursuingabbynes
Nuclear emergency warning -> descend 100 hours on escalator to safety… the perfect plan
0
0
2
Our key idea is to use new methods to study the bottom 10% of the education distribution over time. Prior work has had to aggregate nearly the whole bottom half — but we find that the big mortality gains are concentrated among the very bottom, with percentiles 10-45 mostly flat
1
0
3
Time-tenure-cohort multicollinearity in the wild (Ameriks-Zeldes 2004)
A new paper by Thorne et al. argues that bankruptcy is increasing among older people. Meanwhile The Economist comes to another conclusion: it's the "profligate generation" of Baby Boomers

Could it be that baby boomers have always been particularly prone to going bust?
10
20
57
1
1
3
@thedartmouth
@TomBurtonWSJ
Thanks again for the s/o—hoping for more discussion here in Hanover about our obligations (if any) to the region
0
0
3
there's a *striking* result that $500 cash/month increases employment by +7 pp (treatment - control, difference in difference over time). very exciting result that suggests giving cash can stop poverty traps!
but, afaik no table that gives an SE for that...?? kinda bizarre tbh
0
0
3
Usually think 538 explains this stuff well... but is there any justification for tinkering with an election model as the results come in, just so that the results confirm your priors?

Well, I'm trying to do 6 things at once -- we think our live election day forecast is definitely being too aggressive and are going to put it on a more conservative setting where it waits more for projections/calls instead of making inferences from partial vote counts.
302
377
2K
0
0
2
Anyway this took me about 3 minutes to compute. I did all the calculations in Spotlight on my laptop. I didn't compute standard errors, and there are maybe reasons to be worried about the quality of hate crime data
1
0
2
@AdvikSh
Yes! An issue with marginal thinking here is that reducing hassle costs is still great for people always vote (inframarginals)
0
0
2
Upper Valley faces challenges, and Dmouth can do more. Context: 25% are below pov. line in a town 20 mi from Hanover.
http://t.co/dXa9tQM3oU
0
6
2
@A_agadjanian
How historically anomalous is it to have huge polling error (+7/+9) in the tipping point state? I think this is part of why the polls *feel* so bad — they're really off in the most important state
1
0
2
@BrorettaChill
@reganhaegley
once loretta enters any conversations about puns, Lucida real master at work
0
0
2
@bethamaiman
right - there's tons of data. Community leaders can be helpful in distilling what matters
0
0
2
Lots more graphs and insights in the thread (and paper)!
0
0
2
0
0
2
@otis_reid
Wait is there evidence that legislators *do* change votes due to call volume? Imagine hard to separate calls per se from aggregate changes in public opinion
1
0
2
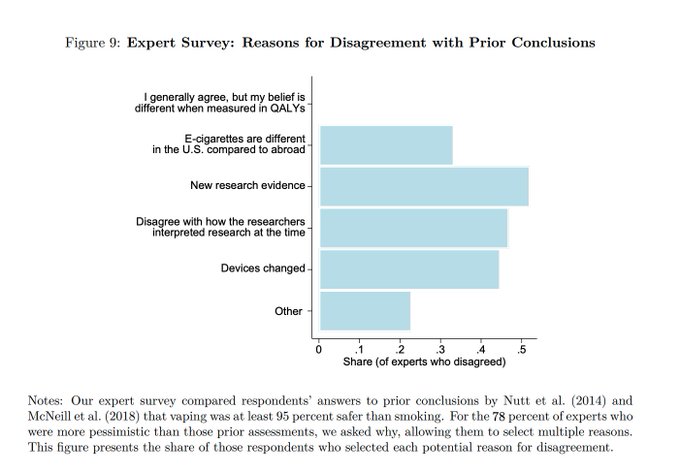
@s8mb
Thanks! In our survey, we elicited experts' reasons for disagreement with the 2018 version PHE report (McNeil et al., 2018). 78% of experts explicitly indicated that they are more pessimistic than the PHE report about e-cigs. Here's why:
2
0
2
@robertwiblin
I’ve been discussing this with Sam in the thread below. Agree it’s safer - but much more uncertain that it’s 100x safer as you both seem to think
@s8mb
Agree that vaping is likely less harmful than smoking! But 20-100x less harmful is probably overstating it by an OOM.
e.g. Hunt Allcott and I did an expert survey in 2020, and experts reported e-cigs are ~40% as harmful as cigs:
4
0
8
0
0
1
@salonium
@paulgp
@paulnovosad
@thesamasher
yeah, i love this paper and their analogy to comparing alaska vs. the US
but - we ultimately conclude the opposite way, ie there are in fact real (and huge) increases in mortality for the bottom 10%
1
0
2
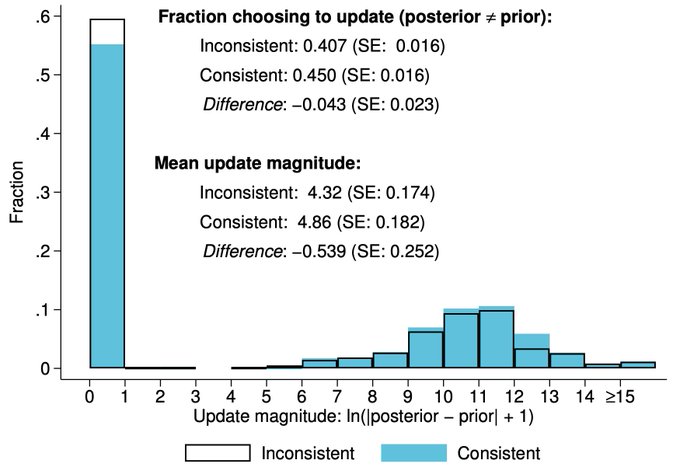
We study incentivized belief updates about how many people would die from COVID
People exposed to changing guidance are 4 pp less likely to update their beliefs. The magnitude of their belief update is 40% smaller.
Summary: changing guidance makes people’s beliefs sticky (6/N)
1
2
2
Working paper released in 2162, publication version 5 years later
1
0
2
@nleckstein
@KoenigJDav
yeah nate, really cool to show up as a guest and insult the school for no reason/with no justification. Smart move
0
0
1
@instrumenthull
@c_r_walt
Thanks, super helpful. Do you know if you can get an analog to the clustered bootstrap by drawing the same weights within a cluster?
3
0
2
So proud
@thedmirror
published this incredibly diligent reporting by
@priyaminent
on challenges int'l students face:
http://t.co/EPnvi8kCGR
0
0
1
@NinaPavcnik
@DartmouthEcon
@paulnovosad
@dartmouth
Thank you! I'm so grateful for the training/mentorship I received (and still receive) from dartmouth econ 🟩🎉🟩
0
0
2
0
0
2
@albrgr
OTOH, for results that contradict intuition, we get a tremendous amount of regularly updated research.
ironically, because people want to prove the sign, a knock-on effect is we learn more about magnitudes
e.g. min wage or immigration employment effects
0
0
2
@aegallagher
thanks for featuring my article via
@Longreads
. Excited to share complex story of Dmouth and the UV with wider audience
0
0
1
@nleckstein
Haven’t seen it but I identify with the friend who was really grumpy his friends woke him up for some game
0
0
1
@s8mb
Just think more uncertainty is appropriate. 78% of (US) experts explicitly disagree with the lit review you cite.
Ofc experts can be conservative or wrong. But I wouldn't be so confident in my mastery of the underlying e-cig science not to update if >3/4 of experts disagree
2
0
1
@BasilHalperin
@alexeyguzey
Don't think it has been done, at least with partial identification methods. Agree that it would be a very useful application of this
0
0
1
@albrgr
@slatestarcodex
There exists EA for US politics: donating to Dems running in high-leverage seats
We have plenty of evidence that (i) the key impediment to ending political dysfunction is the Republican party, and (ii) campaign donations (esp ads) are reasonably effective
1
0
1
The key feature of our design is that *all* participants also received a contemporaneous projection about the number of deaths from COVID. Thus we can isolate how people respond to this projection (5/N)
1
0
1
Spanish influenza had 2 to 3 times the impact on world life expectancy as WWII...??!!
Spanish flu really in that sweet spot of "super super important historical events" and "events I know nothing about"

3
0
1
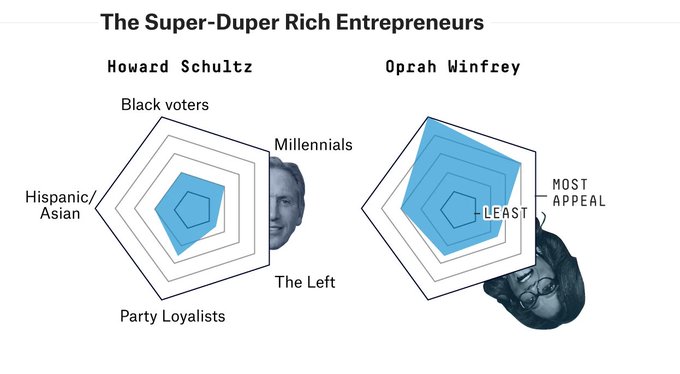
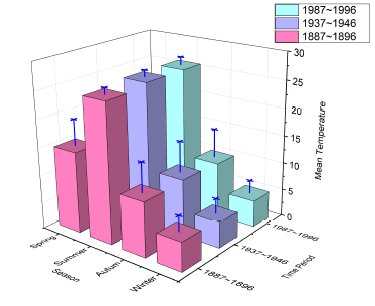
So why not just give a 1-5 rating for each outcome and use bar graphs?
1
0
1
@sadmonsters
thanks for the workshop! Hopefully I won't have to give up and go to law school now
@DartmouthJacko
@bucc_official
0
0
1
@alexeyguzey
Do you think Google is more innovative than if you gave the engineers/scientists who work at Google their outside option (and equivalent amounts of funding/overhead)?
I think plausible that Google is *less* innovative than the sum of its parts
2
0
1
1) Plot area does not grow intuitively w importance: a candidate getting all 1s has a plot with less than half the area as person w all 2s.
This is the same reason you shouldn't use those horrible 3d bar charts in Excel! Area should be a natural representation of importance
1
0
1
@KiraboJackson
Have also seen exceptions that aggregate estimates of "deep" primitives/commonly used elasticities. e.g.:
- Gallet and List (2003) on the demand elasticity for cigarettes
- Imai et al. (forthcoming EJ) on the present bias beta:
0
0
1
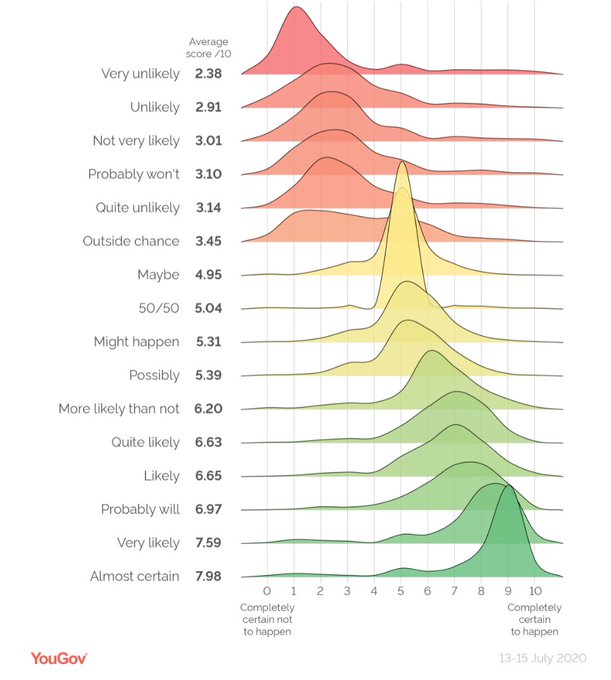
Others raise important concerns about measurement, e.g. here

@benwakana46
Don't trust this question!
Here's why you shouldn't listen to questions like this:
1
3
23
0
1
1