JWeiland
@JPWeiland
Followers
27,631
Following
191
Media
1,018
Statuses
4,620
Scientist. Infectious disease modeler. Tweets and spelling mistakes are my own Models and analysis seen on @Newsweek @Fortunemagazine @FaceTheNation @NYMag
Joined May 2012
Don't wanna be here?
Send us removal request.
Explore trending content on Musk Viewer
América
• 548148 Tweets
Switch
• 238983 Tweets
LINGORM TUKTUK GOGO
• 122378 Tweets
Knicks
• 105998 Tweets
महाराणा प्रताप
• 81562 Tweets
Brunson
• 76106 Tweets
#jjk259
• 73385 Tweets
ドカ食い
• 67458 Tweets
Choso
• 58574 Tweets
もちづきさん
• 58121 Tweets
MAURO AL 9009
• 52897 Tweets
Yuji
• 43244 Tweets
Gege
• 38150 Tweets
アイスの日
• 29509 Tweets
Sukuna
• 28603 Tweets
血糖値スパイク
• 22812 Tweets
頂き女子
• 21668 Tweets
Oilers
• 21374 Tweets
#MaharanaPratapJayanti
• 19837 Tweets
クロステーマスカウト
• 18189 Tweets
シナモン
• 17868 Tweets
タキオン
• 17110 Tweets
Pachuca
• 15729 Tweets
結婚詐欺
• 15014 Tweets
女性向け
• 14267 Tweets
ポチャッコ
• 12740 Tweets
男性向け
• 11998 Tweets
Last Seen Profiles


Pinned Tweet

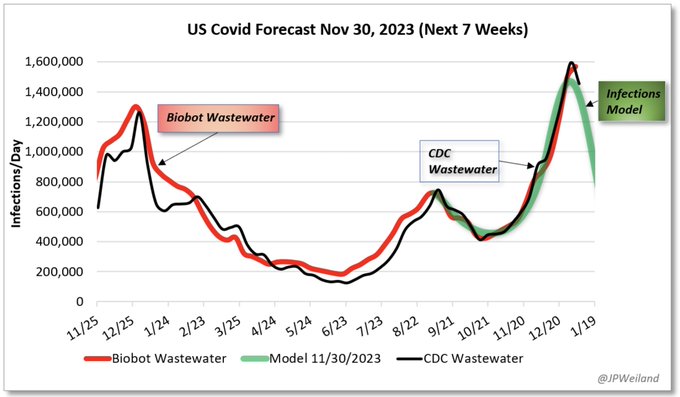
We now have updated data from the CDC and Biobot to compare to the forecasts I've put out. This thread are the results vs model, including all my models from earlier this year.
Please evaluate to check my forecast accuracy!
First, the hosp "range" near the peak.
18
94
403
Omicron is likely the **Fastest spreading disease known to man**
Conservatively, Rt =5
But what about measles in unvaxed population at R0=15??
Its all about generation time. Measles is 15 days, Omicron is <5
60 days after 1 case:
Measles: 50,600
Omicron: 244,000,000
99
3K
7K
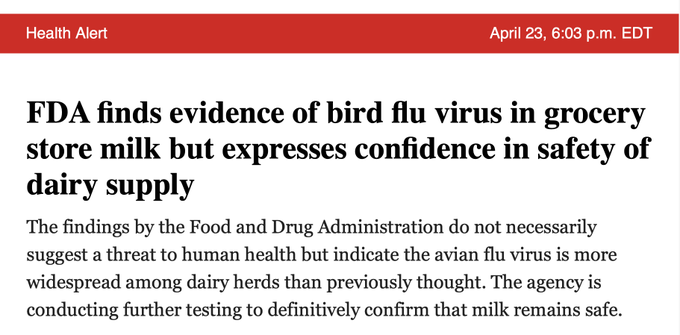
Finding H5N1 bird flu (though presumibly inactivated via pasteurization) in the grocery store milk supply does not fill me with confidence that we have this situation under control at the moment.

This isn't good, folks.
I'm not worried about H5N1 transmission to humans (yet) but the
@USDA
pathetic lack of transparency, how long it took for the genomes to be released, lack of testing asymptomatic cattle......
All detracts from "confidence"
125
1K
4K
33
605
2K
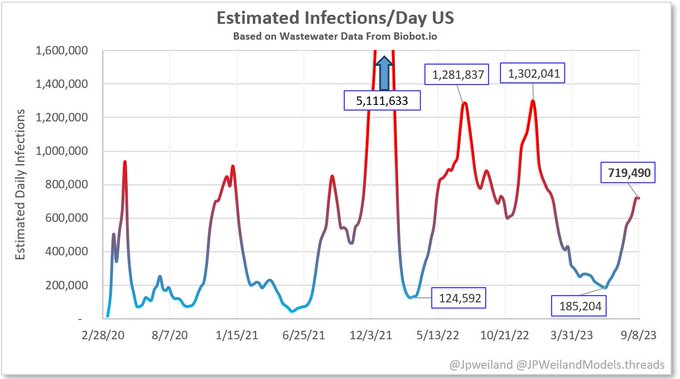
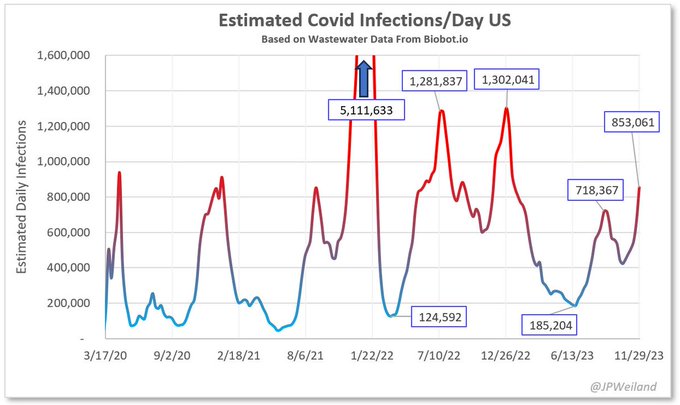
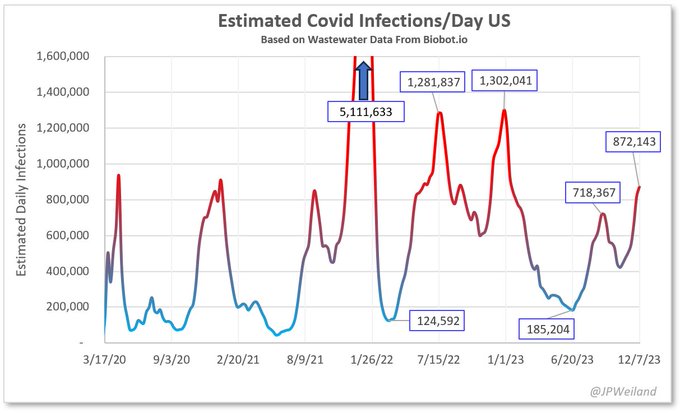
September 8th US update:
Community spread of Covid is "high", with a correction upwards last week as well. Current estimates:
🔸720,000 new infections/day
🔸1 in every 460 new people were infected today
🔸1 in every 46 people currently infected
79
735
2K
@MichaelaOkla
@ElizabethRenzie
He was a QA manager in the middle of testifying that Boeing had skirted a lot of safety measures during manufacturing.. then was found dead before the 3rd day of testimony. Friend said he was worried he would be killed and it labeled suicide. 😳
3
24
2K
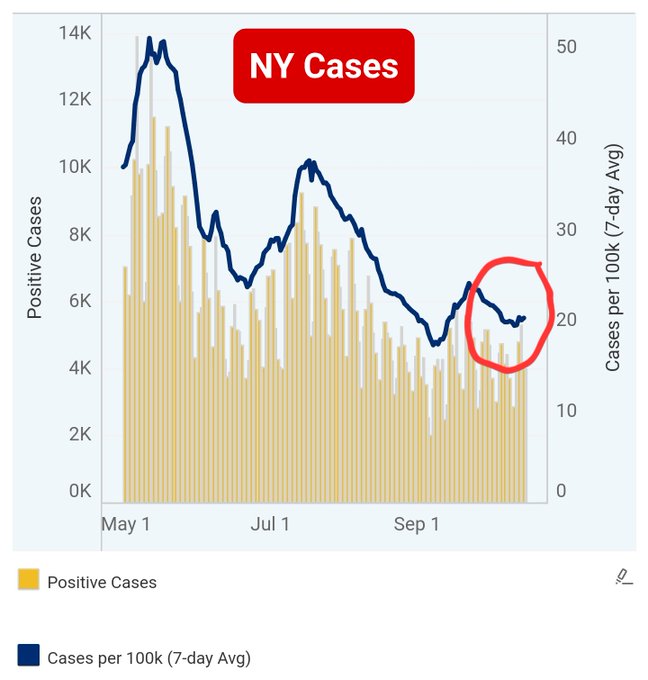
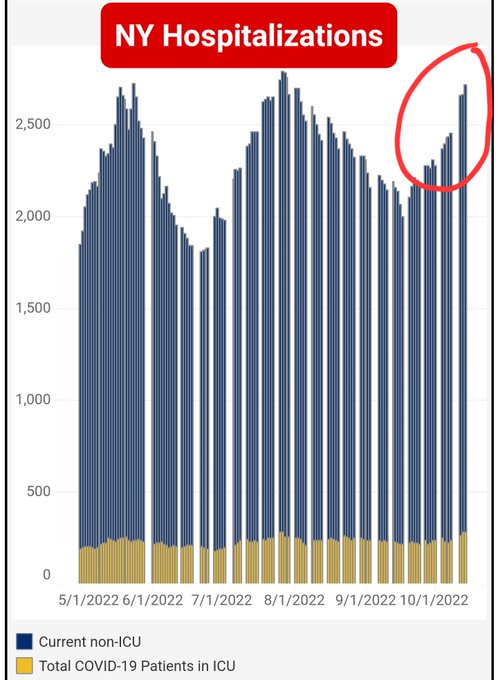
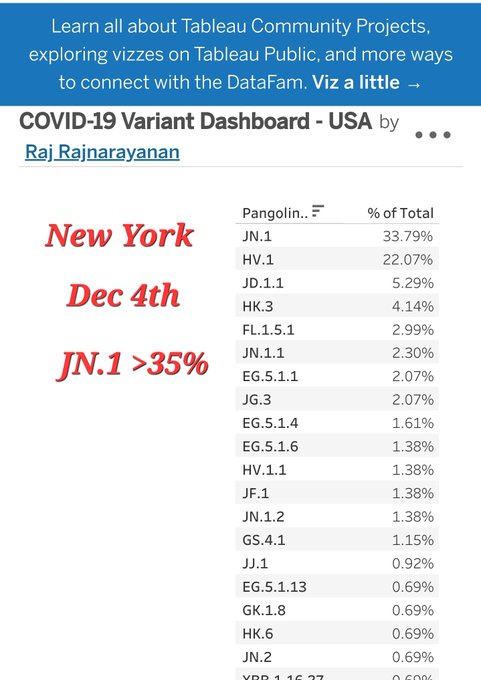
Something interesting is happening in New York. Cases have been flat over the past month, however hospitalizations are jumping significantly. New York has the highest BQ.1* proportions in the country, estimated at 25% of cases today by CovSpectrum
94
594
2K
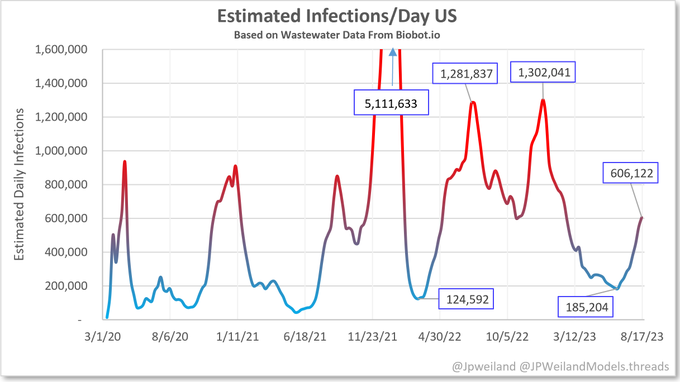
August 17th update (Biobot): US community spread is back up to "high" with an estimated 610,000 daily new infections.
Similar levels in all 4 US regions.
🔸610,000 new infections/day⬆️
🔸1 in every 550 new people were infected today
🔸1 in every 55 people currently infected
40
810
1K
I made a visualization of how XBB.1.5 will spread across the country.
Expect the next few weeks of CDC XBB.1.5 data to appear to slow down in the next few weeks as Northeast saturates and other places catch up. It won't be actually slowing.
46
533
1K
December 4th Update:
As predicted, a huge jump in numbers this week. 40% ⬆️ over last week. Pirola ⬆️⬆️.
🔸850,000 new infections/day
🔸1 in every 390 new people were infected today
🔸1 in every 39 people currently infected
38
559
1K
I think this is an important point. Rest is your best friend when recovering from Covid. I worry that these guidelines will encourage over-zealous employers to assume people will report back to jobs after one day, which is exactly the wrong thing to do for multiple reasons.

Studies show that you need to rest when in you have COVID to reduce your risk of Long COVID. The CDC shortening their COVID isolation guidelines will put people at greater risk of Long COVID.

70
3K
9K
21
380
1K
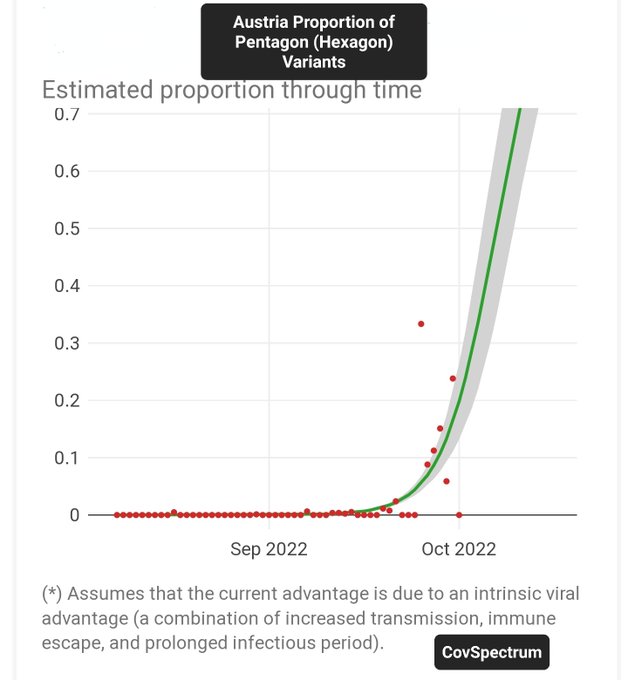
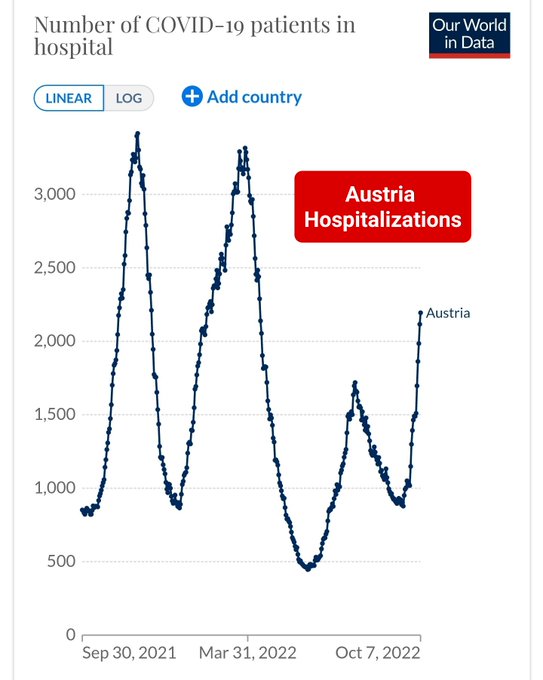
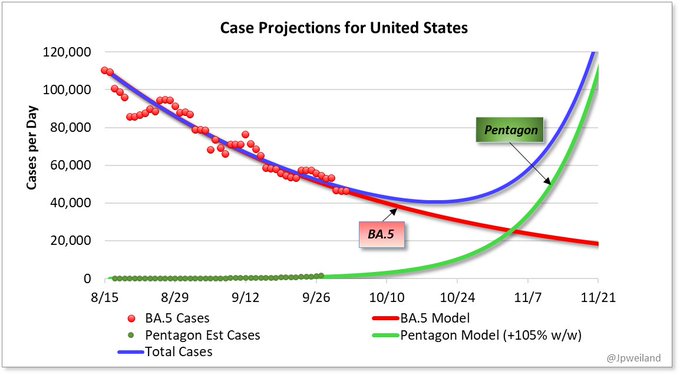
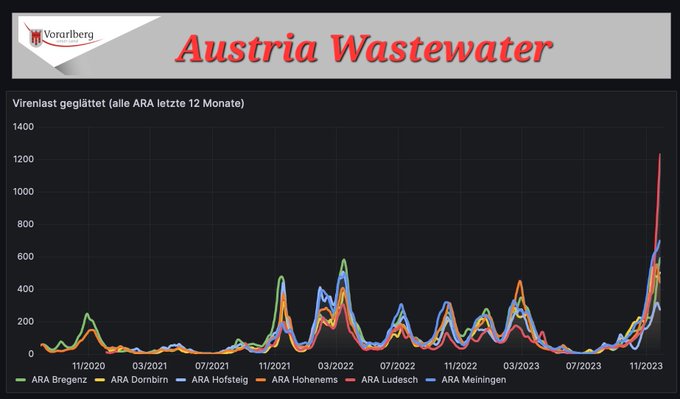
Austria is the first European country where Pentagon /
#Hexagon
may already be dominant
Hospitalizations are rising faster than any of their Delta or Omicron waves. I don't know what to make of it at this point, but needs to be watched in case there has been a change to severity
36
461
1K
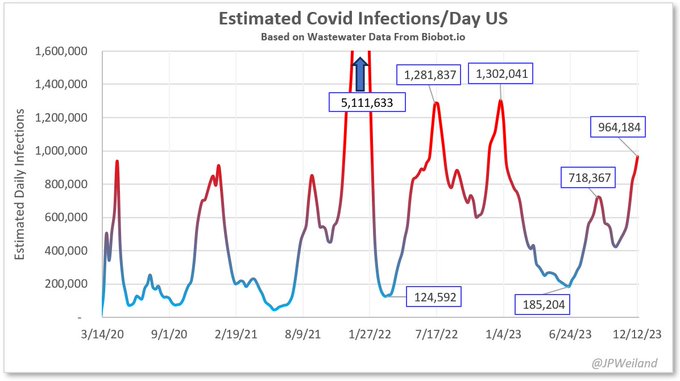
December 18th Update:
Case increases continue, with JN.1 Pirola dominance expected within a week. Near 1 million/day, and not near the peak yet.
🔸965,000 new infections/day
🔸1 in every 340 became infected today
🔸1 in every 34 people currently infected
37
553
1K
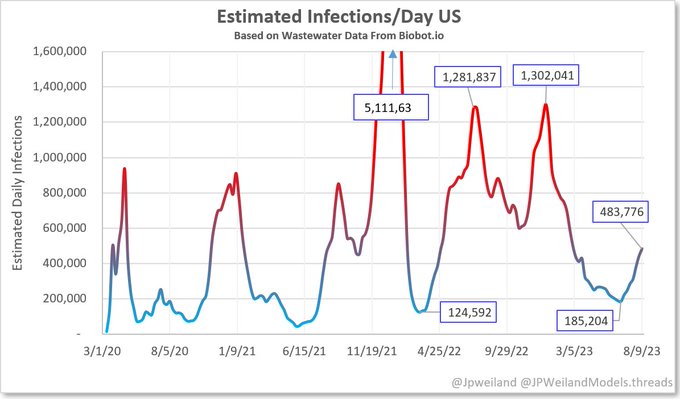
US is nearing 500k estimated infections per day (Aug. 9) from New wastewater numbers
🔸484,000 new infections/day⬆️
🔸1 in every 680 people were infected today
🔸1 in every 68 people currently infected
38
524
1K
I can confidently say XBB.1.5 will NOT approach the levels of hospitalizations and deaths seen in the initial Omicron wave in the US.
However I do believe it will be the highest seen since then.
Don't be panicked, be informed 👨🔬
102
224
1K
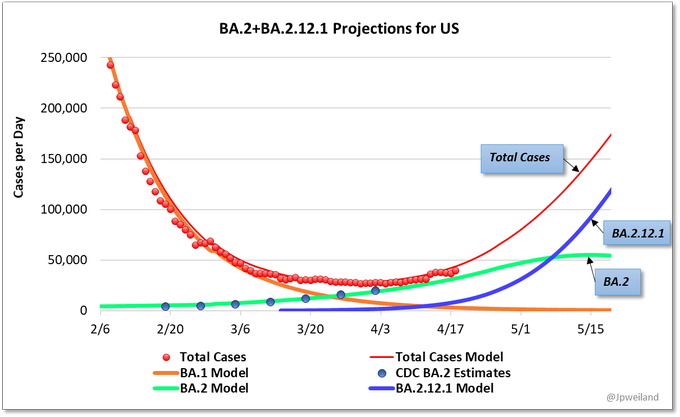
New Subvariant B.2.12.1:
68% week/week advantage over BA.2
Significant growth of total numbers, doubling each week. 2.5x doubling speed compared to BA.2
New US projections model:
54
407
1K
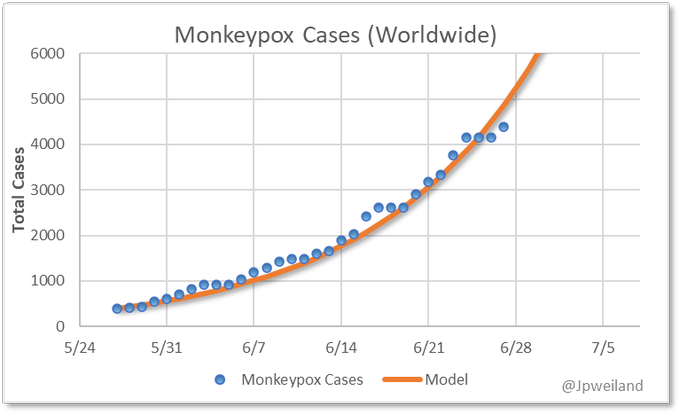
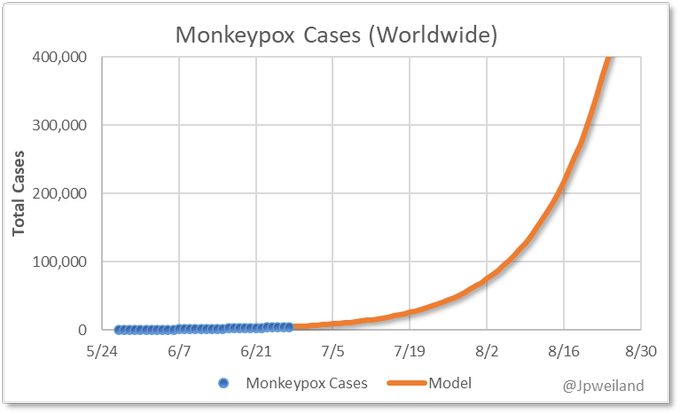
Monkeypox projections
Now we probably have enough data to model MPX cases forwards in the short term.
*IF* the current trend continues, we would expect to see 100k worldwide by August, and the first million in September.
67
450
941
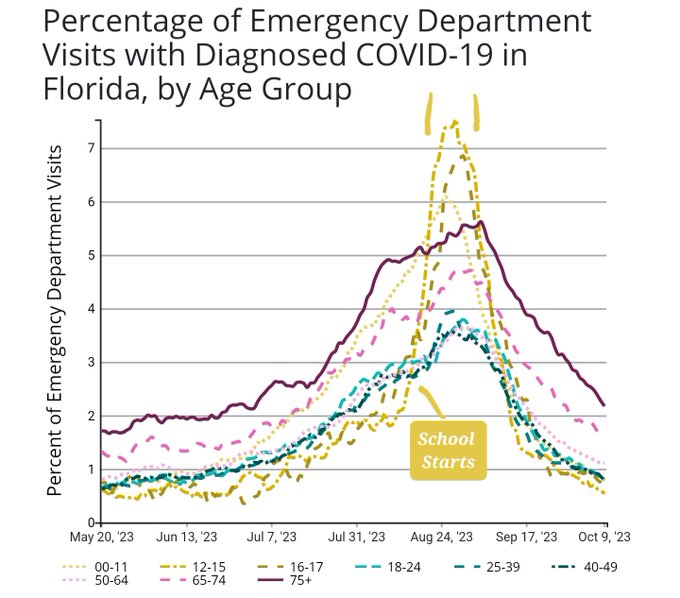
It's pretty remarkable that you can see exactly when school starts in the Covid data by age.
Look at how sharp that spike is vs adults, then after all the susceptables are infected in 2wks, it plummets.
Pretty convincing of the high rate of spread in schools.
28
344
960
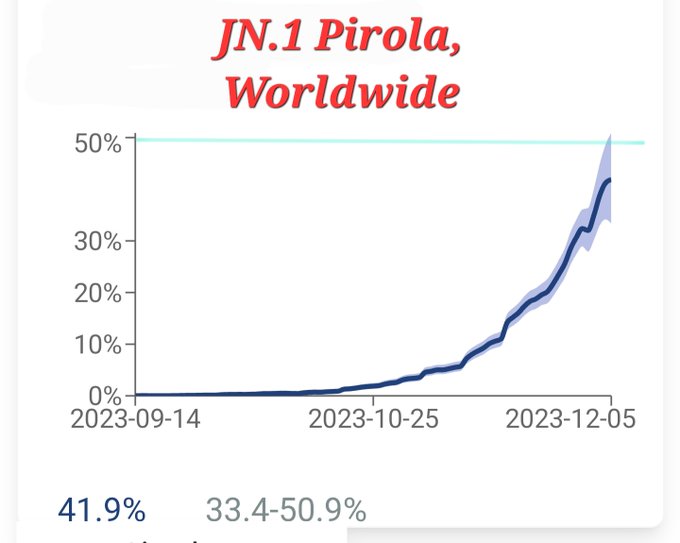
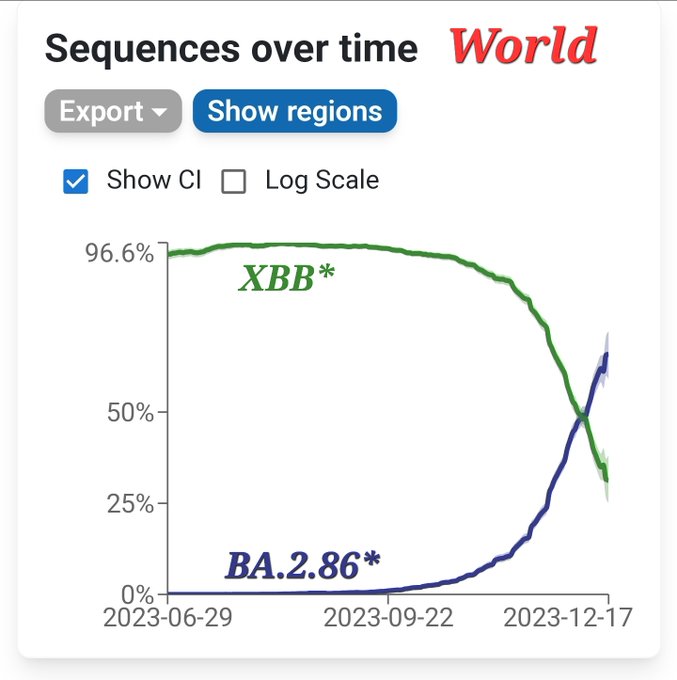
JN.1 Pirola is now the dominant variant worldwide.
At 12/5/23 it accounted for 42% of sequences. The trajectory is clear that it has now surpassed 50%.
18
408
953
We are seeing multiple variants with convergent evolution that will drive the next wave.
All variants with 5+ key RBD mutations can be grouped together, I am referring to this group as "Pentagon" for sharing the 5 mutations.
Thank you
@CorneliusRoemer
for covspectrum collection
34
335
928
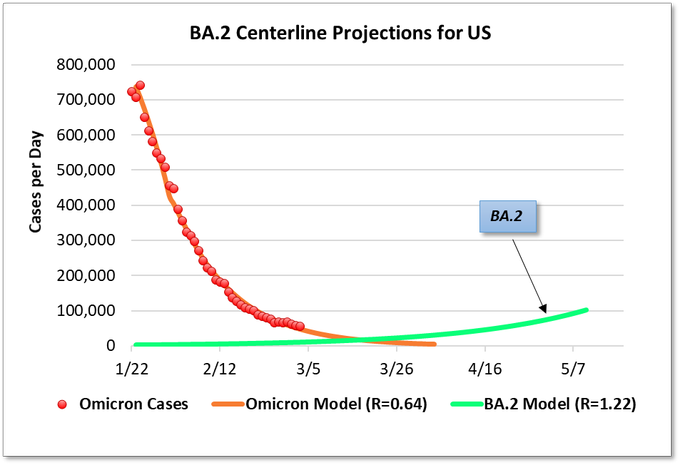
BA.2 projections in the US:
Coming off of the massive omicron wave (Rt=0.64) will provide a lot of immunity to restrict BA.2 spread rate.
A good chance we may see a BA.2 wave in April-May. A lot of factors to consider:
36
338
915
December 23rd Update:
Early update from Biobot due to holidays. Wastewater levels approaching last year's peak. JN.1 dominance will exhert ⬆️ pressure. Estimates:
🔸1,120,000 new infections/day
🔸1 in every 290 became infected today
🔸1 in every 29 people currently infected
56
466
924
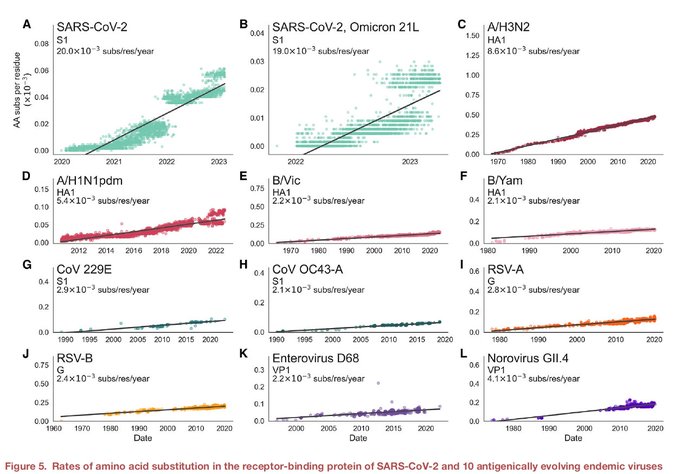
Sars2 still evolving 6-10x faster than the other coronaviruses, and 2.5-9x faster than flu strains. And it hasn't slowed down (yet).
No wonder we keep getting wave after wave, while the others have become more seasonal.
The
#SARSCoV2
virus is accumulating mutations with amino acid substitutions faster than other endemic viruses, including 2.5 fold more rapidly than influenza (A/H3N2 HA1), the prototype of rapid antigen evolution
@cellhostmicrobe
@tvrb
@fredhutch
1
685
2K
30
414
921
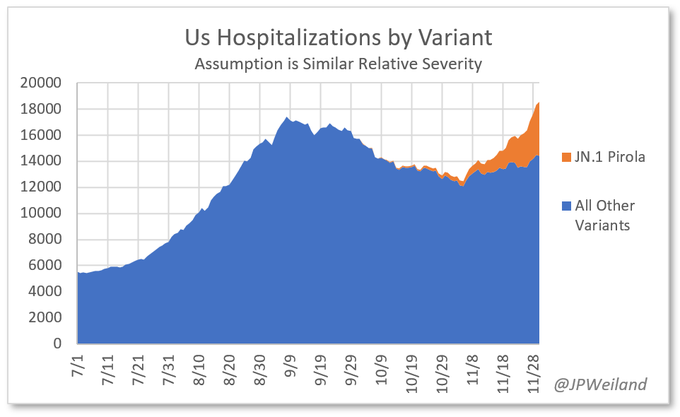
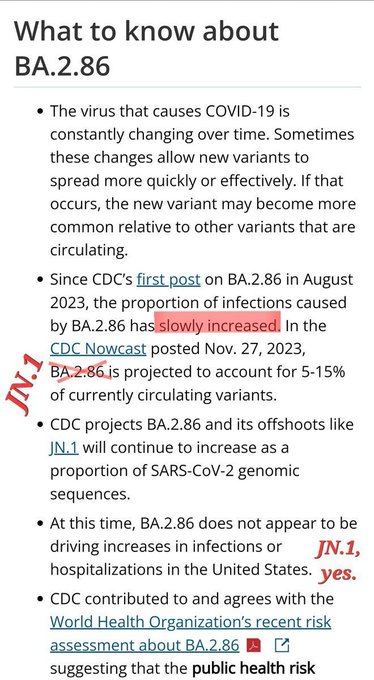
The CDC recently said that Pirola is not appear to be driving increases in hospitalizations or cases.
This chart respectfully disagrees. The other variants seem to be stable. JN.1 is driving it.
27
312
908
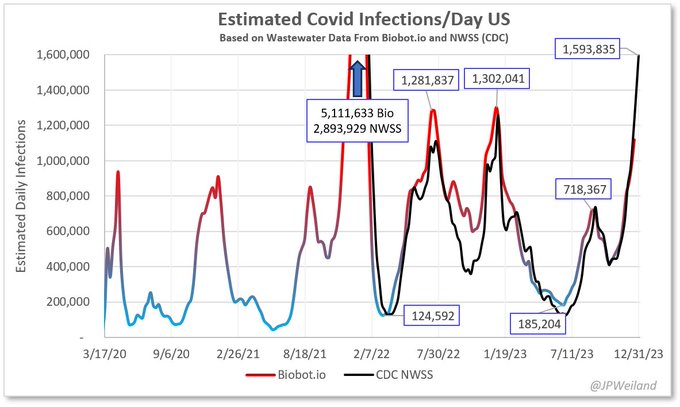
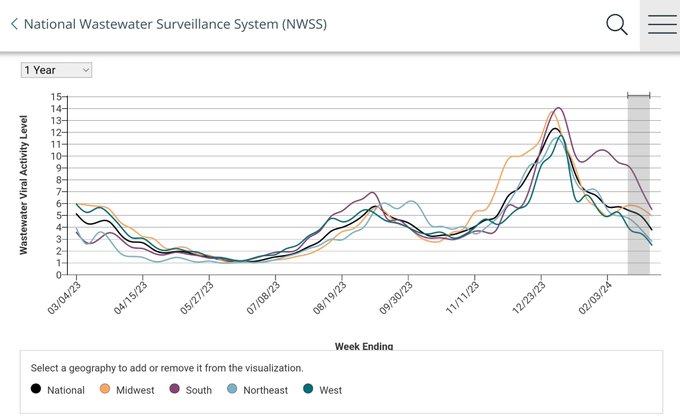
📈In absence of the Biobot data this week, the NWSS CDC Wastewater data will be used. The recent increase puts us into 2nd highest levels, only behind December 2021.
🔸1,590,000 new infections/day
🔸1 in every 210 became infected today
🔸1 in every 21 people currently infected
23
439
910
With JN.1 now the dominant lineage worldwide, and creating large waves in its wake, a reminder that we warned all of the proper authorities two months ago, at only 40 sequences.
I don't send an alert to the
@CDCgov
@WHO
without cause.
This is another alert to
@WHO
@mvankerkhove
@CDCDirector
@CDCDirector
@nirav_uscdc
@ScottGottliebMD
@EricTopol
that JN.1 (BA.2.86.1 + escape mutation L455S) appears to be growing very quickly. 5 seq had been discovered just over two weeks ago, as of yesterday the count is >40.
9
154
487
26
273
891
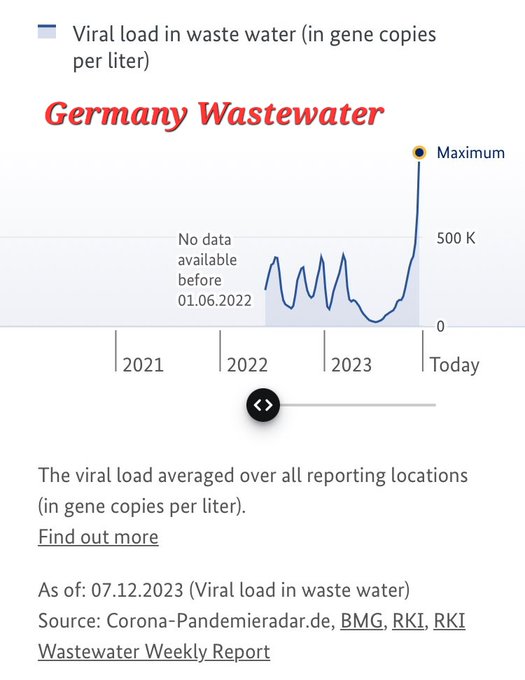
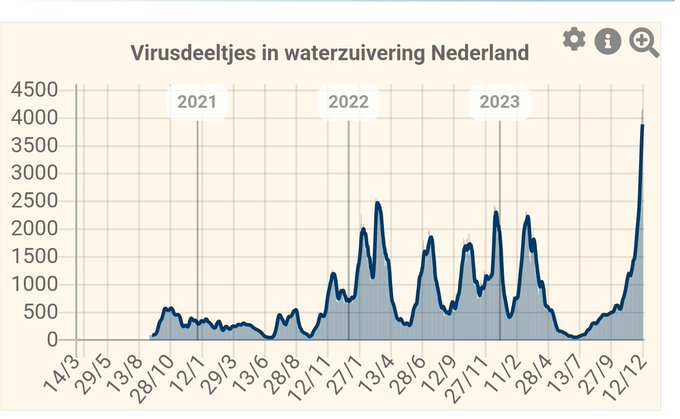
🔹️Witnessing some of these record setting wastewater signals is now MANY European countries after Pirola dominance is eye opening.
We have to prepare ourselves for at least the *possibility* that we see a very large spike in the US in coming weeks.
20
373
884
A surprising jump in the Midwest's wastewater this week ()
Estimates on current active infections in the population:
Midwest: 1 in 44 people ⬆️⬆️
Northeast: 1 in 70 people
South: 1 in 72 people
West: 1 in 75 people
47
400
874
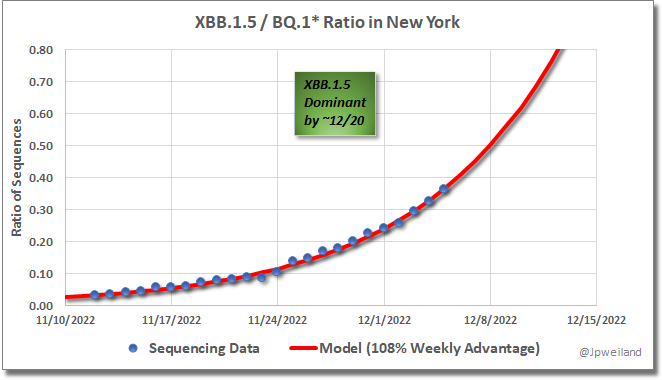
New York in for a surge
XBB.1.5 really moving quickly
My current estimate: ~108% advantage over BQ.1*
This surge will come on top of already elevated numbers
Wave starting this week, watch for it
32
366
854
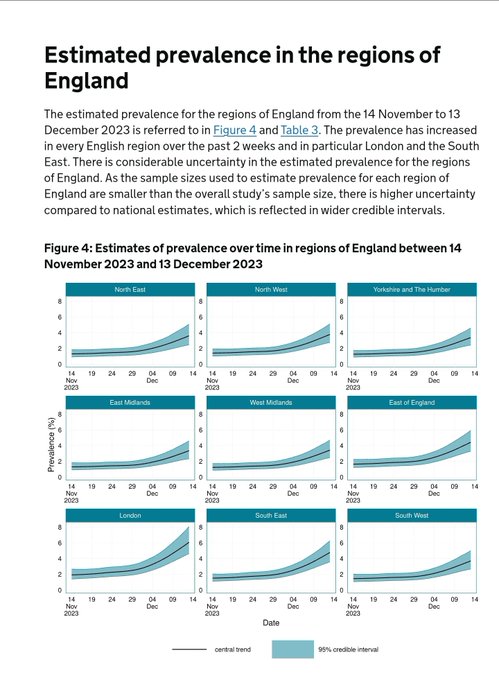
For anyone who thinks 1 in 29 currently infected in USA is "Wayyy too excessive", compare that estimate to the United Kingdom, where prevalence is *actually measured* via population testing.
Results:
▶️England: 1 in 24
▶️London: 1 in 17

@JPWeiland
1 in 29 seems wayyy too excessive. You’re the only account/source I see reporting those kinds of numbers
13
1
5
46
311
848
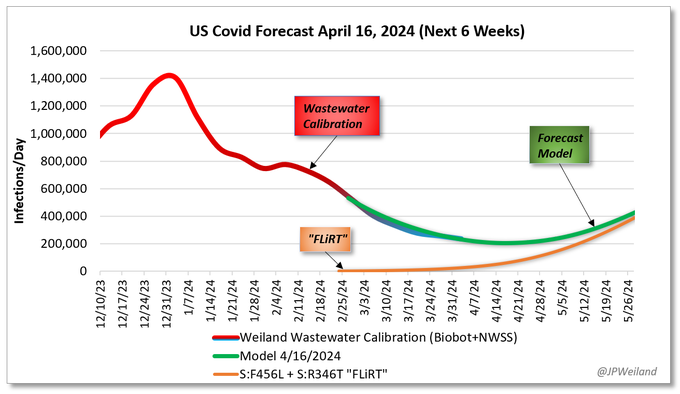
New 6 Week Forecast:
🔸The lull may be over sooner than most of us hoped in the US due to "FLiRT". Infections are expected to start rising again after bottoming out in late April.
⚠️Recent seq data has been poor, so timing and significance of FLiRT carries some uncertainty.
29
276
838
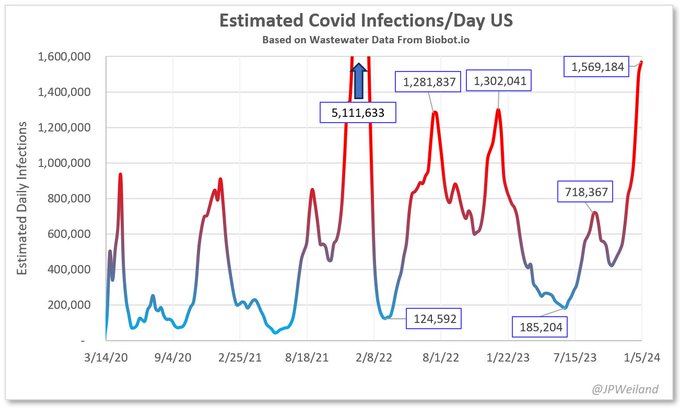
Wastewater update 1/9/24:
As +/- predicted by the 5 1/2 week old model (next post), new Biobot data suggests we are at peak levels. Should decline from here.
🔸1,570,000 new infections/day
🔸1 in every 210 became infected today
🔸1 in every 21 people currently infected
26
275
818
I think it is time for the
@CDCgov
and
@CDCDirector
to speak openly and honestly about JN.1 (Pirola). Just stick to the facts.
🔸️It is growing quickly
🔸️It is contributing to increases in cases/hosp
🔸️Will accelerate in coming weeks
🔸️21-35% on Dec 7
Prev communication:
25
289
803
@FrankCianfrani
No, that's how those tests work. Control line can absolutely be lighter than the test line. That just means they have a huge viral load. Terrible doctor.
2
21
788
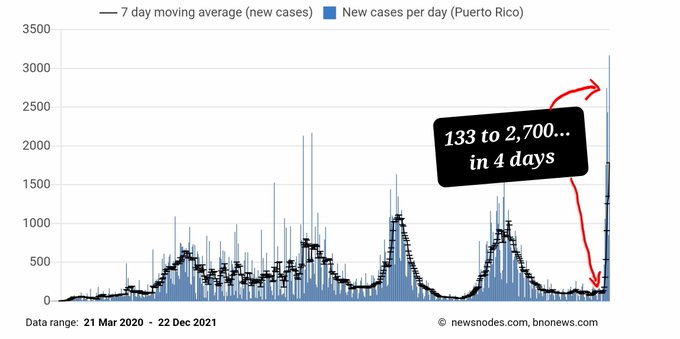
Want to see an example? Puerto Rico was at a steady 130 cases/day.
Only 4 days later, cases shot up 2000% to 2,700 cases/day
13
197
771
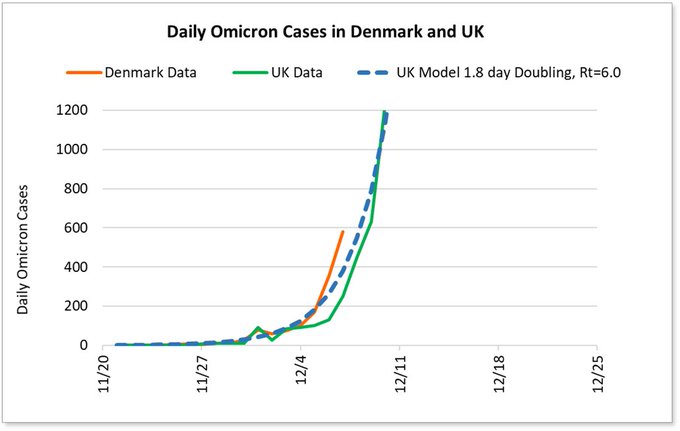
Denmark and the UK both tracking about the same Omicron growth rate (~1.8 day doubling time). Still tracking to have a massive wave around Christmas. 400-500% advantage over Delta.
Would be a true Christmas miracle if Omicron turns out to be significantly milder than Delta.
31
330
767
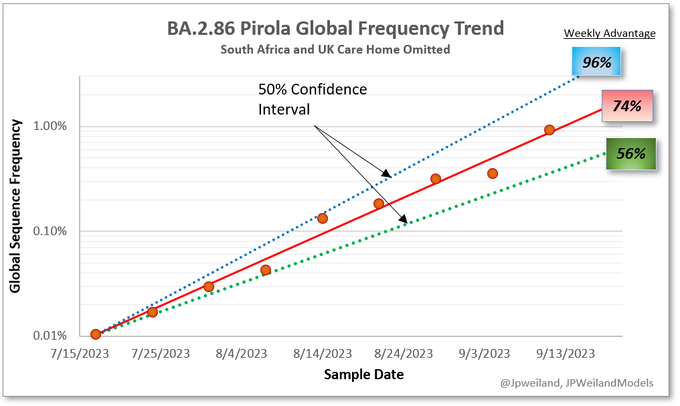
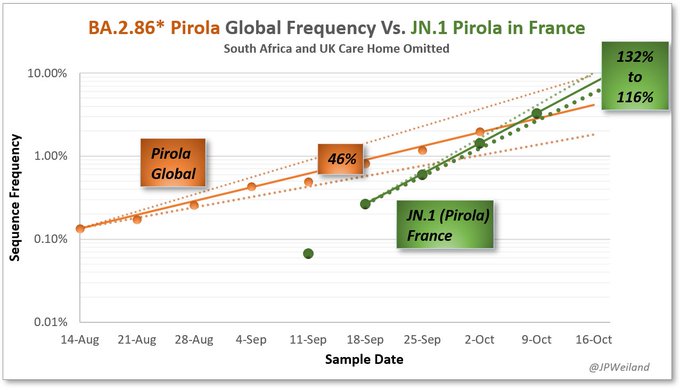
BA.2.86 Pirola's global growth advantage is becoming more clear. I excluded South Africa's data (way too messy), and the UK care home cluster.
Estimated weekly advantage is 74%, with a 50% CI of 56-96%.
If this holds, it would suggest Pirola outcompetes the strongest FLips.
15
282
774
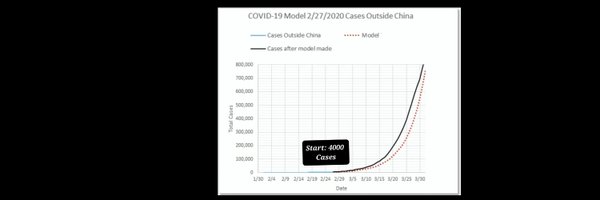
XBB.1.5 is a cumbersome name.
"US variant" seems almost deserved, since:
▶️Evolved in US
▶️Info actively suppressed by US authorities for until almost dominant
▶️Continued deflection from CDC and government officals to unfounded concern over "Variants from China"
27
202
739
Here is a list of people calling attention to JN.1 Pirola back in October, far before it appeared to be on any of the official health authorities' radar.
Thank you to all of these scientists, experts, and communicators.
15
157
738
Wastewater numbers from are now rising in all regions.⬆️
Almost double where they were in mid June.
From these data, my case estimates:
🔸365,000 new cases/day⬆️
🔸1 in every 900 people were infected today
🔸1 in every 90 people currently infected.
25
338
730

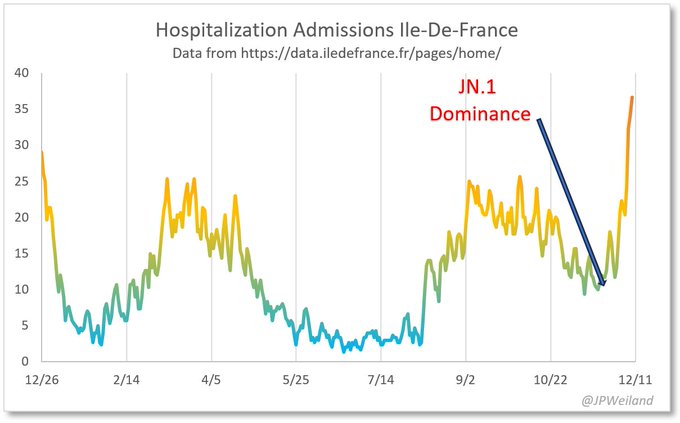
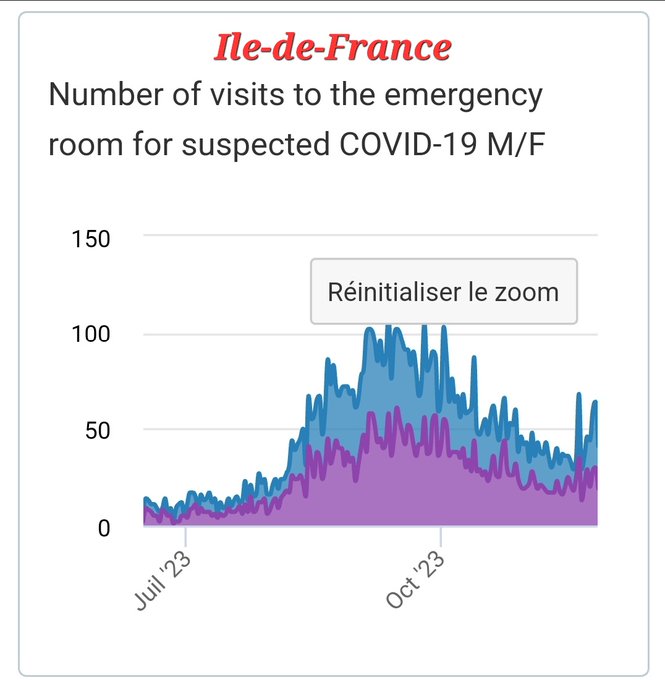
Ile-de-France has released their newest week of hospital admissions data. A sharp increase was seen just after Pirola (JN.1) took dominance. This was predicted.
A much sharper increase than any wave in 2023.
Dataset only goes back to 12/26/2022.
20
276
713
This is JN.1 saying "What other variants?" in Europe, as it skates right by them.
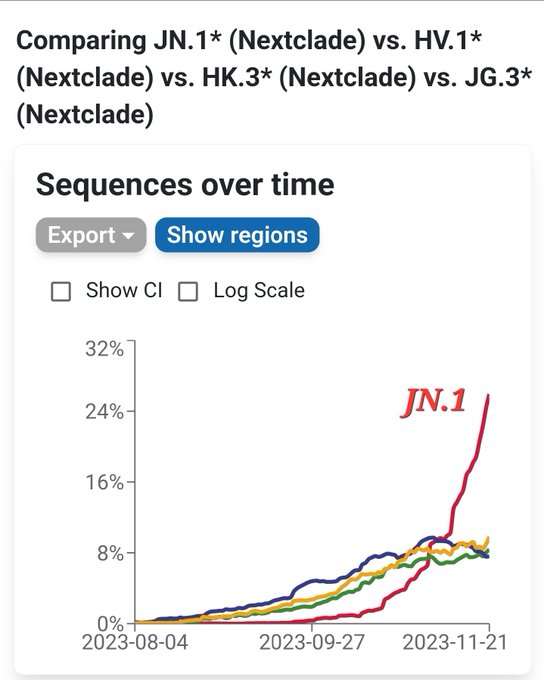
14
240
700
@DrEricDing
@paulinechen
@taraparkerpope
It's amazing how much of your "just fear mongering" has proven to be spot on accurate. Thank you for all that you have done over the last two years.
8
20
683
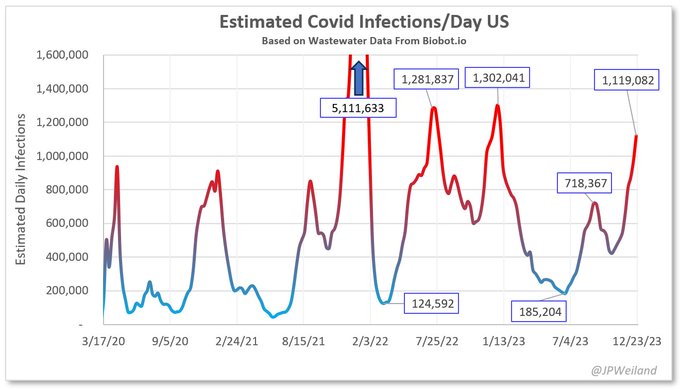
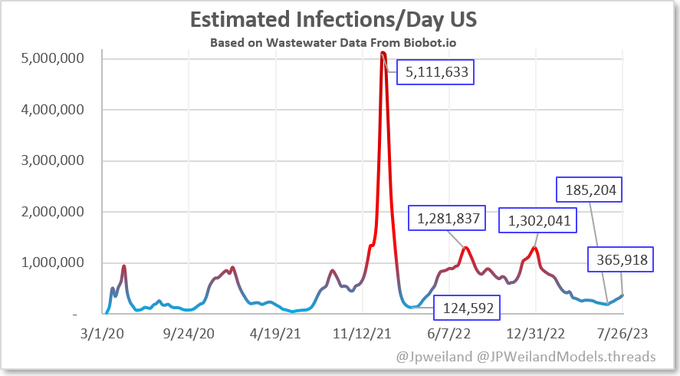
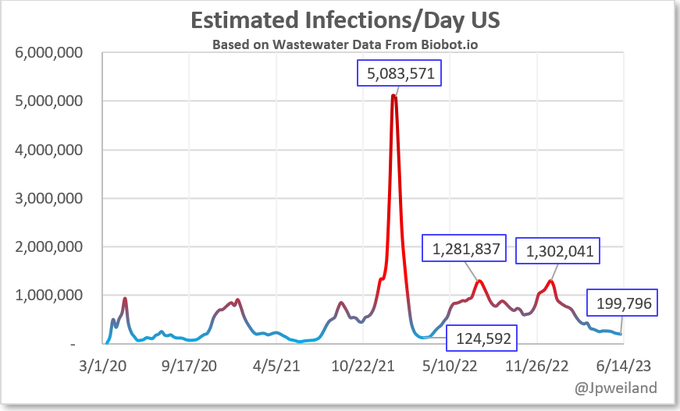
I used Biobot's wastewater data to attempt to estimate true cases per day. Here are the results:
Current estimate: 200k per day
~1 in every 1650 people were infected today
46
178
694
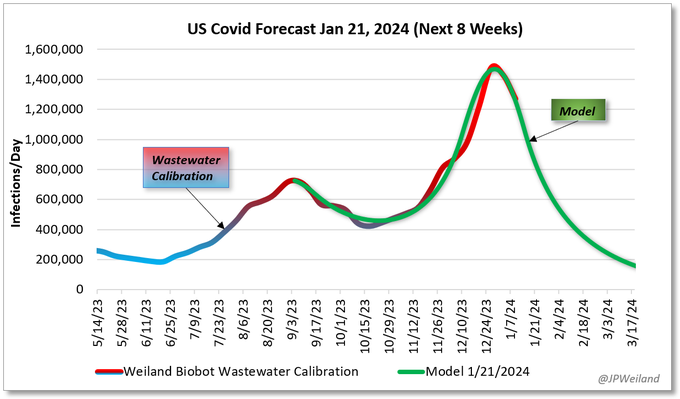
🔸️New 8 Week US Forecast:
New infections will remain very high for the next few weeks, but are forecasted to decrease quickly for the rest of the winter.
None of the JN.1 derivatives so far appear particularly problematic.
25
181
695
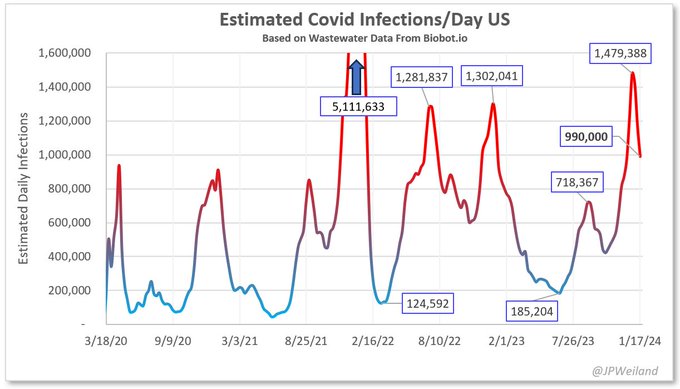
Biobot update 1/23/2024:
Wastewater receding quickly off of the peak, though still near 1 million new infections a day in America. Decline will continue.
🔸990,000 new infections/day
🔸1 in every 330 became infected today
🔸1 in every 33 people currently infected
12
194
681
Biobot has now (unexpectedly) updated too, confirming 2nd highest peak wastewater readings. Right at the peak of the Nov 30th forecast.
Their numbers suggest:
🔸️1,480,000 new infections/day
🔸️1 in 22 currently infected
20
250
678
Mistakes are being made, intentionally or unintentionally, at a critical time for H5N1. Let's choose to not repeat the same mistakes as late 2019/early 2020.

Update:
Seems the
@USDA
@USDA_APHIS
chose not to share sequence data with the global
@GISAID
system where a vast majority of all global scientists have shared their data on influenza viruses since 2008.
In addition, they chose not to include critical metadata on timing and…
35
524
1K
7
173
680
Wow, quite the interview of Dr. Deborah Birx (remember her?) from
@ChrisCuomo
discussing the failures of the early response, long covid, and complications from even mild infections. Worth a watch

26
212
666
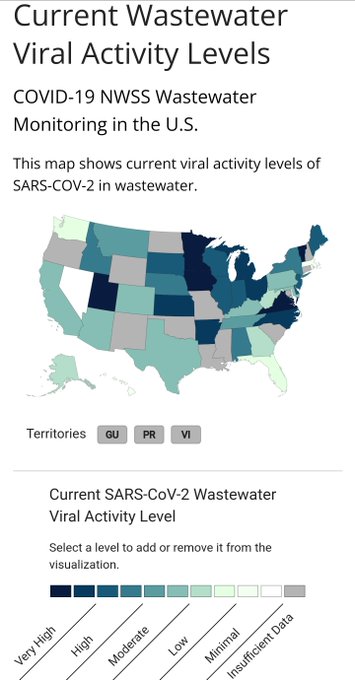
What a fantastic upgrade the
@CDCDirector
and
@CDCgov
have made!
Wastewater tracking is much more accessible now.
Welcomed changes!!
31
155
637
@CDCDirector
Strongest variant since the first Omicron started right here and will be dominant soon.
With all due respect, why the heck are you talking about China and not homegrown XBB.1.5??
10
89
622
@EricTopol
It's a sad state when "we have the tools" turns into the wealthy have the tools. This should be free to the public like the flu shot. Thank you for calling this out.
0
72
625
Wow. This is widespread.

Researchers collected 150 commercial milk products from around the Midwest, and genetic testing found H5N1 viral RNA in 58 samples.
8
163
274
20
181
633
Counterintuitively, in some respects, sharp, high peaks can make it easier to avoid infection. If you button up a bit tighter now and make through to mid-late January, the risk of infection from all activities will be a lot less in the spring.
21
97
612
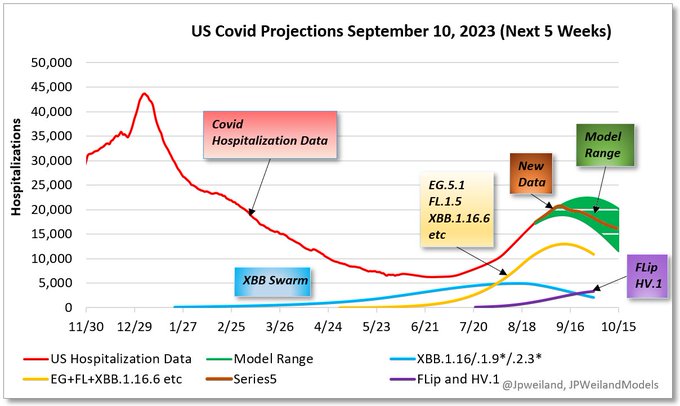
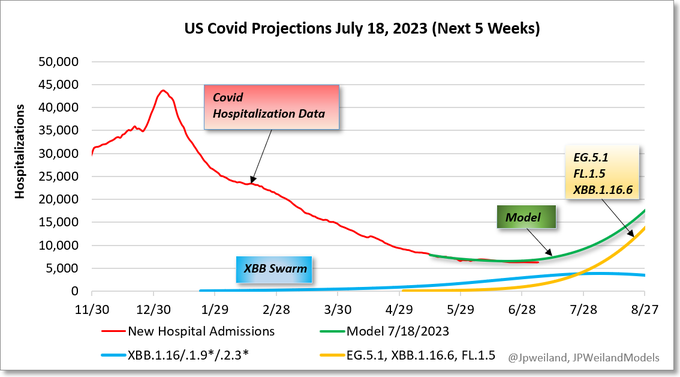
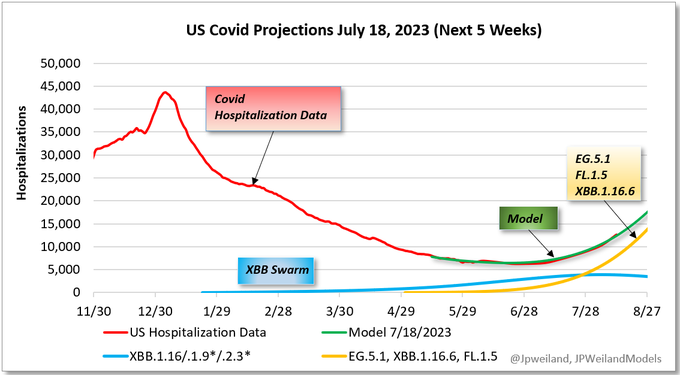
Model for next 5 weeks:
Anticipating increases into August, driven by EG.5.1, FL.1.5, and XBB.1.16.6.
Each of these have advantage over XBB.1.16, XBB.2.3 etc.
The lack of cases for the last 4 months is expected to have increased the number of people susceptable to infection.
24
216
607
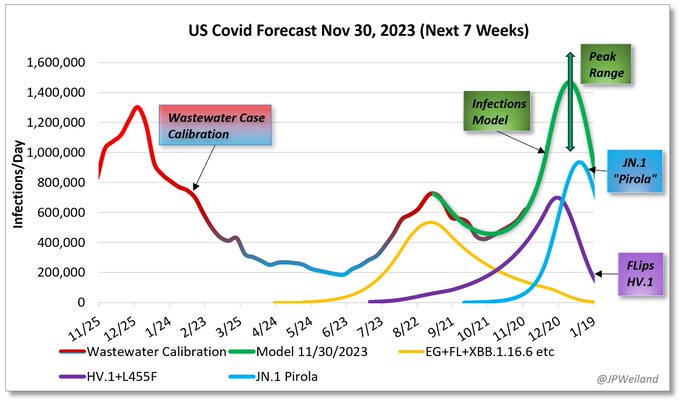
🔹️Preliminary winter forecast is out. As JN.1 Pirola grows, it is forecast to push numbers up quickly in the coming weeks.
There is a decent amount of uncertainty on how far JN.1 will penetrate our population's resistances, so a reasonable range for the peak is provided.
39
203
606
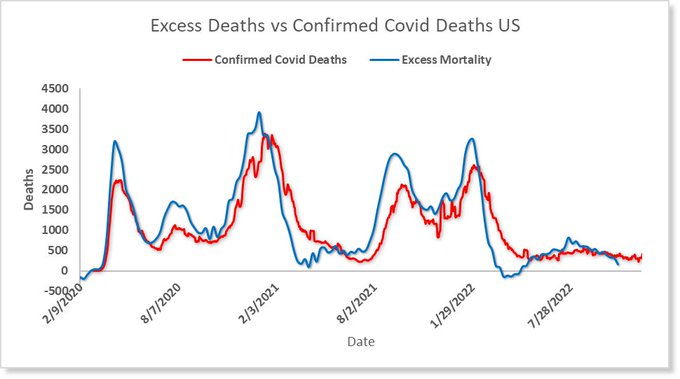
There is a doctor making headlines claiming (without any data at all) that we are vastly overcounting Covid deaths.
Excess death data would like a word.
26
149
589
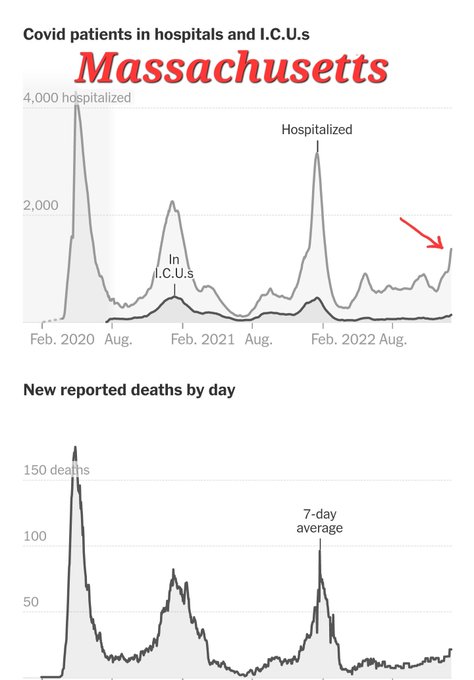
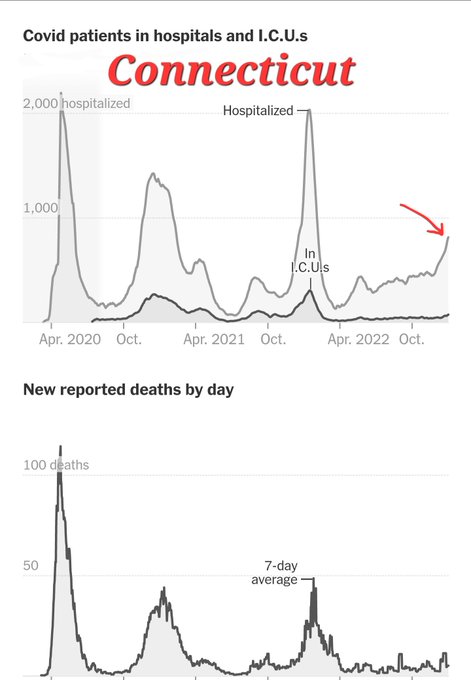
We are seeing hospitalizations rise quickly in Northeastern states since XBB.1.5 became dominant less than 2 weeks ago
Paying attention to hospitalizations is important, as it is a consistent measure of community spread levels past 2021. Case rates are pretty high in MA and CT
22
201
590
There was some (understandable) skepticism of my call that numbers have already peaked in the US.
Update from CDC's wastewater today supports that claim with additional data. Still have not needed an adjustment to the November model. Will update soon.
20
92
586
The silver lining is that once this wave recedes in January, I think we will be in for a fairly quiet early spring. There are not any variants right behind JN.1 that are on my radar.
That can always change, but as it looks now, JN.1 will be king for a while.
43
74
578
4 for 4 rebound infections from Paxlovid >10 days out
Joe Biden
Jill Biden
Anthony Fauci
Rochelle Walensky
How is that CDC recommended 5 day isolation period working out?
-The rest of us
9
131
572
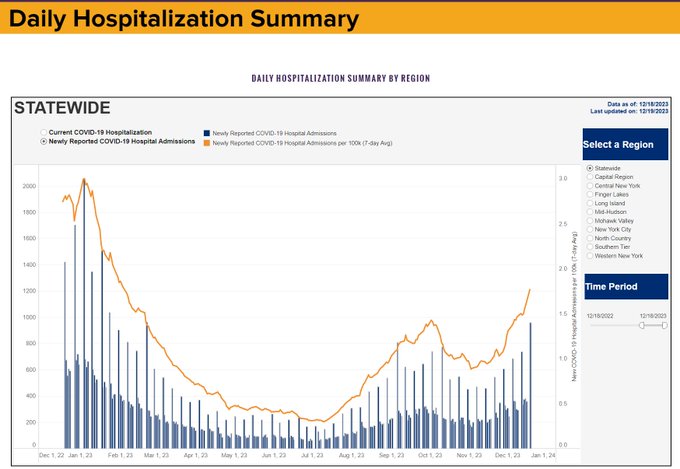
We've been watching New York to see what their new numbers look like. They're ahead of the rest of the US by a little more than a week on JN.1
Seeing the start of a spike in hospitalizations today.

👀Increase in newly reported
#COVID19
Hospitalizations, as JN.1* overtakes all the circulating lineages in
#NewYork
Source: |
@HealthNYGov
@nycHealthy
| *
#SARSCoV2
lineage BA.2.86.1.1;
#Pirola
group
5
151
327
19
194
577
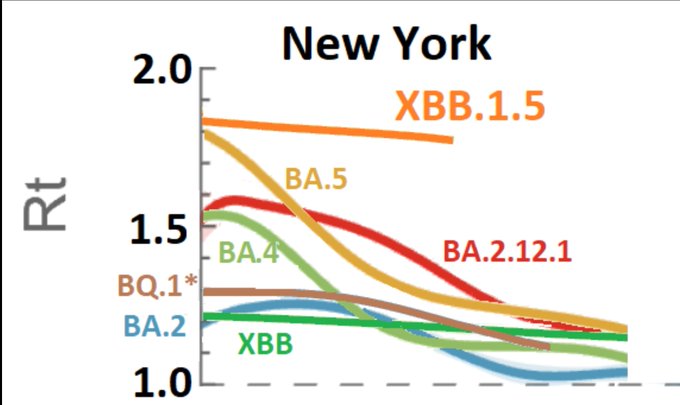
I overlaid some of
@trvrb
group's analysis of effective Reproductive Number over time since a variant first starts spreading.
XBB.1.5 appears faster and more sustained than ANY of the variants since Omicron's first wave last January.
Current Rt 1.6-1.8
19
283
560
What we really need is a full population demographic study of post infection disease burden comparing 2nd, 3rd, 4th+ infections.
Eventually most people will be in the 4+ infections boat, and we have almost 0 data on what the consequences will be.
38
102
569
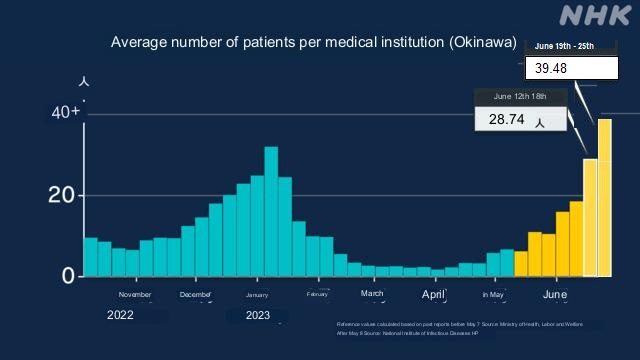
Okinawa is experiencing an unusual spike in hospitalizations..
We have almost 0 sequencing coming out of there.
It's so critical to keep timely global sequencing efforts going to get an early warning. 🧵

Japan, Okinawa: Covid hospitalizations surpass January peak.
We have updated this NHK graphic with the latest hospitalization data from Okinawa. It's clear that the current wave of Covid has now outstripped the January 2023 wave.
Original image:
6
232
360
8
252
563
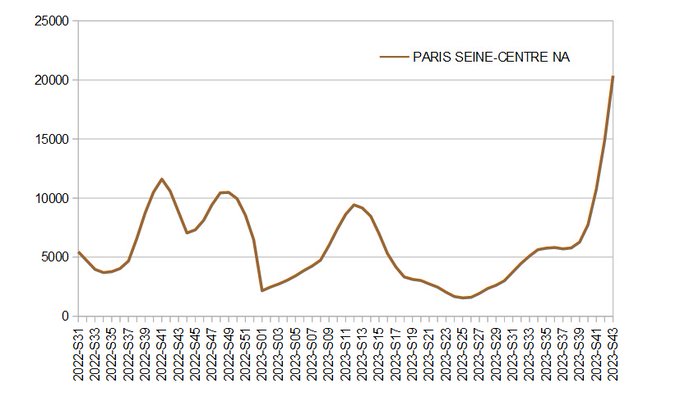
This is the current wastewater trend in Paris.
Based on this, it does look like the JN.1 sequencing was accurate, and JN.1 is dominant there now.
Pretty dramatic uptick of infections via the wastewater signal.

Concentration de SARS-CoV-2 dans les eaux usées de la station de Paris Seine-Centre : ~doublement en 2 semaines et record atteint depuis l'été 2022.
JN.1, ça a l'air de piquer...
8
89
153
17
194
562
A point of comparison here since 2022. The time it took a lineage family to grow from 0.1% to 50% globally:
🔸️EG.5 6.5 Months
🔸️XBB.1.5 3.5 Months
🔸️BA.2 2.5 Months
🔹️JN.1. 2.5 Months
🔸️BA.5 2.5 Months
🔸️BA.1. 1.25 Months
11
214
556
I find it concerning how many mammals HPAI H5N1 is learning to infect. Now dairy cows for the first time. A bunch of outbreaks reported in the past week, and some evidence of cow-cow transmission.
Texas, Kansas, Michigan, New Mexico, and Idaho so far.

21
188
560
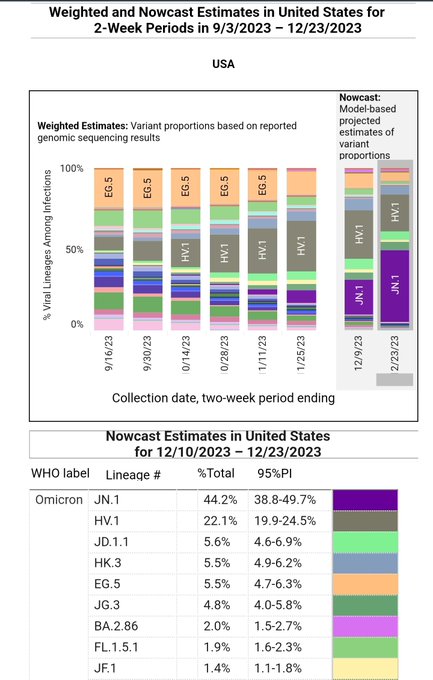
CDC sees it too.
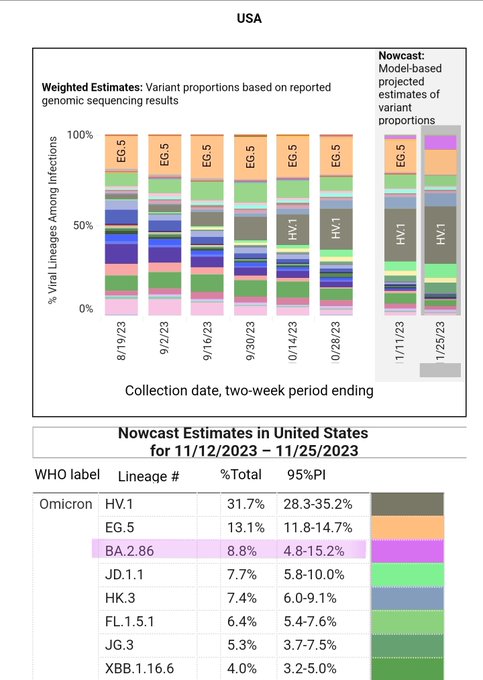
The JN.1 lineage is at 44% for their two week avg (projection).
That means the
@CDCgov
@CDCDirector
believe that JN.1 is dominant (>50%) already today.
29
182
547
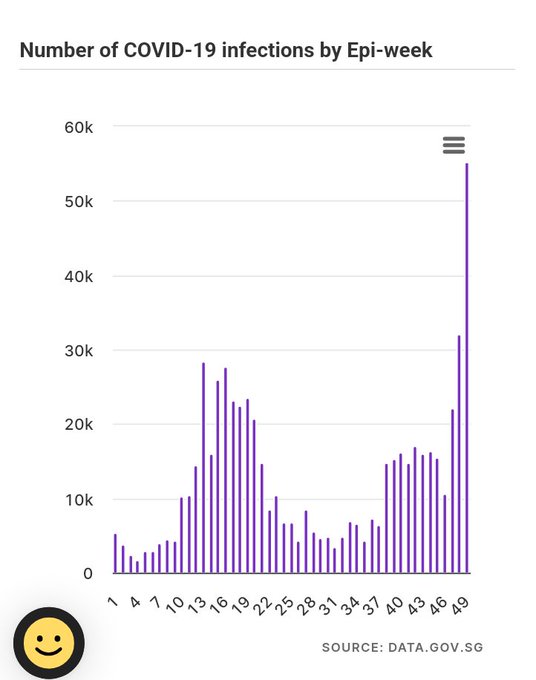
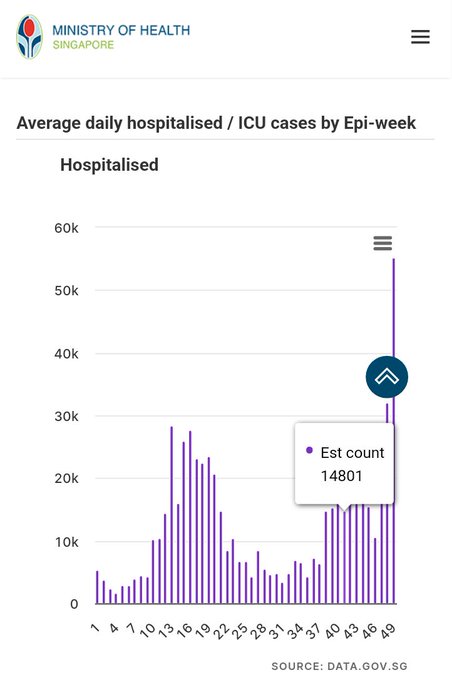
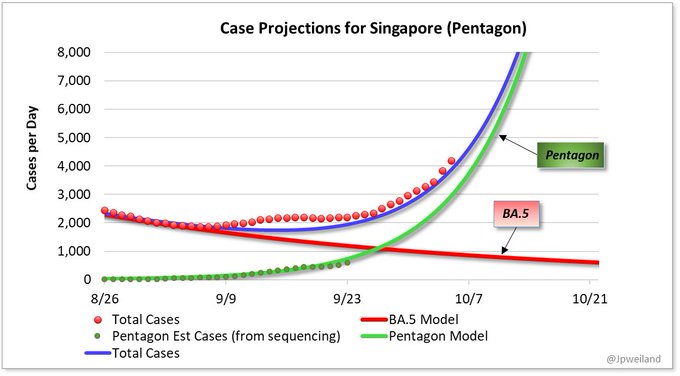
JN.1 Pirola reached dominance in week ~46 during a decline in hospitalizations in Singapore.
3 weeks later it's 500% as high.
Just another example of JN.1 power to change trajectories.
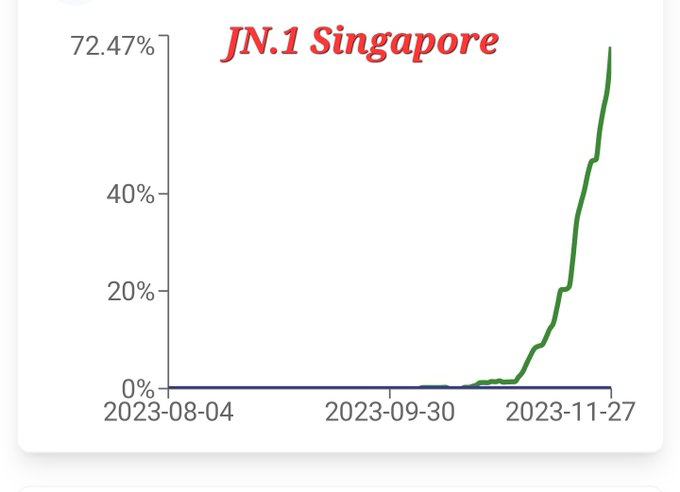

Ht
@nzm8qs
Singapore cases break 2023 high recorded during XBB.1+486P wave.
Cases near doubled in comparison to that time.
Hospitalizations following the same path
12
85
228
13
197
542
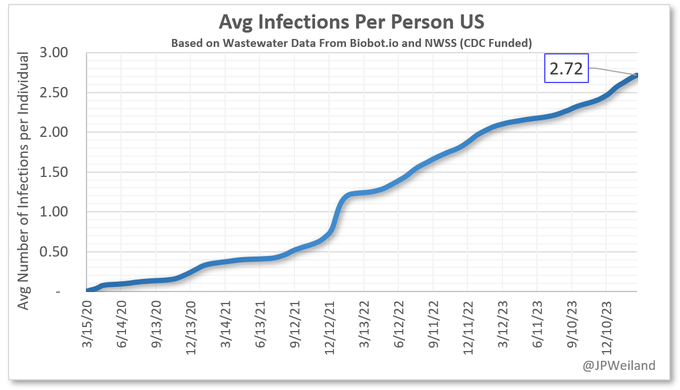
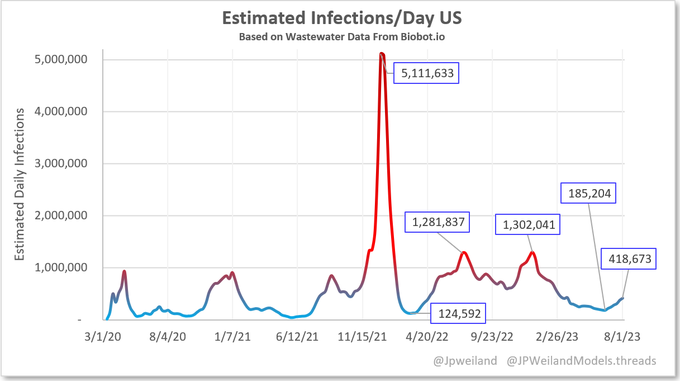
What does trend of total infections look like for the average American?
Since 2020, I estimate from WW calibration the average American has had Covid 2.7 times.
1/
20
179
550
@ashishkjha
I'll respectfully make a counter point here using this chart. In many, many instances, symptoms are improving after day 2. However ~all of them will be still be highly contagious at that point. Big difference in area under the curve:
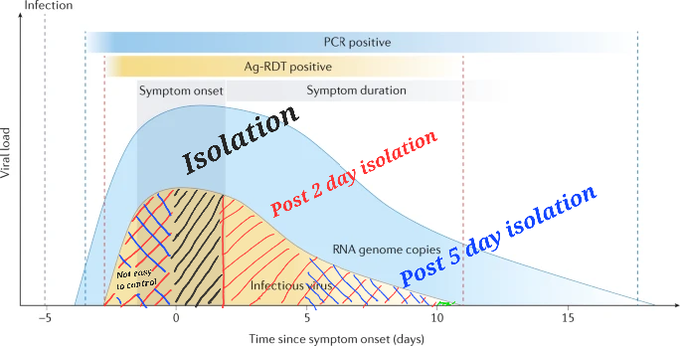

I'll respectfully disagree with my friend
@EricTopol
CDC does not have a "no isolation" guideline
Its guideline is to isolate until symptoms are clearly improving
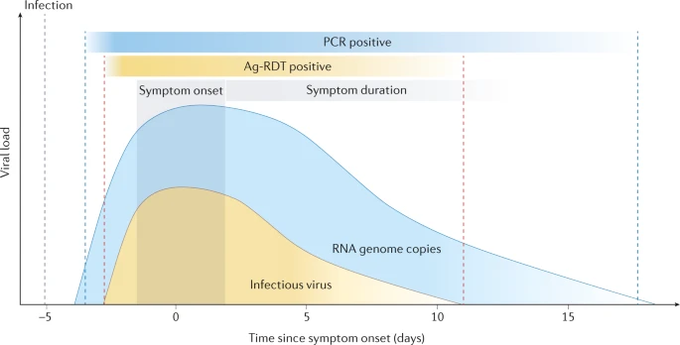
In the paper Eric cites, there is another useful graph
It shows that as symptoms abate, so does infectious virus
439
60
341
10
146
546
Singapore is the first country to see a wave due to the Pentagon Variants.
Rapid case increases in the last week almost certainly due to Pentagon (in this case XBB, BN.1, BM.1.1.1).
19
224
527
August 3rd update:
Daily infections continue to rise via wastewater, back to "medium" levels (relative to the Omicron Era, Dec 2021 on).
🔸419,000 new infections/day⬆️
🔸1 in every 790 people were infected today
🔸1 in every 79 people currently infected.
18
200
534
According to wastewater data from , US infections are the lowest they've been in over a year.
Out of the past 85 weeks, only 6 weeks had lower rates than today.
Enjoy the lul while it lasts!
30
121
528
JN.1 growth is real.
New big data dump from France and other countries.
I think this solidifies things, this is quite fast. The trend in the last 4 weeks is so tight that it's messing with the confidence intervals!
I still like a lower CI of ~100%.
15
161
527
BA.2.86 Pirola appears to have picked up an important escape mutation (S:L455S). May act similarly to FLip. First one found Sept 20 (Iceland) and now 4 total from 4 different countries.
Pirola is finding easy optimizations.

I just realized that there is already a BA.2.86.1 sublineage with a mutation in this spot (L455S). There are only 4 sequence (from 4 different countries), but I bet there will be many more. This is almost certainly a class-1 escape mutation. Last hurdle.
4/
7
101
551
14
178
527
There's a new study claiming no increased risk of new any type infection after covid infection. I don't have a strong opinion on either side of this argument at this point. Let's take an objective look at what this study actually shows (TLDR, it's poor):

16
137
520
⚠️ With the
@CDCgov
projections falling in line with my own and after additional data releases, BA.2.86* Pirola no longer looks to gain dominance in early January.
It now has a >50% chance of being dominant before Christmas, which may significantly elevate the holiday wave.
17
178
509
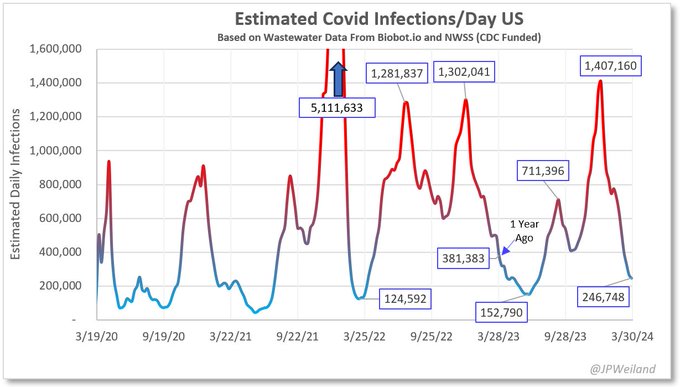
March 22nd update:
Infection levels continue to decline rapidly. A year ago, both wastewater levels AND positivity rate were 47% higher than they are today.
🔸340,000 new infections/day
🔸1 in every 980 became infected today
🔸1 in every 98 people currently infected
15
96
511
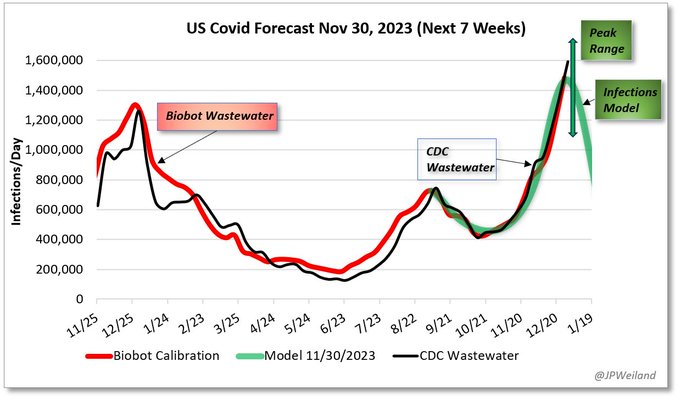
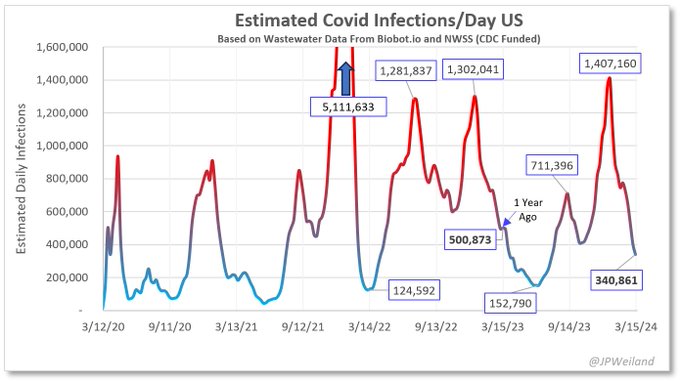
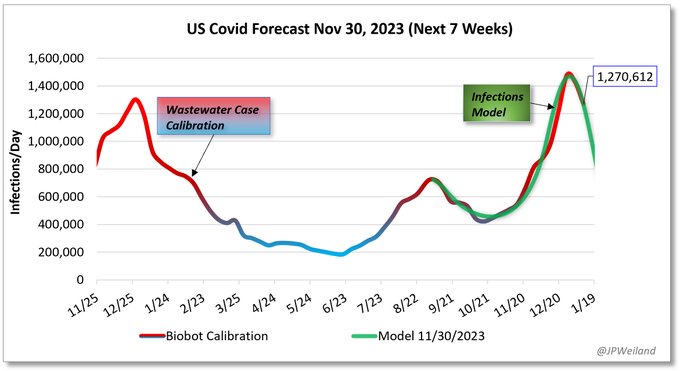
Wastewater update:
Biobot had adjusted their last two weekly estimates down a bit. My Nov. 30th model missed the peak number by 0.6% 😅. Numbers still very high but dropping.
🔸1,270,000 new infections/day
🔸1 in every 26 Americans currently infected
🔹️Preliminary winter forecast is out. As JN.1 Pirola grows, it is forecast to push numbers up quickly in the coming weeks.
There is a decent amount of uncertainty on how far JN.1 will penetrate our population's resistances, so a reasonable range for the peak is provided.
39
203
606
15
110
504
A flood of new BA.2.86 "Pirola" sequences found today. 13 total up to yesterday, 11 new today brings us to 24.
It's absolutely CRITICAL when these submissions are made to state how they were found. Random sampling or SGTF driven sequencing? This is important + has to be stated.
17
121
503
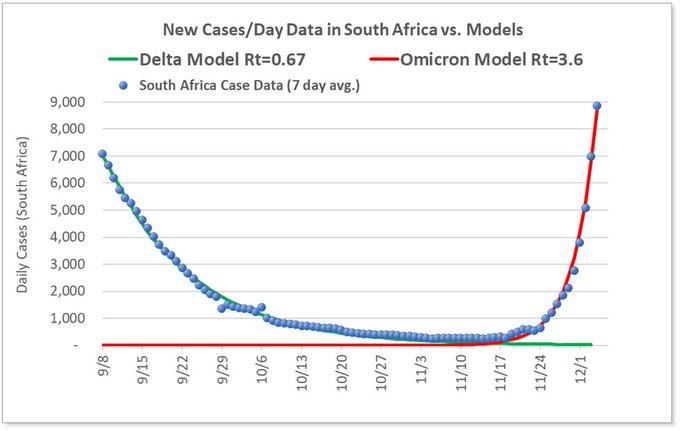
South African Omicron outbreak still outpacing 3.0 Rt model. Starting to look more like 3.6, which is a 5.5x advantage over Delta. Any changes in behavior in SA have not kicked in yet.
3.6 Rt model:
18
252
494
December 11th Update:
Biobot downgraded last weeks signal to 815k. WW still rising, though stuttering a bit this week, as we've seen in early Dec in past years.
🔸870,000 new infections/day
🔸1 in every 380 became infected today
🔸1 in every 38 people currently infected
11
162
496
Updated hospitalization data from the CDC is right smack on top of my model from over a month ago. Might be hard to see the red line.
This wave was fully predicted
I share models so people can know what's coming, like a weather forecast. It's better to know before it gets here.
Model for next 5 weeks:
Anticipating increases into August, driven by EG.5.1, FL.1.5, and XBB.1.16.6.
Each of these have advantage over XBB.1.16, XBB.2.3 etc.
The lack of cases for the last 4 months is expected to have increased the number of people susceptable to infection.
24
216
607
17
139
495
April 5th update:
Now at low transmission levels, slight decline from last week. Still some time until JN.1 with FLiRT take hold.
🔸245,000 new infections/day
🔸~2.76 avg total infections per capita across the US
🔸1 in every 135 people currently infected
16
119
496
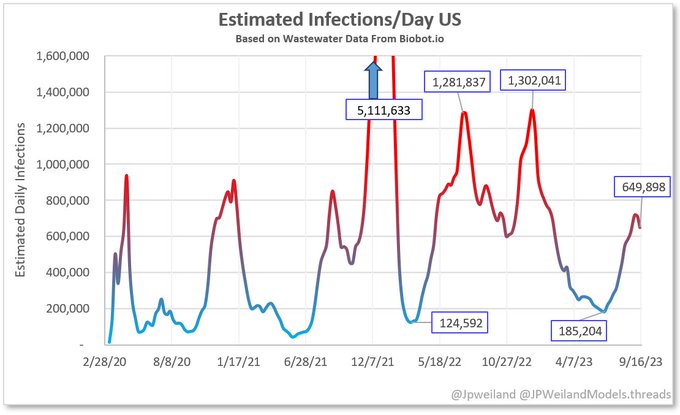
September 14th US update:
Community spread of Covid still "high", but decreasing after the peak. Current estimates:
🔸650,000 new infections/day
🔸1 in every 510 new people were infected today
🔸1 in every 51 people currently infected
28
132
489
This is another alert to
@WHO
@mvankerkhove
@CDCDirector
@CDCDirector
@nirav_uscdc
@ScottGottliebMD
@EricTopol
that JN.1 (BA.2.86.1 + escape mutation L455S) appears to be growing very quickly. 5 seq had been discovered just over two weeks ago, as of yesterday the count is >40.
9
154
487
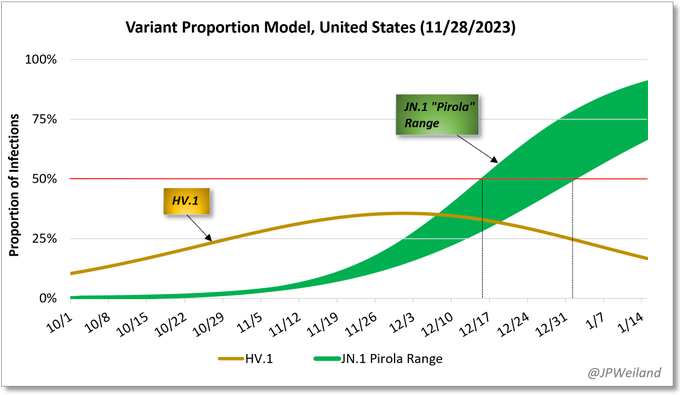
JN.1 Pirola growth forecast for the US:
Growth of Pirola is already starting to push up numbers across the US. It should pass HV.1 in mid December and pass all other variants combined somewhere between mid to the end of Decmeber.
The earlier, the higher the wave.
17
163
483
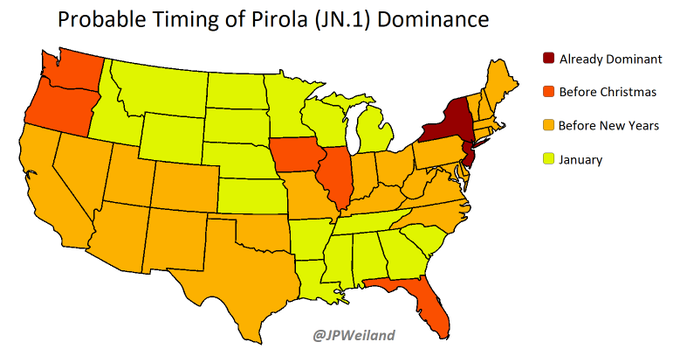
Timing for Pirola (JN.1) dominance in the US is going to vary a lot depending on location. Some states lack data and have been grouped in with surrounding states.
Earlier dominance will probably lead to faster increases over the holidays.
No data for Hawaii, Alaska.
17
182
484
April 19th update:
Infection rates still declining to low numbers. We will find out by early May if the FLiRT mutations are able to reverse the trend.
🔸200,000 new infections/day
🔸~2.77 avg total infections per capita across the US
🔸1 in every 164 people currently infected
9
100
487
JN.1 Pirola with "FLiRT" (F456L and R346T) appears to be growing fairly quickly in the UK, where it has been found the most frequently.
These are new mutations to Pirola, but have evolved in prior XBBs.
+75%/wk looks like a reasonable early estimate to me.
11
154
479
Pirola has taken clear dominance worldwide, quickly displacing the XBB* lineages. It's going to be an uphill climb for XBB* to evolve to compete with this now-dominant new lineage.
10
147
475
Emergency room visits for Covid seeing a sharp increase in Ile-de-France, where Pirola (JN.1) has recently gained dominance.
We've been expecting this while we watched JN.1 grow.
6
167
471
November 27th Update:
Wastewater numbers increasing quickly, approaching fall peak.
With JN.1 Pirola ⬆️⬆️ in mid Dec, the numbers may elevate significantly.
🔸620,000 new infections/day
🔸1 in every 530 new people were infected today
🔸1 in every 53 people currently infected
11
193
464
Let's not do this again, shall we?

Long new BA.2 saltation sequence in South Africa spotted by
@BorisUitham
. See the Github issue for details.
18
106
350
20
82
468
April 26th update:
Infection rates still decreasing, down 10% this week. Pirola with FLiRT mutations now at ~40%.
🔸180,000 new infections/day
🔸~2.78 avg total infections per capita across the US
🔸1 in every 185 people currently infected
13
95
474
Pretty interesting, BA.2.86 "Pirola" has increased infectivity toward CaLu-3 cells than any Omicron. (CaLu-3 are cancerous lung cells that are used for a lot of testing)
I don't know how this translates to typical lung tissue, but not the result I was hoping for.
16
134
463
March 8th Update:
Strong declines in infection numbers this week in all regions. The South had the largest drop after stubbornly high numbers in Feb. Biobot/NWSS:
🔸520,000 new infections/day
🔸1 in every 640 became infected today
🔸1 in every 64 people currently infected
10
111
461
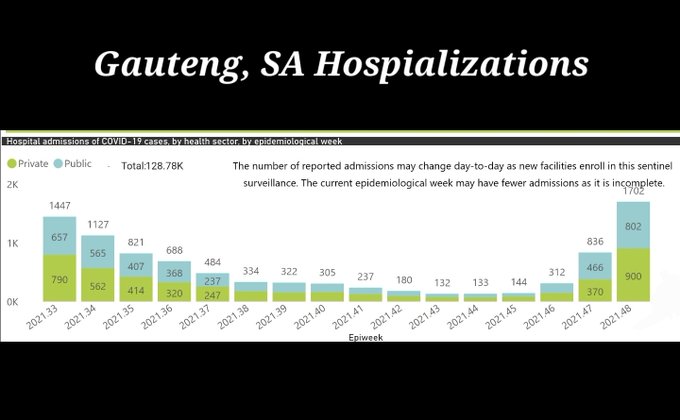
Hospitalizations in Gauteng providence, South Africa (epicenter of Omicron), continue to rise rapidly. Not encouraging data for the "more mild" claim.
32
194
446