
Chenxin Li, PhD (@chenxinli2.bsky.social)
@ChenxinLi2
Followers
10,410
Following
3,044
Media
1,528
Statuses
12,493
Li | Assistant Research Scientist @ UGA | Decoding how (epi)genome, and development shape (specialized) metabolism | Also post data visualization
Joined July 2019
Don't wanna be here?
Send us removal request.
Explore trending content on Musk Viewer
Arsenal
• 616892 Tweets
ارسنال
• 235221 Tweets
Haaland
• 126266 Tweets
Lamine
• 108996 Tweets
#MCIARS
• 98429 Tweets
Giants
• 94936 Tweets
Michael Oliver
• 90951 Tweets
Arteta
• 86494 Tweets
Eagles
• 85677 Tweets
Trossard
• 80201 Tweets
Walker
• 74002 Tweets
Bears
• 71808 Tweets
Doku
• 69834 Tweets
Man City
• 68775 Tweets
Saints
• 68423 Tweets
Ter Stegen
• 65360 Tweets
Rodri
• 62570 Tweets
Steelers
• 59806 Tweets
Villarreal
• 53487 Tweets
Shaun
• 47898 Tweets
Browns
• 39383 Tweets
Vikings
• 38808 Tweets
Packers
• 33287 Tweets
Titans
• 30292 Tweets
Chargers
• 29270 Tweets
Jalen
• 27645 Tweets
Texans
• 27294 Tweets
Colts
• 26504 Tweets
Broncos
• 25639 Tweets
#OLOM
• 23854 Tweets
Sirianni
• 22629 Tweets
Tayfur
• 20785 Tweets
Saquon
• 15847 Tweets
Caleb Williams
• 15669 Tweets
Justin Fields
• 14505 Tweets
Herbert
• 14358 Tweets
Balerdi
• 14354 Tweets
Malik Willis
• 14011 Tweets
Semih
• 13032 Tweets
Sam Darnold
• 11294 Tweets
Will Levis
• 11032 Tweets
Bucs
• 10380 Tweets
Last Seen Profiles


Pinned Tweet

Look what came in the mail today

20
2
368
Weird microbe on a pasta sauce jar lid! My student returned from her trip and found this purple pink ish flower looking thing in her fridge. Any idea what this might be?
@ContamClub

306
449
6K
Not enough people know about
Open source vector graphics. Free alternatives to BioRender.

6
562
2K
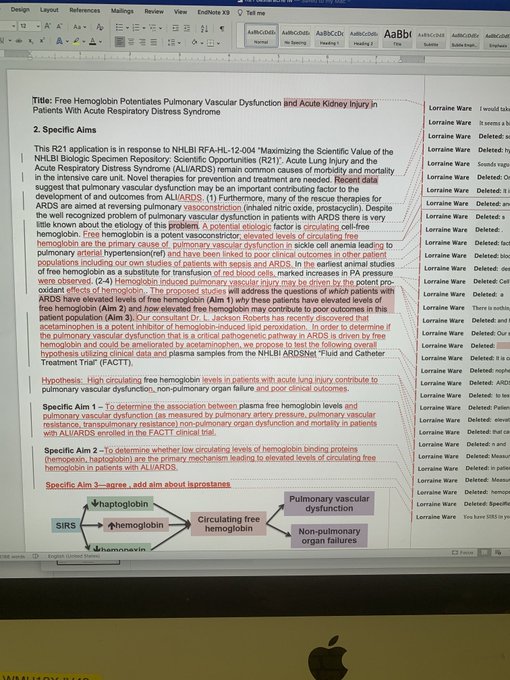
I am not sure. If I were a PI I would try to preserve my mentee’s writing as much as possible-light edits only. If substantial changes are needed, I leave a comment instead. This is their writing, and they should express their individuality, not mine.

If I could give aspiring scientists and trainees one piece of advice it would be this: Find a mentor who cares enough about you to do this 👇
#Mentorship
#AcademicChatter
#PhysicianScientist
#CareerAdvice
211
729
6K
112
111
2K
I have a YouTube playlist for molecular biology for my undergrad interns in the lab. I might as well share it here.

18
295
2K
Returned to the lab bench and found out there is mold? growing in my 10% Triton. Dude, you are living in literal detergent.
81
74
2K
Yesterday we had a Zoom lunch w/ a former PhD student of the lab. He said he has been using my GitHub repo to brush up on his R skills. "It's well put together" he said. I'm so glad to hear that! I wrote these when I was slacking off in the lab. 😂

8
270
1K
Today I finished teaching "quick data vis" to 1st year grad students the 2nd time! Lessons/scripts + example data available:
Online R learning repository main page (basic statistics focus):
Quick data vis page (data vis focus):

10
286
1K
Is it a general phenomenon that PhD students become petty, salty, and jaded by year 5-6? Asking for a friend.
147
43
1K
Update: The package has been dropped off at UPS. I used a spatula to transfer the purple stuff to a 50 mL conical tube (+ a bit of sauce to keep it alive), packed in a styrofoam box w/ 2 ice packs, then into a cardboard box. Should be delivered to Dr.
@ImperfectFunGuy
Monday!

22
19
1K
Super nice when people asked me if they can use my repository for teaching. I always say yes.
Friends don’t let friends make bad graphs repository:

14
151
1K
I remember someone from a highly accomplished lab told me they would leave out 1-2 key pieces of data/experiment for their 1st manuscript draft, so that reviewers have low hanging fruit to pick instead of trying to nitpick. While they wait for reviews, they do those experiments.
36
72
1K
I learned how to use ggtreeExtra this week for phylogeny visualization and annotation.
ggtree:
ggtreeExtra:

8
199
1K
Garlic genome is almost 17Gb?! Oh wow.
I was prepping dinner and chopping some garlic and went like “I wonder what’s the genome size?”

24
126
1K
You can make an entire figure in R using the patchwork package. A tutorial is available at my GitHub to generate this exact figure (). It covers controlling layout, relative heights/widths of panels, hierarchical assembly, and position of letter labels.

17
203
1K
Does grad school make people depressed or do depressed people tend to apply for grad school?
25
50
1K
A new tutorial on how to reorder rows & columns of a heatmap has been added to my "Friends don't let friends make bad graphs" repository.
Link to tutorial:
Link to "Friends don't let friends make bad graphs":

3
191
1K
What to use my scripts for gene co-expression analysis or generate nice graphics, but no experience with R? Don't worry, I have you covered! I have separate "Online_R_learning" tutorial on GitHub. It has 14 lessons, but really just the first 5 will get you a long way.

11
215
1K
The wet lab scientists think I am a bioinformatician. The bioinformaticians think I am a wet lab scientist. But I am fundamentally just a grapher. People hand me data and I make pretty graphs for them and help them interpret their results.
21
38
1K
This Fall I'll be teaching "quick data visualization" as part of a 1st year grad student seminar again for PBGG at UGA. The graphical abstract has 7 sections, but an 8th section on figure assembly has been added as well.
Contents available on GitHub:

14
200
1K
Telomere

18
68
881
Sloppy is good. If you get reliable results with sloppy execution, it means your method is robust and tolerant to errors. Precision is overrated.


15
77
796
Today I start teaching the "quick data vis" module to 1st year graduate students. This is my 2nd time teaching it.
GitHub:

5
128
753
If you make all the panels in R, you can actually make the entire figure in R with the patchwork package ().

11
117
754
"We are looking for a motivated individual to fill this postdoc position." Actually, nowadays if someone wants to be a postdoc, they are already very motivated, okay?
16
45
737
Gonna try out this gganimate package ()
Not really compatible with publications but would be great for presentations. Reminds me of Hans Rosling's presentations.
9
69
732
I made a new tutorial: "Simple Tidy GeneCoEx", a simple gene co-expression analyses workflow powered by tidyverse and graph analyses. Link:
Also graphics generated from an example dataset:


15
159
730
Just found out there has been massive update(s) at Bioicons! () Free vector graphics for biology, now include extension to Inkscape and online drawing user interface. Highly recommend!

7
181
708
Here is a comparison between Qubit and nanodrop for 39 total RNA samples (from petal tissues).

32
79
699
I used to like Times New Roman 12, but now I really like Arial 11 for writing.
For figures I really like Helvetica, and for slides I used to like Calibri, but now I really like Aptos.
55
53
690
Shameless plug: I wrote a R tutorial (for my undergrad interns at the time). It covers basic tidyverse (data wrangling & visualization), + basic applied stats (all sort of ANOVA/regression). Math kept to minimum, focuses on interpretation & execution in R.
4
157
671
NIH proposes upping postdoc salary to 70k/year.
People: This will lead to less postdocs!
Me: Didn't you see how many labs are struggling to hire a postdoc? Very few PhD students are even looking to be a postdoc. It's gonna be okay. Chill.
25
36
621
Heatmap can be the worst data visualization if you aren't doing it right. For example, reordering/grouping rows & columns gives a completely different look to a heatmap from the same data.
Tutorial for programmatically re-order rows/columns here:

5
77
572
Beware of bimodal distributions in box plots, for example group B in this example. I would suggest instead of box plots and violin plots, use bee swarm plots (shown on the right).


💡A boxplot can hide information. Show it with a violin plot instead?
(Trying to visually explain this 😛)
46
548
4K
10
100
593
Finished teaching my 1st course! I was co-instructor for 1st year grad student seminar "Grad School Life Skills", where I was allotted 7 weeks to cover data visualization. Course material are available online under my "Online_R_learning" repo:

3
114
589
Here's my version of "Friends don't let friends make bar plots" for showing means separation of replicated experiments.

9
189
573
Friends don't let friends forget to reorder stacked bar plots. Stacked bar plots are commonly used in research (e.g., to visualize admixture analysis). It can get messy! After reordering the bars, wow, it really made a difference, don't you think?
Link:

5
79
570
Hello new followers! You are probably here for Purple Pasta Sauce. I'm a plant biologist studying medicinal plants. I look at their basic biology (genetic makeup, metabolism, development) and create biotech tools for them. Come for Purple Pasta Sauce and stay for plant science!


18
24
571
Another rendition on "friends don't let friends make bar plot", or at least check a couple things before settling down on bar plots.
In this example, two groups have similar means and standard deviations, but quite different distributions. Are they really "the same"?

6
97
559
Our plant nuclei isolation protocol is online! Frantically chopping on ice releases nuclei from cells, and a key factor for nuclei integrity is the detergent concentration. We tested & optimized the protocol for a range of species, including major crops.


17
127
529
Here is "friends don't let friends make heatmap without checking outliers". This applies to using colors to represent numeric data in general. Having outliers in heatmap can really change how we perceive & interpret the visualization.

6
60
518
Don’t join a lab that emphasizes “passion” or “motivation” because they are likely looking to make you work more hours. Instead, join a lab that emphasizes planning, prioritizing, and work-life balance.

As a trainee, you may often feel pressure to conform to this "passion"-driven lifestyle of putting work over health, relationships, and hobbies. I 100% respected my friend's hustle but it's also okay if you're like me - you can still do well and end up where you want to be!
3
35
680
11
71
511
OMG… Now I got stuff growing in my 10% Tween20. What’s with microbes growing in literal detergent? Should I try to isolate it (spread it on a plate with just agar, 10% Tween20 and a pinch of yeast extract)?

69
11
502
Me: talk about existential dread being a postdoc.
People: it doesn't end after you become a PI.
Me: Thanks. But think about it this way. Postdocs want to be PI, but no PI wants to come back and be postdoc again. Obvious one is better than the other. LMAO. 🤷♀️
39
19
492
For my new followers: in addition to plant biology, I also create & maintain data visualization contents on GitHub, such as "Friends don't let friends make bad graphs" () and "online R learning" (). Check out my repo if interested.
2
96
495
My "Friends don't let friends make bad graphs" repository has reached 1000+ stars on GitHub! I can't believe it! Thanks everyone for the interest and support. Gonna add this to my CV. 😂😂😂

8
75
488
First author here. I have a step-by-step tutorial for this Tidyverse-based gene coexpression workflow on GitHub:


Discovering new insights in genetics! 🧬 "Simple Tidy GeneCoEx" is a customizable gene co-expression analysis tool that uses R programming and igraph functions to detect clusters of genes with similar expression patterns.
Read
#OA
in
@plantgenome
👉

1
17
72
10
94
472
My Online_R_learning tutorial got to 200 stars today! (It includes the "quick data vis" sub-module, which I think most of the new stars are for.)

2
74
475
Same gradient setup, different species. The density of chloroplast and nuclei are different across species.


8
26
466
Small milestone: Online_R_learning has reached 400 stars on GitHub!
My repositories have a much farther reach than my actual research:
Friends don't let friends make bad graphs: 3.8k stars
SimpleTidy GeneCoEx: 154 stars.

5
64
448
Preprint of our tidyverse+graph theory based gene coexpression analysis workflow is online! Tidyverse functions produce nodes & edges, and graph based clustering (Leiden) detects tight gene coexpression modules.
Tutorial:

4
105
444
Visiting Texas A&M for an on-site interview in the biochem department. Wish me luck!!!
34
2
426
People warned me not to share ideas too openly on Twitter/at conferences, because I might get scooped. They are probably right, but I also specialize in high-risk low-reward project ideas, so really no sane person would take my ideas.
9
8
422
What are your lab culture shock experience? In my PhD lab, trainee(s) write the entirely of the paper, and the PI approves it. I.e., trainees generates >99% of the text. I was quite shocked to know that in many labs the PI generates >99% of the text in publications.
37
14
421
Some PIs are rude. I had this experience multiple times at conferences. I was chatting with X, and prof Y came along, interrupted our conversation, starting to talk to X as if I wasn't there. Dude, how hard is it to at least say "sorry, I need to talk to X"?
21
8
420
In case anyone is interested, I also have ggtraces, a ggplot compatible tool for visualizing line traces (e.g., chromatograms), which aligns line graphs along a parallelogram. A key feature is adjustable perspectives between side view & top view. GitHub:

6
57
378
You can never be too experienced to put your colonies in the wrong antibiotics

10
11
373
"Friends Don't Let Friends Make Bad Graphs" repository.


5
49
371
I was mentally prepared for this 11-kb PCR to not work. But it did. From let to right temperature gradient of annealing temperature from 62 to 72.

15
12
359
Graphical abstract for my new "Quick data vis" sub-repository within "Online_R_learning". Content still under construction. First 4 lessons already completed. Stay tuned.

3
74
350
I have been upgraded to the rank of Assistant Research Scientist in the Department of Crop & Soil Sciences at University of Georgia. As a non-tenure-track research faculty, my new title will allow me to submit grants as the PI.
26
7
349
Recombinant protein purification simplified to passing the culture through a 0.45 um filter. Incredible stuff.
From:

0
61
348
Bad news: Reviewer
#2
would not accept the manuscript no matter what even though Reviewers 1&3 has recommended its publication.
Good news: Friends don't let friends make bad graphs have 500+ stars!

8
48
334
Tm calculators & optimal annealing temperatures for PCR is a myth (for the most part). Each set of 8 is a temperature gradient of annealing temp ranging from 55-70C. As you can see all tested temperatures look the same.

32
20
316
Say goodbye to VennDiagram and UpsetR...Customized upset plots are pretty and clear. Upper left: total set sizes (geom_bar); upper right: legend (get_legend() from cowplot ; lower left: colored matrix showing intersections (geom_tile); lower right: intersection sizes (geom_bar).

9
85
319
One of the biggest challenges of being a postdoc is I never know if I have done enough. 1/🧵
16
13
302
All 7 lessons of "Quick data vis" have been prepared and uploaded.
You can download the repository, follow the text in the R scripts, and run them as you read.
Or you can browse the lesson as html online in the Lessons folder on Github.

1
56
287
People say the nanodrop is a random number generator, but if you think about it...Every instrument is a random number generator, each with a different underlying distribution that we randomly sample from.
18
14
286
Helping my coworker w/ some gene co-expression analysis. Each row is a co-expression module (group of gene w/ similar expression pattern). Each column is a tissue.
A tutorial to do this kind of analysis using tidyverse:
Paper:

4
45
284

A stable release of ggpathway, a ggplot compatible pathway visualizer, is live on GitHub and has been pushed to Zenodo.
GitHub:
Feature requests and feedback welcome.


4
50
271
Funny situation: two plasmids from Addgene, total $170 ($85 each), not counting shipping.
Just synthesizing the pieces that I need from Twist: 400-bp piece and 1000-bp piece, add up to about $100.
I might just order synthesis.
18
7
274
My account could be suspended from posting this. Figure from:

6
39
265
Sometimes I wish more postdocs are on Twitter. Last cycle I applied to 15 TT positions and got 0 interviews. Obviously my CV was way too weak. But I am curious who got the job, because the successful candidates would have announced it on their Twitter.
21
11
264
The problem w/ UMAP edgelords is the disregard for known biology. A simple exercise is take a few experimentally validated cell type specific genes (there are many), and ask how often do cells expressing the same cell type determinant 'happen to' be close together on a UMAP.

16
24
261
Just talked with a good friend who is finishing up his PhD.
Me: “is your professor trying to keep you for another paper?”
Friend: “no, but I want to finish another paper or at least a preprint. Because if I leave it unfinished, he won’t bother to publish it.”
Wow. 🥲🤯😑
17
11
262
I think GitHub repositories should count towards scholarly products or impacts or whatnot. I am not going to try to publish my "Friends don't let friends make bad graphs" repo, but geez, it has like 220 stars as of today.
8
37
258
Plant transformation is going to be the biggest bottleneck for plant synthetic biology. All these exciting gene circuits are demonstrated in bacteria or Arabidopsis or transient expression. I’m surprised funding agencies haven’t thrown more money into plant transformation.
18
22
253
[Shit post warning]
.
.
.
.
.
.
I am quite disappointed by how people cheered Texas A&M for removing DEI statements in hiring. These people include plant scientists that I know. A thread
🧵1/n.
9
42
243
How does your lab name your freezers? We named ours after organelles.


32
11
239
Happy to announce that our paper on single cell omics (RNA + metabolites) for medicinal plant Catharanthus is officially online. This is a fruitful collaboration between
@OConnor_lab
&
@TheBuellLab
. This is my first paper for my postdoc work.

10
43
231
True wasabi plants are very rare, largely restricted to Japan. Wasabi condiment nowadays are made with horseradish and dyed green. I wonder if I can do cell culture with wasabi and make real wasabi sauce from culture. 🧐🧐🧐
15
16
231
Lab mate: "Li can you send me your protocols regarding cloning".
Me: "Eh, I do things out of muscle memory but I can type it out for you later or I can just show you how to do it."
13
13
228
Today I am officially upgraded to Dr Li. What a journey.

18
0
226
The documentations of many bioinformatics tools are so bare minimum (or even outright bad) that perhaps only the lab or person who wrote them can use the tool. Not gonna name names. But a GOOD model is bedtools, which has awesome documentations.

4
15
221
My Friends don't let friends make bad graphs repository has reached 6000+ stars!

0
21
221
Side note: instead of lab grown meat, I would like lab grown olive oil. Olive oil straight from olive cell culture. Olive oil supply independent of climate would be nice.
10
17
220
My "Friends don't let friends make bad graphs" series is somewhat complete. I think I covered the most common and egregious mistakes in graphing. Let me know if you see something egregious and I will add it to the series.
7
78
213
@ImperfectFunGuy
Update: the
#PurplePastaSauce
microbe has been delivered to the microbiologist Dr.
@ImperfectFunGuy
! "I'm excited" is an understatement.

2
2
213
UC grad students requested cost of living wage adjustment. UC denied the request: "it's not through a union".
This year, a majority of UC grad students + fellows petitioned to unionize.
UC did not recognize the majority: "trainees are not employees". What a clown show. 🤡🤡🤡

9
46
211
Having fun playing w/ gganimate ().
Watch 200 years of data from the Gapminder foundation ().
x = income (log10 scale)
y = child mortality / 1000 born
color = birth / woman
1 frame = 1 year
4
14
203
Double CRISPR knockout of pectin degrading enzymes improves tomato shelf-life while ensuring fruit quality
Really nice figures BTW.
From:

0
36
197
I got fluorescent plant extract. Glowing plant juice!

3
5
196
New tutorial on pathway visualization is live! The workflow models pathways as networks + visualize them using ggraph, a ggplot extension of network analysis package igraph. Tutorial, example scripts, input & output are available on GitHub:


3
38
193
I got my “free” author copy. Technically it’s my boss’s copy, but she let me have it.


4
1
189
Wow! What an honor to be the author of one of the most starred R repos. Humbled to be along side with the repos for "R for Data Science" () and "Fundamentals of Data Visualization" ().

Most starred R repos:
- (
@hadleywickham
): 4219 stars
- (
@ChenxinLi2
): 3967 stars
- (
@ClausWilke
): 2999 stars
1
15
57
5
15
185
My "Simple Tidy Gene Co-expression" analysis workflow has been updated to include a 2nd use case - a heat stress time course. The workflow seems to function fine both to study development and stress. Read more:


5
34
185
Notice of Award! I will be working as postdoc/co-PI (an upgrade, I guess) on our newly funded NSF-EAGER to pilot single cell multiome and TF-DNA interaction assays in medicinal plants with
@TheBuellLab
. 🌳🌿🧬🧪💻📊

19
6
183