

Andrew Dessler
@AndrewDessler
Followers
36K
Following
9K
Media
2K
Statuses
19K
Prof of Atmospheric Sciences & climate scientist @ Texas A&M; AGU and AAAS Fellow; Native Texan; find out what I think at https://t.co/UNGW2rqvbo
College Station, TX
Joined August 2013
profile picture pupdate: strong consensus for: dog, but more professional. Introducing my new profile pic:

46
26
450

Kick off football season with an offer you're not gonna wanna miss on FanDuel!.
147
113
2K
RT @CColose: @Revkin @curryja @matthewgburgess @SecretaryWright Happy to talk about this more on your podcast, but of course Judith’s frami….
0
4
0
RT @AndrewDessler: On The Climate Brink: More about the DOE Climate Working Group report. The Fix Is In: Without independent review editor….
theclimatebrink.com
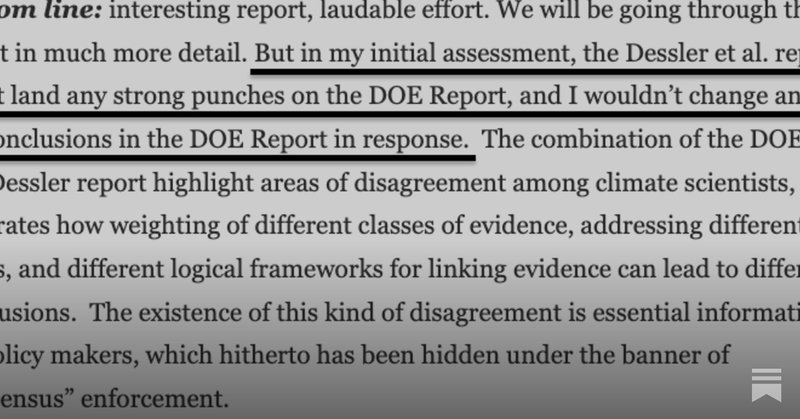
Judy Curry unwittingly spills the beans
0
24
0
RT @jpgcrowley: @AndrewDessler The editor's role is very important, and often ignored or misunderstood by critics of peer review. Thanks f….
0
1
0
RT @rahmstorf: “I suddenly realized that the DOE is not going to appoint a review editor. They’re going to simply send the comments to the….
0
20
0
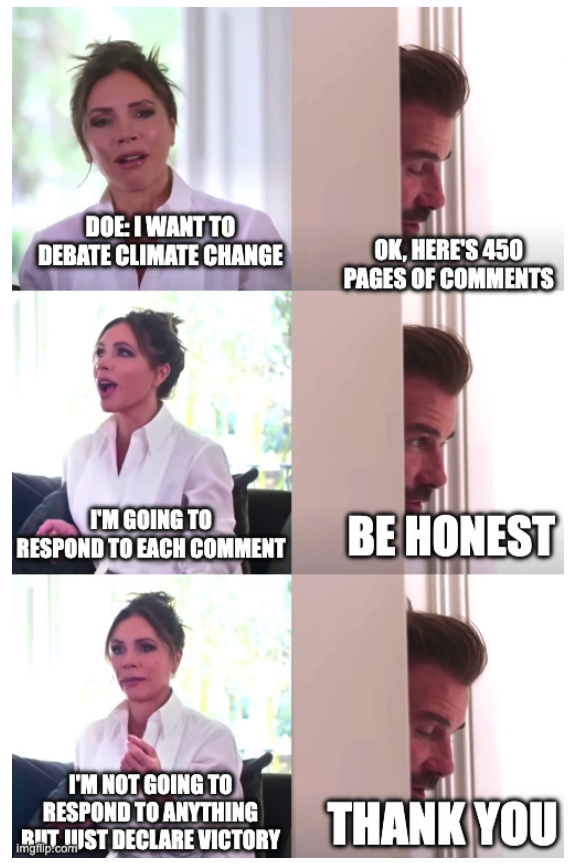
On The Climate Brink: More about the DOE Climate Working Group report. The Fix Is In: Without independent review editors, their “peer review” process is a sham. Science and humanity deserves better.
theclimatebrink.com
Judy Curry unwittingly spills the beans
10
24
57
RT @DeSmog: The Trump administration's "climate working group" produced a report full of errors, typos, and climate denial talking points,….
0
14
0
RT @JBPritzker: And I would never want to get between Ted and a trip to Cancun when there’s an emergency in Texas.
0
7K
0
RT @mattyglesias: One of conservative mass media’s main functions isn’t so much the dissemination of propaganda as simply erasing inconveni….
0
211
0
RT @JustinWolfers: Political party discovers that higher tax rates lead to higher tax revenues.
0
960
0
RT @mzjacobson: 85 scientists: @ENERGY climate report . "exhibits pervasive probs with misrepresentation+selective citation of science lit,….
drive.google.com
0
10
0
RT @JohnCornyn: There you go again. Ten Commandments for thee, but not for me, eh, Ken?.
0
1K
0


RT @clawrence: China & the Middle East will soon be able to synthesize fuels & chemicals from solar power & electrolysis cheaper than we pu….
0
111
0
RT @Revkin: @matthewgburgess On the climate scientists' review of the Team Trump review, my takeaway is that @SecretaryWright has successfu….
0
3
0
RT @RCScience: The DOE's climate report is a sham, with hand-picked contrarian experts and cherry-picked data that ignores 99% of the scien….
0
5
0
RT @CColose: The blue team response shows that there isn’t really a red team, it’s just propaganda-by-design.
0
4
0
RT @rahmstorf: @AndrewDessler The false claim that warming would reduce overall temperature-related mortality is a climate denial classic.….
0
4
0
RT @DoctorVive: He's too modest to say, but Andrew Dessler has led and coordinated a full-court scientific response to that execrable, clim….
0
135
0
very relevant:.

0
0
3