Ethan Moore📈
@Moore_Stats
Followers
3,723
Following
403
Media
382
Statuses
1,524
Explore trending content on Musk Viewer
Mbappe
• 946896 Tweets
Fauci
• 804675 Tweets
Real Madrid
• 730615 Tweets
Farage
• 229144 Tweets
Venom
• 148942 Tweets
WNBA
• 135969 Tweets
Aziz
• 126296 Tweets
Reform
• 124866 Tweets
Jadue
• 115529 Tweets
مدريد
• 96266 Tweets
Marjorie Taylor Greene
• 87508 Tweets
Acun
• 85147 Tweets
Monica
• 79171 Tweets
Mimi
• 72726 Tweets
Bienvenido
• 67934 Tweets
sabrina
• 67787 Tweets
Florentino
• 63707 Tweets
#loveIsland
• 60974 Tweets
Djokovic
• 59505 Tweets
Clacton
• 54548 Tweets
Botafogo
• 39673 Tweets
Palmer
• 37005 Tweets
Stephen A
• 35454 Tweets
Larry Allen
• 30839 Tweets
#المقاومه_العراقيه_تدك_حيفا
• 26550 Tweets
marti
• 21040 Tweets
Cerundolo
• 19315 Tweets
Trent
• 17846 Tweets
Marge
• 17564 Tweets
Bosnia
• 16201 Tweets
Ducati
• 14746 Tweets
Adnan Oktar
• 11011 Tweets


Pinned Tweet

My latest article:

4
15
84
I have accepted a position with the Minnesota Twins in their Baseball Research Department for the 2021 season. I’m very grateful for the opportunity and excited to get going!
109
40
2K
I’m very excited to announce that I’ll be joining the Yankees front office this summer as a Quantitative Analysis Associate! I can’t wait to get started!

85
46
2K
My love for the game was sparked by the 2007 Rockies and was fostered over many years in the Coors Field bleachers.
That’s why it’s so special to be able to say that I’ll soon be joining my hometown team full-time as an Analyst in the R&D department!

50
5
773
I decided to write honestly about my personal decision to leave the baseball industry.
I hope this piece gives current and future job seekers a more realistic view of what it means to work in R&D and a chance to hear about my experiences in this space!

43
75
673
NEW POST: I made a predictive model that can help batters predict which pitch is coming next, and theorized how I think teams could use it to gain a competitive advantage!

44
65
477
This is the article I thought I’d never write.
It’s about my favorite topic in all of baseball analytics: one massive blind spot in how we understand and quantify the game.

19
59
471
“How can I work in a front office?”
I wrote about my experiences going through the MLB front office hiring process with the hope that it can help those interested in breaking into the industry! Plus some wise words from those already with teams!

10
33
295
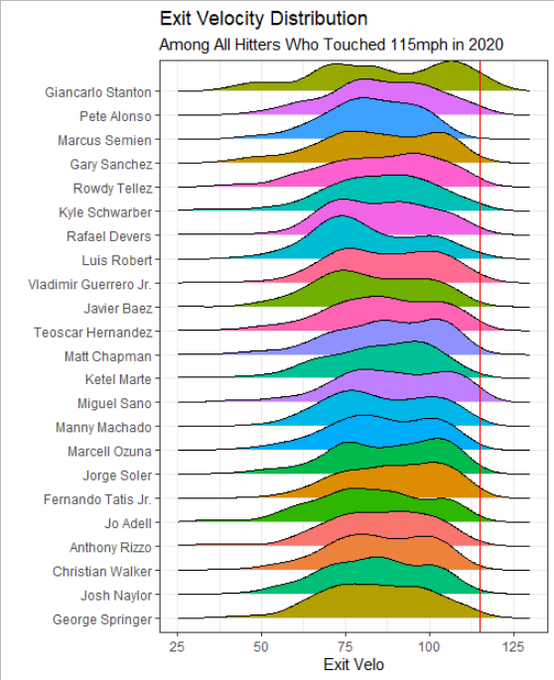
I like this graph a lot better. Everyone who hit 115 EV in 2020, sorted by their max EV:
22
8
217
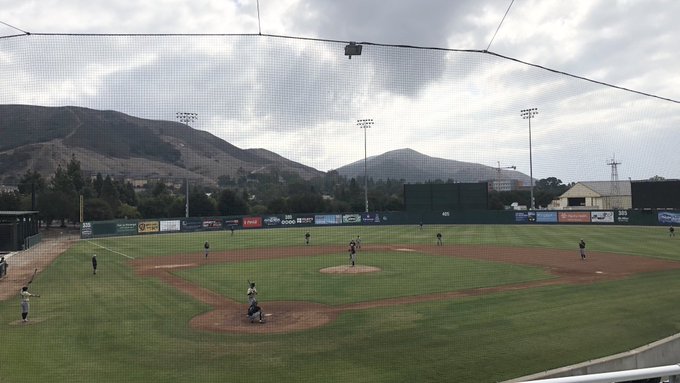
Bobby Ay, Messing with Timing, Changeup K
(1 of 11 Changeup whiffs on the day!)
@bobbyayy37
#BobbyShimmy
?
#CalPolyPitchingNinja
6
11
210
I enjoyed working for my hometown team, but after careful consideration, I’ve decided to leave my position in the Rockies R&D department to pursue other opportunities.
6
4
190
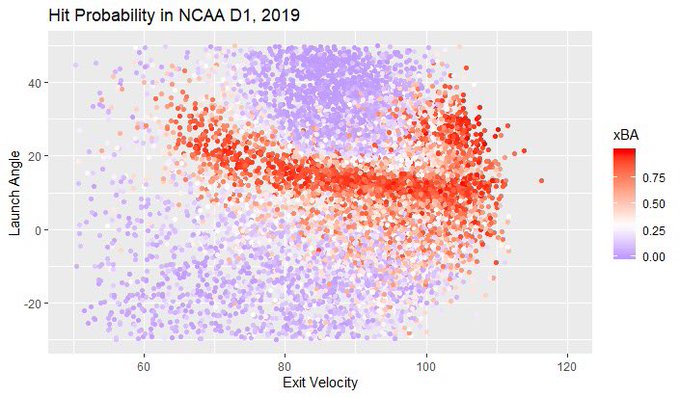
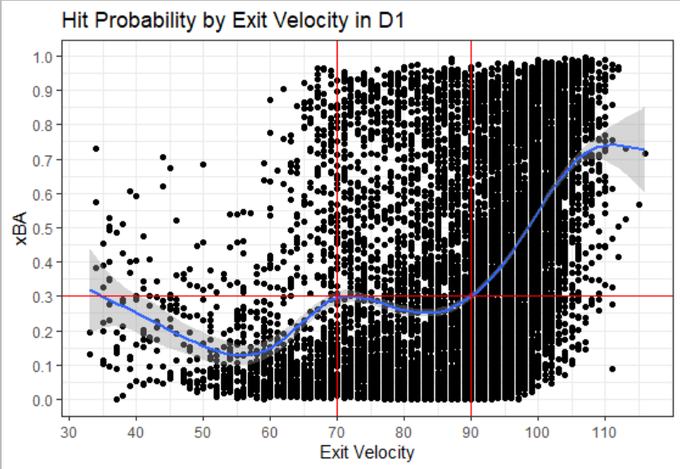
THREAD: Yesterday I set out to model Hit Probability in D1 College Baseball. Given exit velocity, launch angle, and spray angle, we can get a pretty good idea of whether a batted ball should have been a hit or not. Here’s the distribution I found!
12
26
190
I finally made my pitch quality model and I am excited to share the results! Here's the write up:

10
25
173
I made this last night for no reason but I think it’s kinda fun to look at
8
6
167
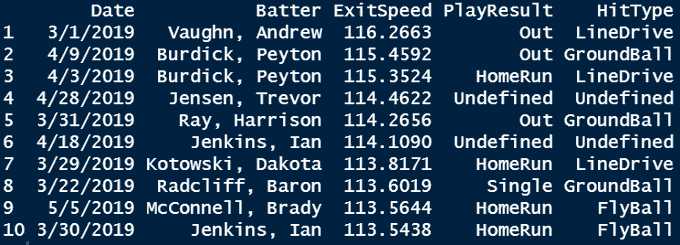
The hardest hits in D1 (in the Trackman database) in 2019:
11
12
160
If you’re feeling (for one reason or another) like supporting open source, validated Quality of Pitch research, here’s my most recent work on the topic (and my code!)
8
21
141
On the day I took my last college final, I got my traditional Cal Poly Statistics Department graduation gift- and it’s one of my favorites! I’m going to miss everyone so much!
@calpolystatclub
23
2
122
Last Friday was the end of my fellowship with the Twins and I have decided to pursue new opportunities going forward. Massive thanks to Twins R&D for the opportunities to learn and make an impact!
10
0
118
My Update: Life on the Other Side

0
6
118
Hitters do better the more they face a pitcher in a game. But why? There are two main theories:
1. The pitcher gets tired and throws worse pitches
2. The hitter gets more familiar with the pitcher
We don’t know which theory is more likely.
Until now?

14
11
110
I just wanted to hop on here and give a little update.
I’ve decided not to pursue another full-time opportunity in baseball at this time. 1/6
5
1
111
Coming out of Cal Poly Baseball Analytics retirement to bring you a
@calpolystangs
stat:
#22
Brooks Lee has 2 2Bs today, Tuesday 2/22/22 ✌️✌️
3
12
99

One of my favorite baseball data visualizations this season was from
@mike_petriello
on the Rays' diversity of bullpen release points. I decided to recreate this plot using all Rays pitchers and regular season data!
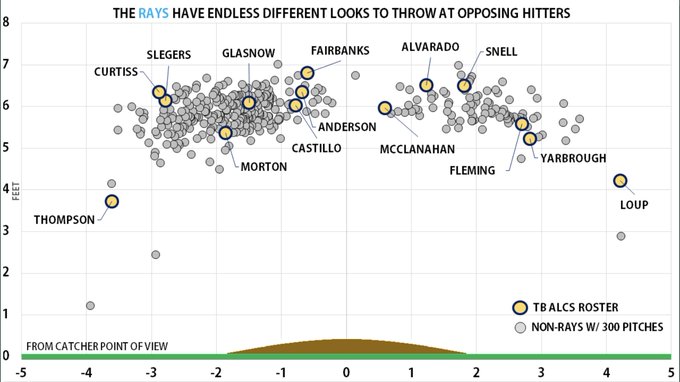
5
6
74
Going forward, you’ll now be able to read my work at
@Prospects365
! My first article there is about how my pitch quality metric is strongly correlated with fWAR! Check it out here:

6
9
72
Alright baseball trivia twitter, let’s see who knows their stuff.
Name all 381 pitchers to start a game in 2019.
17
2
64

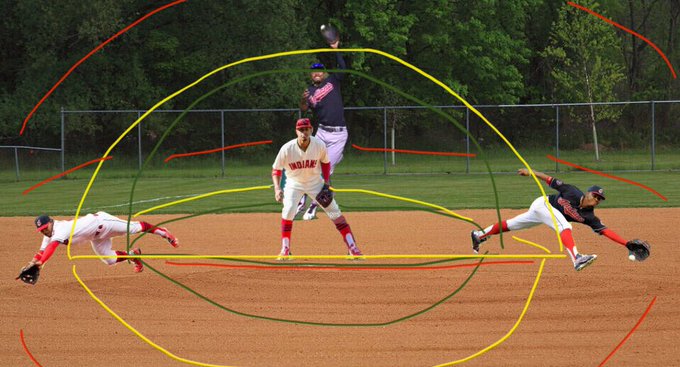
I’m sure this already exists but I’ve been thinking of a way to quantify infield defense range by finding each guy’s 100% fielding probability in every direction (green), their 50% probability region (yellow), and 10% (red). Volume of each region is the guy’s range at that prob?
7
8
60
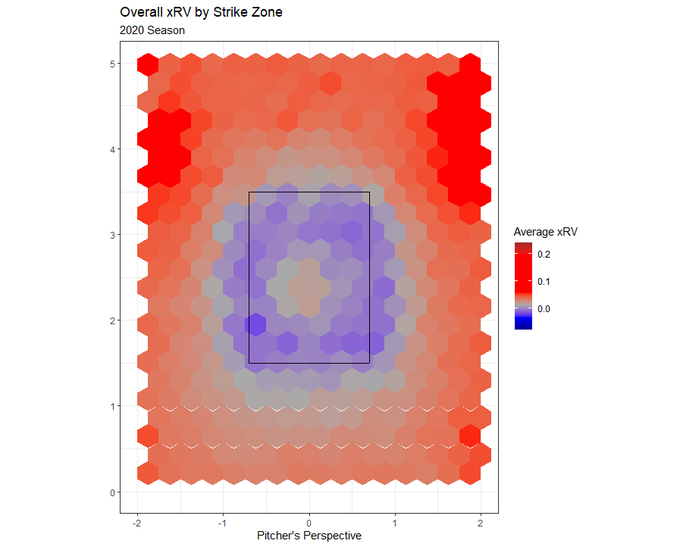
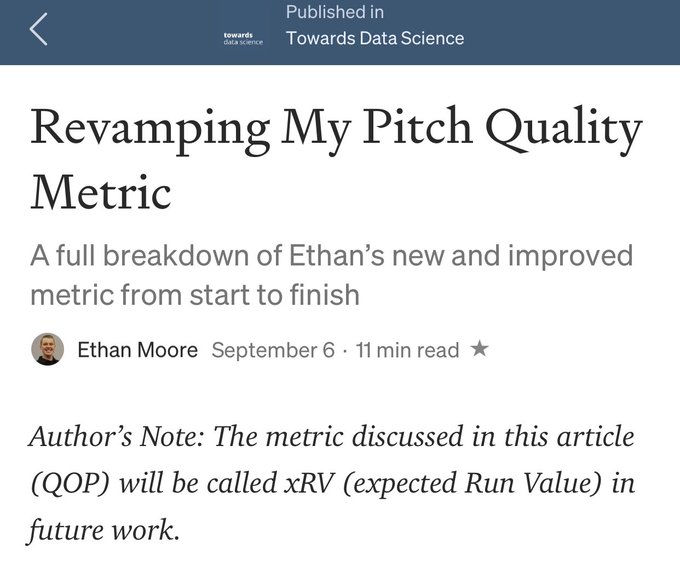
My last update to my pitch level run value estimator xRV represents a significant improvement over the last two versions! Read all about it here:

2
9
59
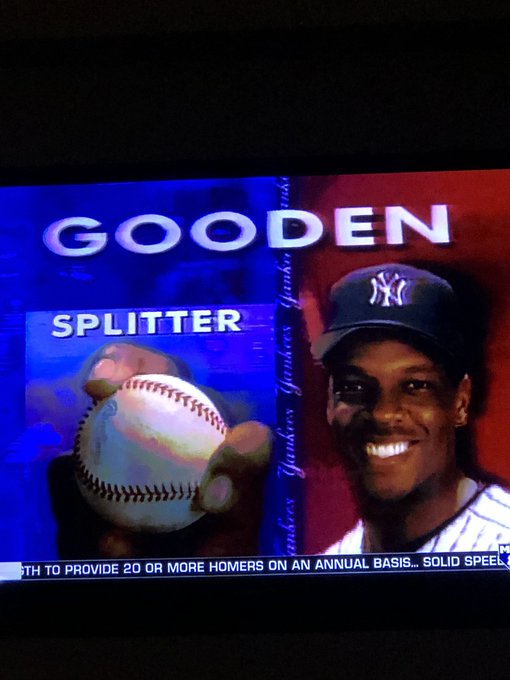
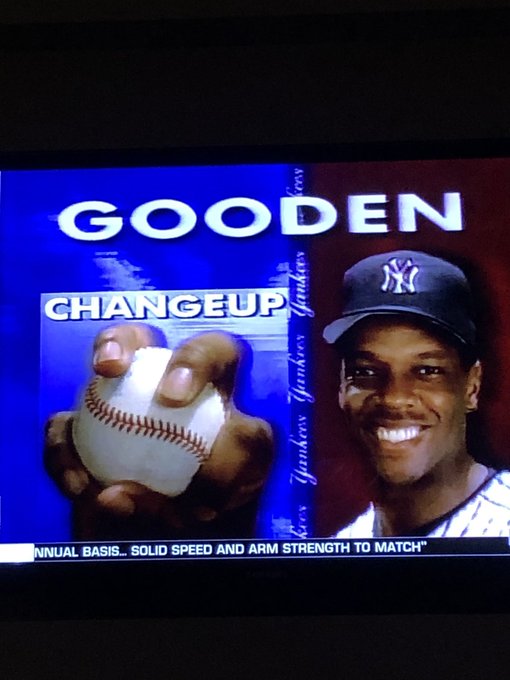
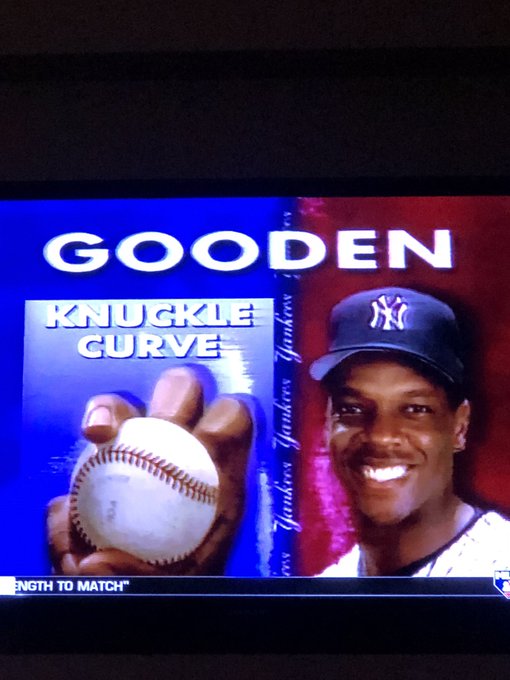
I don’t think I’ve ever seen anyone hold any of these pitches like this before
4
2
53
"Jacob deGrom's Slider is faster than the average MLB Fastball!"
This is because his Slider profiles more like a Cutter (which is a type of Fastball). The pitch has far greater vertical movement and less horizontal movement than the average MLB Slider.
It's a really good Cutter

5
5
54
Putting the finishing touches on the final version of my expected Run Value (xRV) metric (writeup and code coming soon 👀)
For now, here are the best Changeups by "xRV 3.0" of 2020 and where they did best in the strike zone:

1
0
53
A few weeks ago I was able to catch one last
@calpolystangs
game and reflect on my 3 great years with the program. I’ll be graduating in a few weeks and stepping away from the team, but I feel great about the direction of
@StangsAnalytics
under
@jackdwyer22
and
@benmang_stats
!
2
3
56
Huge thank you to everyone who has sent their congratulations today. I’m not able to respond to everyone individually but I really appreciate the outpouring of support!
0
0
52
This article is the debut of a new metric of mine called QOS+! It is calculated with the same methodology as my existing pitch quality metric, but without accounting for location. This allows the metric to hone in on the Quality Of a pitcher’s “Stuff”

Thanks to
@Moore_Stats
, we’ve got a stuff metric that we can show you. Thanks to
@StatsPerform
we’ve got a command metric that we can show you. The first Command & Stuff Report:
1
16
50
7
2
52
Two years ago today I moved across the country and into a converted kitchen in Stamford, CT to begin my first internship in the baseball industry (with
@TrackManBB
). Seems like so long ago.

2
0
51
I noticed that Apple Maps accurately renders baseball fields -even down to the shape of the infield cutouts- for what seems like every field in the US/world? I have no idea why this is the case but it’s so cool

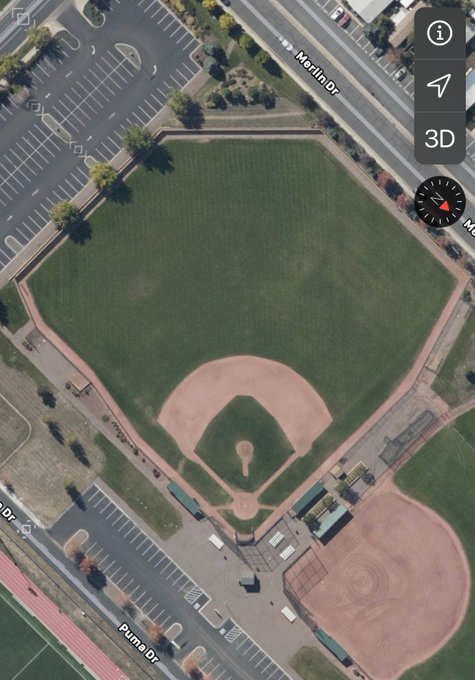
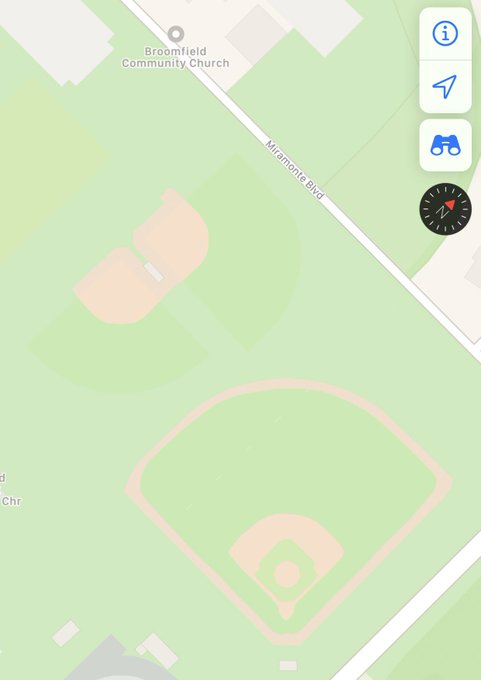

2
1
49
I’ve done a lot this summer with my pitch quality metric and have gotten a lot of good feedback on how it could be improved upon.
In this article, I describe how I rebuilt it from scratch to address many of the issues of the initial metric!
5
9
48
Going forward, I will be pursuing data science opportunities in other industries.
I still want to creatively solve problems and have a measurable impact, same as ever.
But I’m excited to do so in a new setting with a greater personal emphasis on my life outside of work. 6/6
8
0
46
I'm still working on some data visualizations. Here's a plot of how each of the 6 main pitch types tended to move in 2020. Each line is a pitcher's average for that pitch type.

4
3
44
Jeff McNeil had 50% more foul balls (555) than called strikes and swinging strikes COMBINED (371) in 2019!
2
4
43
Here is my model's overall average run value prediction for every pitch in 2020 by strike zone location. Not surprising that the corners of the zone are the best places to spot your pitches! Cool to see that insight confirmed by my model though.
4
3
44
Me patiently waiting for my model to finish running

I love Freddie Freeman standing on deck even though there is no way for him to bat this inning

64
485
12K
0
0
45

Just got to be on a Careers in Sports Analytics panel for my very own
@calpolystatclub
. Over 40 students in there!
When I was a freshman I knew of 0 CP alums with MLB front office experience. Now we have at least 4 with even more on the way!
2
1
44
I'm working on a model to predict expected runs for every pitch of the 2019 season.
According to the model so far, I present to you the pitch with the highest expected run value (aka biggest meatball) of the season:

5
0
42
Quick note: i’ll be referring to my pitch quality metric as xRV from now on. I think this new name is a more descriptive and will hopefully cause fewer headaches than the previous name!
All other aspects of the metric will remain the same.
4
0
44
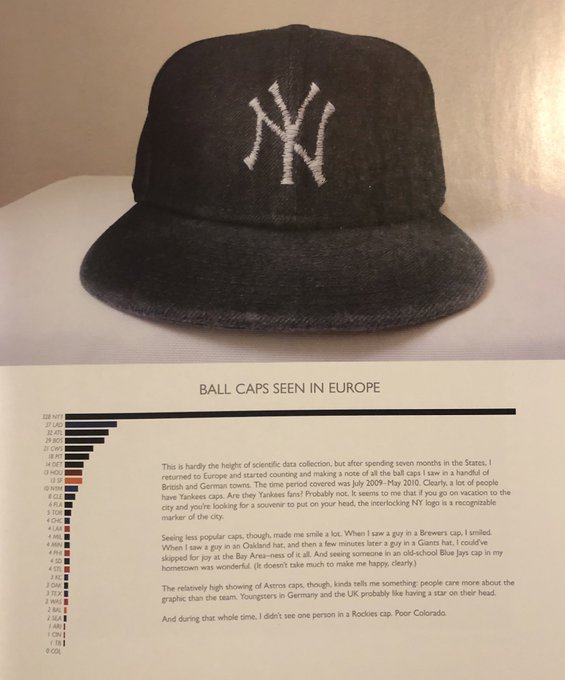
Looking back, Flip Flop Fly Ball is probably my favorite book I had as a kid. My interest in the data visualizations helped put me on the path i’m on today.
As a young Rockies fan, that last bar chart killed me for some reason😂
Thank you
@flipflopflying
!


5
0
42
IN THE ZONE: EPISODE 3 with
@drivelinebases
Highlights:
•Kyle explains the Reds’ pitching philosophy “A.C.R.”
•How he decides whose advice is valuable in decision making
•Why moving the mound back is not the offensive solution people may think

0
1
42
My new interview show “In The Zone” is a place to have and share longform conversations with interesting members of the baseball community.
The first episode drops tomorrow on my YouTube channel!
Subscribe here:
3
3
39
I’m really excited about this one!
It’s all about the undiscovered world of swing timing analysis, something I’ve been thinking about for a while and finally put into words. Enjoy!
2
9
38
5 lessons I learned in my short time working in MLB R&D right out of college👇
If you you would like to share any lessons from your experience with current or future job seekers in this space, please feel free to add those in the replies!
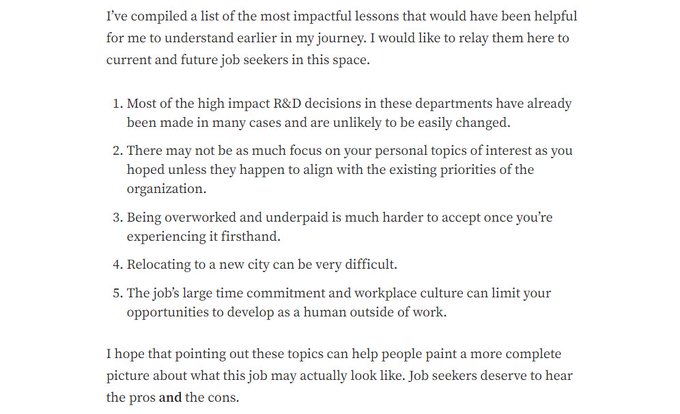
I decided to write honestly about my personal decision to leave the baseball industry.
I hope this piece gives current and future job seekers a more realistic view of what it means to work in R&D and a chance to hear about my experiences in this space!
43
75
673
4
3
37
Super excited that my most recent post is being featured on my favorite data science blog, Towards Data Science! 🔥🔥🔥

3 Things We Could Learn From Swing Timing Analysis by Ethan Moore
0
1
14
1
0
36
Which kinds of Fastball/Changeup combinations are most successful?
Find out!👇

0
7
37
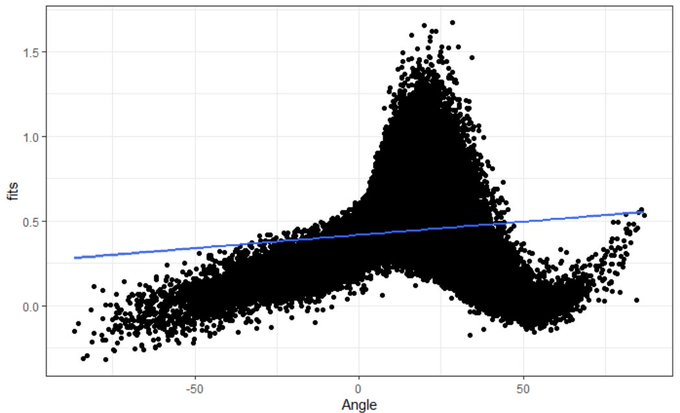
My next article is going to be all about vertical and horizontal approach angles of pitches! Here are some fun outliers to get you excited!
THREAD👇👇
4
1
36
My latest article dives into Vertical and Horizontal Pitch Approach Angles and whether they could improve our understanding of pitching!
0
3
38
IN THE ZONE EPISODE 1: Jerry Weinstein on Coaching is available now!
The legendary
@JWonCATCHING
joined me to share what he has learned in over 50 years of coaching baseball everywhere from Junior College to the World Baseball Classic!
3
3
35
Did ARod just call Urshela the best defensive 3B in the AL? 🙄
7
1
36
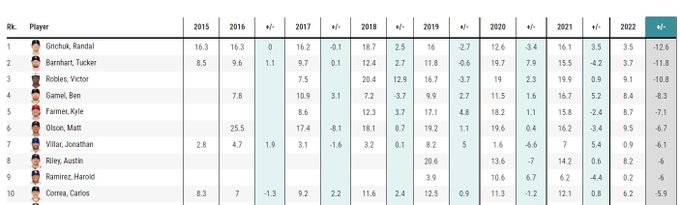
This is most likely due to Tapia playing more often at low altitude and Grichuk playing more often at high altitude than swing changes or anything else.
Fastballs and changeups have less carry at high altitude -> end up lower in the zone than expected -> lower LA all around.
bizarre launch angle fun fact:
the player whose average launch angle has increased the most compared to 2021 (besides Peralta) is Raimel Tapia
the player whose average launch angle has DECREASED the most? Randal Grichuk, who Tapia was traded for...and is now in Coors........🤨

4
8
69
1
10
35
Dylan Villalobos, Painted Fastballs, 89->89->91 = Backwards K
#calpolypitchingninja
@_DYLAN_47
0
9
35
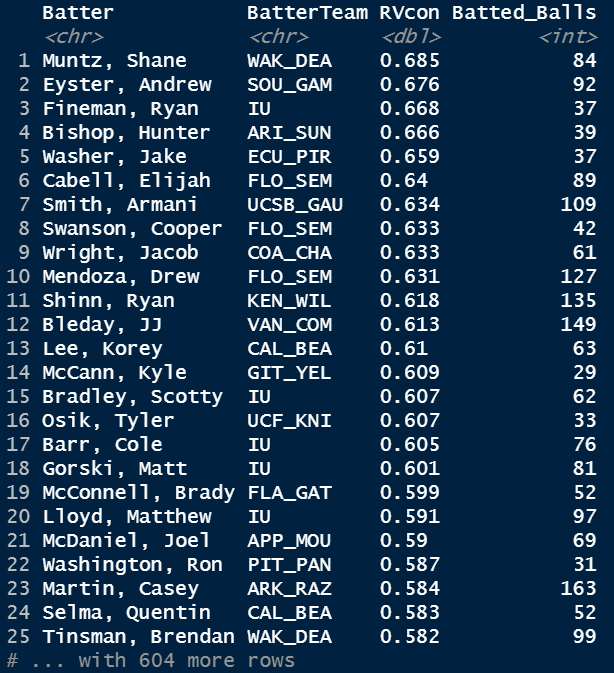
I've been working on a new model for class and wanted to share our results.
@benmang_stats
and I created a mixed model to predict run value on (TM tracked) batted balls in 2019 D1.
Here were the leaders in our RVcon (expected runs per batted ball), min 25 BIP:
2
2
33
I haven’t thought about baseball in my free time since May. A lot has changed for me since then.
Around that time I wrote about the future role of R&D in the front office. I’m not really even sure why, but I’d like to share that piece here and now.
3
2
33
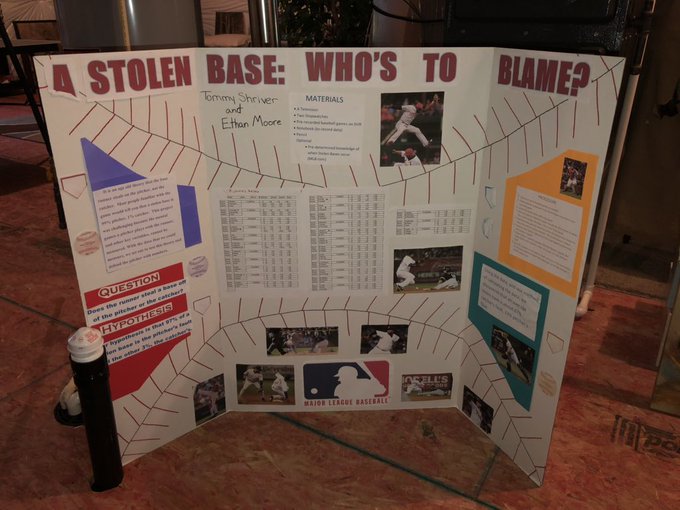
Today I found the first baseball related research project I ever did.
@t2shriver22
and I attempted to distribute credit/blame to the pitcher and catcher for each stolen base. 1/
1
1
32
This is a really cool idea. It inspired me to try to visualize this information in a slightly different way. Here’s my attempt, showing the number of whiffs each sequence got *over the expected number of whiffs for its count*

2
0
31
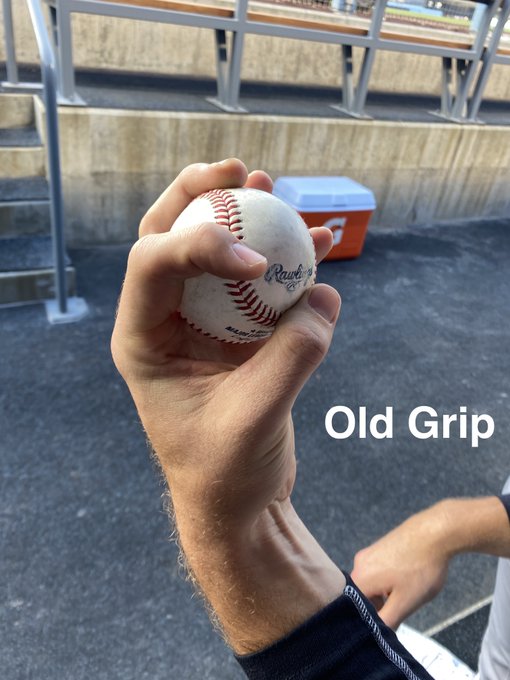
It’s crazy to me how small grip changes can cause big changes in outcomes.
Grips seem to be understudied by baseball researchers (as far as I know) relative to their importance.

Tarik Skubal's CH is different.
The pitch is getting career highs in swing and miss and is more efficient than ever in 2 strike counts.
One big reason for the success: a new grip.
More on Tarik's CH, SL and what pitch he plans on using more coming Wednesday via
@PitcherList

7
13
112
2
0
32
This is cool but it would be cooler if I didn’t have to watch a 15 second ad before every 7 second video

1
2
31
This Andrew Alvarez AB stood out to me from this weekend:
1. 88mph Fastball in, get ahead 0-1
2. Well executed 77mph Slider, whiff
3. Attempted back foot Slider, ball
4. Went right back to it, back foot 79mph Slider, K
Great adjustment🔥
#CalPolyPitchingNinja
@TwitterlessAlvy
0
6
30
Here was yesterday's worst single pitch according to my model. How could it be that bad? At least it was a strike, right?! No. It's bad because pitches like this often gets hit to the moon.
6
0
27
Cool article here about innovations in training at the ML level. It got me thinking...

1
4
29
Take a look at the ~smoothed expected batting average in D1 by exit velocity last year:
*The only pitches with an xBA over .300 were hit 90+.
*Among 70-90 mph batted balls, it was actually better to be closer to 70 than to 90 (so they fall in front of OFers).
*<70 is no bueno.
1
4
27
Visiting the previous site of the College World Series in Omaha! They’ve turned Rosenblatt into a public wiffle ball field while preserving the original home plate location and foul poles. College baseball’s Mecca!


2
2
28


Picture this:
Up 5-4, Bottom 9, Bases Loaded, 0 Outs, then...
Andrew Alvarez, Slider, ꓘ
Taylor Dollard, Slider, K
Taylor Dollard, Fastball, K for the win!
@TwitterlessAlvy
@T_Dollard
#CalPolyPitchingNinja
1
5
27
I had a really fun time presenting to
@calpolystatclub
today about how MLB teams use statistics to help win games. DM me for the link if you’d like to watch the recording!
0
0
27
Very excited about the next (and last???) episode of my interview show In The Zone with my guest
@beth_woerner
!
Our chat is dropping tomorrow at 11am MT!

1
1
27
Testing out a plotting function i’ve been wanting to use for a while (geom_pointdensity) so enjoy last year’s D1 Trackman pitches vs lefties and vs righties!

3
2
26
Good luck to
@calpolystangs
tonight and this season! Can’t wait to watch as a fan tonight for the first time in a while! Gotta drop the ‘19 manager pic for good luck🐴

0
1
26
I’m going to start putting out videos where I break down a batter/pitcher matchup and talk about pitch sequencing, something I want to learn more about. The first episode is up now!

5
5
25
I really enjoyed having this conversation, please check it out!

What's it like leading a college analytics program?
@Moore_stats
joins
@affranco10
to discuss how
@calpolystangs
integrate advanced metrics into their scouting and recruiting
0
6
18
0
3
25
CAL POLY BASEBALL:
• Sweeps Long Beach State for the first time in 20 years
• 10-2 record in conference
• 6 game winning streak
🔥🔥🔥
1
2
24
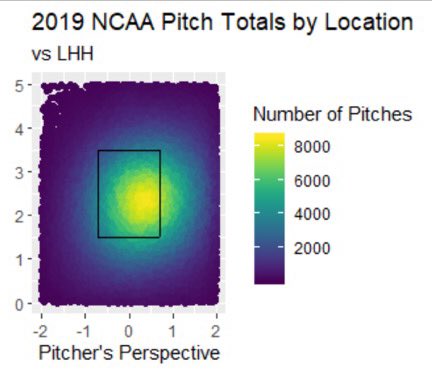
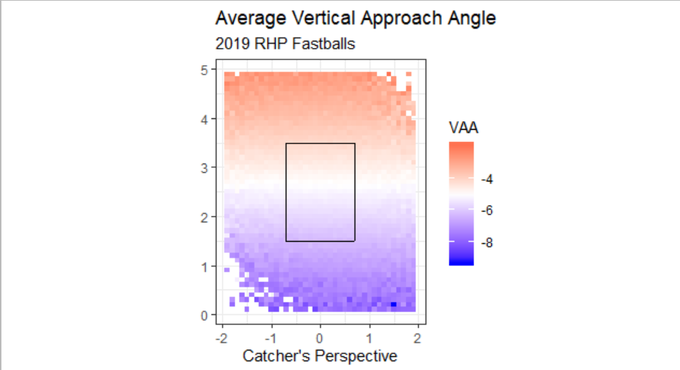
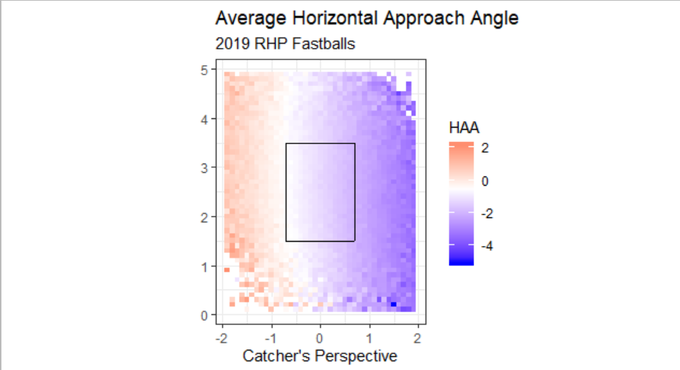
I'm starting to do some research into vertical and horizontal approach angles of pitches and thought I'd share some general league trends for 2019. Units are degrees.
Red is "ride", blue is "depth" in VAA graphs
Red is armside run, blue is gloveside cut in HAA graphs
FASTBALLS
3
1
22
I did this in little league with a 3-0 count and got thrown out at first

0
1
24
IN THE ZONE: EPISODE 2
I talk with Jordan Shusterman of
@CespedesBBQ
about the baseball media landscape and his path to making a career out of baseball content creation. This is a very fun conversation and I hope you enjoy!

0
0
24
IT’S THAT TIME!!!
Top 1 favorite sport to watch AND YES I SAID “SPORT” 🏓😤
2
1
24
A while back, I wrote about how summing up the linear weight of each pitch a pitcher throws in a season ends up being a pretty good proxy for their overall performance. Here's how that metric looks so far in 2020 and compares to other trusted pitching metrics:
4
4
23