

Samanwoy Mukhopadhyay
@scorpisammy
Followers
37
Following
310
Media
3
Statuses
66
Biotech PhD 🎓 Bioinformatics whiz 🧬 Bulk & Single-Cell RNASeq 📊 Genomics enthusiast 🌟 R & Python aficionado 🐍 Unveiling life's mysteries through data!
Kolkata
Joined November 2010

I integrate and annotate 75 AML biopsies in part 2 of my 2024 single-cell guide. Custom label transfer, nuanced integration with hyperparameter tuning, avoiding pitfalls in analysis, etc. It's long, but one of my favorite videos so far.
2
18
129
My "Friends Don't Let Friends Make Bad Graphs" series is on GitHub! I will continue to update it when I have time and inspirations. Code and associated data also up there. https://t.co/KeSsEc9UpK
github.com
Friends don't let friends make certain types of data visualization - What are they and why are they bad. - GitHub - cxli233/FriendsDontLetFriends: Friends don't let friends make ce...
4
17
70
Now I am being charged for a trip that I did not even cancelled. What is this!!!
0
0
0

A follow-up - Posit staff are working on an LLM interface called chattr: https://t.co/772CkCb9u0 It has been tweeted about with the #rstats hashtag... exactly 0 times https://t.co/fFn5W9Yxwx 🤷♂️
5
13
47

WGCNA is cited 16,372 times for bulk RNAseq co-expression analysis. The single-cell version is here: hdWGCNA identifies co-expression networks in high-dimensional transcriptomics data https://t.co/3zyCi89cuf My blog post on it a while ago
3
51
248

With https://t.co/xIwKCUofyw, you can chat with your data in plain languages. Now upgraded to v. 0.96. Fix a bug and made GPT-4 available. Interactive plots via plotly and CanvasExpress!
17
335
1K

Are you an R user who is interested in learning Python 🐍 ? My new blog post introducing Python from an R user's perspective might be just the launching point you need to get started on your journey 🛫 https://t.co/LDHzG2VlZm
#rstats #python #DataScience
rebeccabarter.com
I have a confession to make: I am now a Python user. Don’t judge me, join me! In this post, I introduce Python for data analysis from the perspective of an R (tidyverse) user. This post is a must-r...
25
251
1K

I was using plotnine to create a figure with @quarto_pub and had to figure out that you need to call .draw() on your plot in order for it to work! (This is unlike mpl where you call .show()) In case this saves anyone else from a google search!
3
5
25

I'm increasingly using #Python since it is used in my new office. A sad move from #rstats until now. I was especially missing my beloved #ggplot2... but today I've discovered #plotnine, a kind of ggplot for #PythonProgramming : great discovery! https://t.co/52vZhavcH4
0
2
2

Plot as a function of two-level categorical variables Weight of athletes according to sex and sport Compare Females vs Males https://t.co/usGUSqWCaG
#plotnine python software Libre Costa Rica CostaRica Nicaragua Guatemala El Salvador Honduras #sinluz Peso sexo Deporte Atletas

Plot as a function of two-level categorical variables Weight of athletes according to sex and sport Compare Females vs Males #rstats ggplot Costa Rica #CostaRica Nicaragua Guatemala El Salvador Honduras #sinluz Peso sexo Deporte Atletas
0
1
0
google tip: search "package name" [r] will give you the R package. [] is for the R language. you can use [python] too.
0
4
32


The long-awaited new object oriented system for #RStats, S7, just dropped: https://t.co/sABYV75dL2

cran.r-project.org
A new object oriented programming system designed to be a successor to S3 and S4. It includes formal class, generic, and method specification, and a limited form of multiple dispatch. It has been...
2
40
148

.@HarvardBiostats 260 Introduction to Data Science starts next week. Course notes and exercises, updated weekly, are publicly available here: https://t.co/6zd2RihTTl GitHub repo with Quarto code is here:
github.com
Contribute to datasciencelabs/2023 development by creating an account on GitHub.
3
269
1K
I made a short RNAseq tutorial on generating counts with Salmon for gene-level differential expression. This is currently my preferred workflow for bulk RNAseq analysis as it is easy and more accurate than some commonly used methods. #Bioinformatics
0
98
409
RNAseq counting tools are not perfect. I simulated 240 GTEx samples to test multiple tools. Below I show the difference between actual and estimated counts for each simulated sample. But, what is causing this? And will it affect differential expression? (1/7) #Bioinformatics
11
226
859

new review on gene regulatory network inference https://t.co/QuuJV11qWf
@VeraPancaldi group.
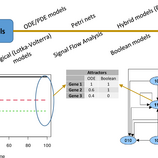
journals.plos.org
Inference of gene regulatory networks has been an active area of research for around 20 years, leading to the development of sophisticated inference algorithms based on a variety of assumptions and...
0
8
30

If you like thinking about software design for data science, you should check out @hadleywickham's tidy design guide: https://t.co/CxcTm2CWU4 (re-posting for science)
0
43
164

Excited to introduce #ggvloc! 🎉 For everyone working with differential expression datasets & RNAseq data, this can be a game-changer. Visualize & highlight genes of interest in just one line of code Check out the package here: https://t.co/AJl9sNE5C8. Don't forget to give it a ⭐
17
185
826