Brian Prest
@bprest
Followers
691
Following
1K
Media
62
Statuses
576
Economist @rff, via @DukeU, @NERA_Economics, & @USCBO. Opinions my own.
Washington, DC
Joined October 2010
The reduced royalty rates do encourage additional production, which DOGMA accounts for, but not nearly enough to overcome the substantial reduction in federal revenue. I’ll be posting additional details of this analysis on RFF’s web site later this week--stay tuned!
0
0
0
These values represent only the approximately 50% share of royalties retained by the federal government, so the cuts would lead to similarly large revenue losses to the states where the oil and gas is being produced.
1
0
0
Using the Dynamic Oil and Gas Market Analysis model, I estimate that these royalty cuts will lead to nearly $5 billion in losses to the federal government between 2026 and 2035, with growing annual losses averaging nearly $2 billion per year over 2036 to 2050 (see figure).
1
1
0
These changes in royalty rates are not the only proposed ones, but because royalties represent 95% of the federal government’s share of the revenues from the sale of its oil and gas, the proposed royalty rate cuts are expected to be a key driver of the bill’s deficit effects
1
0
0
The proposal would make major process changes to federal leasing of public lands for oil and gas production, including cutting royalty rates paid by oil and gas companies operating on federal land by about 25% to 33%.
1
0
0
The House Natural Resources Committee today is marking up its piece of the reconciliation bill currently making its way through Congress.
1
1
2
My analysis on potential impacts of expanded US LNG exports is available here https://t.co/sehfWBpFad
@RFF's analysis of oil & gas leasing led by @bprest can be found here https://t.co/JnLqSOXIoi One can read these and verify the letter's statement is incorrect.
zenodo.org
There are currently 12.8 billion cubic feet per day (Bcf/d) of liquefied natural gas (LNG) export terminals pending permitting approval in the United States. This analysis estimates the potential...
0
1
21
We have a paper out in @ScienceMagazine today showing how new guidelines allowing for income weighting in federal cost-benefit analysis would affect the social cost of carbon. Main takeaway, the SC-CO2 increases nearly 8x to ~$1300/ton. @rff @ERGBerkeley
https://t.co/iL15hhmW8x
science.org
New government guidelines could transform benefit-cost analysis of US climate policy
1
16
34
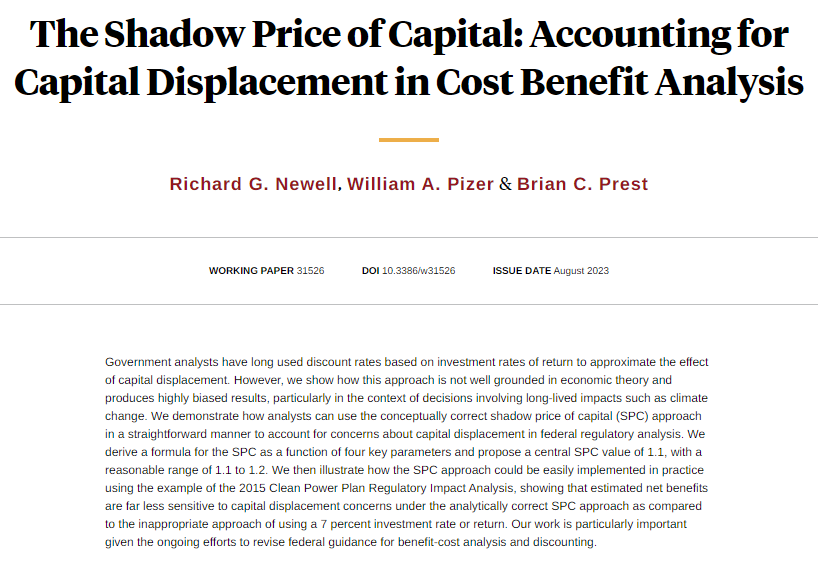
Discounting in benefit-cost analysis using investment rates of return can yield very misleading estimates of the costs and benefits of policies with long-lived impacts, from @richardgnewell, @billypizer, and @bprest
https://t.co/sqnlZjmjnF
0
15
51
Check out this new research in #JEEM on climate royalty surcharges on fossil fuels by Brian C. Prest (@bprest) and James H. Stock (@jimstockmetrics). Increasing royalty rates on federal fossil fuel reduces global emissions. Link to paper: https://t.co/3X0GBpguNw
0
5
6
Psyched about this new @rff working paper from @bprest, Zach Whitlock, & me. It asks: in a future with more ambitious climate policies, what happens to oil and gas production in different US regions, and how does that affect local gov't revenue? 1/8 https://t.co/3rY02uWnu1
rff.org
This working paper models how oil and gas production and associated government revenue could change in five western US regions based on future oil and gas prices in three climate policy scenarios.
2
19
47
In the near term, the difference is small. We show this by redoing the cost-benefit analysis of the 2015 Clean Power Plan, showing that the SPC approach is similar to using 7% for near-term benefits (here, health cobenefits), but massively different for long-term climate benefits
1
0
1
For example, the Obama-era social cost of carbon at a 7% discount rate is ~$7/ton CO2, compared to $51/ton at a 3% discount rate. That's a factor of 7 difference!
1
0
0
How wrong is this? It depends on the time horizon. On long time horizons, the impact of a 7% discount rate compounded many years out into the future is ENORMOUS relative to 10-20% adjustment to costs
1
0
0
Then adjust any capital-displacing costs (or benefits) up by that factor (a 10-20% premium). The impact of that is pretty modest. By contrast, the usual treatment of investment displacement is to just swap out a 3% discount rate with 7%.
1
0
0
But how do you do that? You use the "shadow price of capital" (SPC), which is the value of a dollar of investment relative to a dollar of consumption. We do some maths and get SPC estimates in the 1.1-1.2 range, meaning $1 of investment is worth $1.1-$1.2 of consumption.
1
0
0
First principles of welfare econ say what you should do is explicitly calculate the impact on consumers, and then use the discount rate they would normally use (a consumption discount rate, like 2% or 3%).
1
1
1
Economists often use discount rates based on investment returns (say 7%) to account for the potential that the costs of a regulation might displace capital. But that's not right!
1
0
0
In short: we explain why discounting in benefit-cost analysis using an investment rate of return is generally incorrect and can yield extremely misleading estimates of the costs and benefits of policies with long-lived impacts, such as climate change.
1
0
3


