

Adam Shapiro
@ah_shapiro
Followers
3,894
Following
610
Media
409
Statuses
1,236
Economist @sffed | Applied Micro | Applied Macro | Health Economics | Views expressed here are my own | personal account
San Francisco
Joined March 2009
Don't wanna be here?
Send us removal request.
Explore trending content on Musk Viewer
#KAZZAWARDS2024
• 796787 Tweets
SAROCHA REBECCA IN KAZZ
• 574367 Tweets
FOURTH x KAZZ 2024🥳
• 94964 Tweets
ナイジェリア
• 47987 Tweets
Varane
• 43096 Tweets
インプレゾンビ
• 40167 Tweets
魔法少女
• 30267 Tweets
#お迎え渋谷くん
• 27623 Tweets
B1NI TOPS SPOTIFY
• 26267 Tweets
名誉毀損
• 16447 Tweets
#ابراهيم_المهيدب
• 14722 Tweets
#くる恋
• 13985 Tweets
風の行方
• 12927 Tweets
いなば食品
• 11681 Tweets


Pinned Tweet

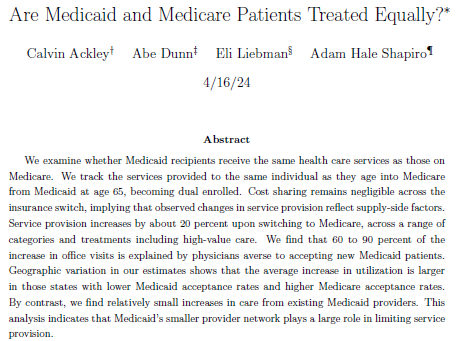
A new paper with Calvin Ackley, Abe Dunn, and Eli Liebman showing that Medicare recipients recieve 20% more services than Medicaid patients (including high-value care)
We track over 22 thousand Medicaid recipients who become "dual enrolled" in Medicare when they turn 65.
(1/5)
2
10
40
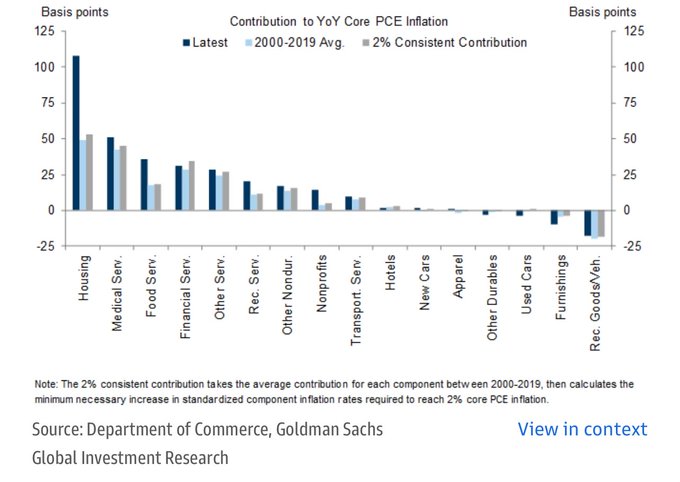
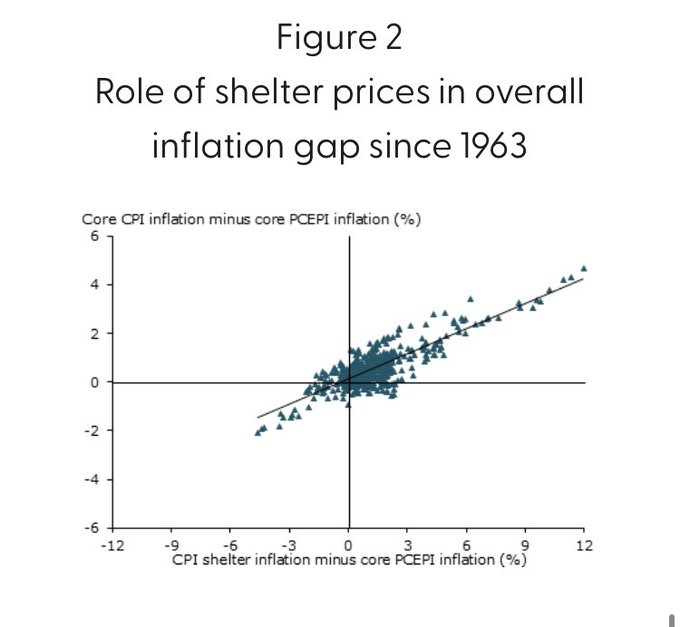
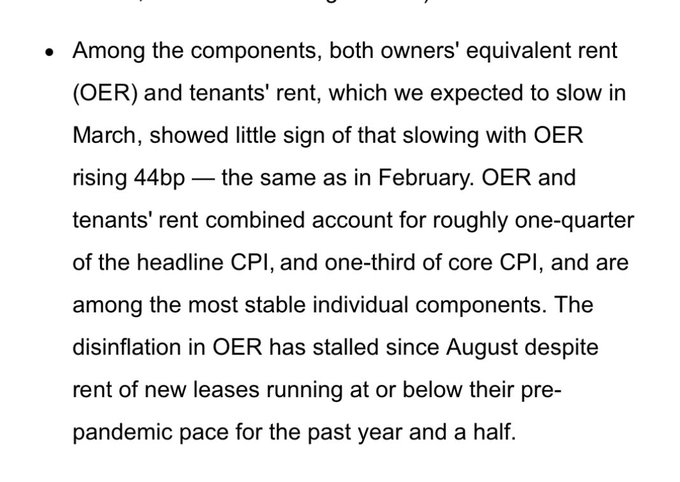
Excess inflation is now almost entirely driven by housing (ie, rent)
25
267
1K
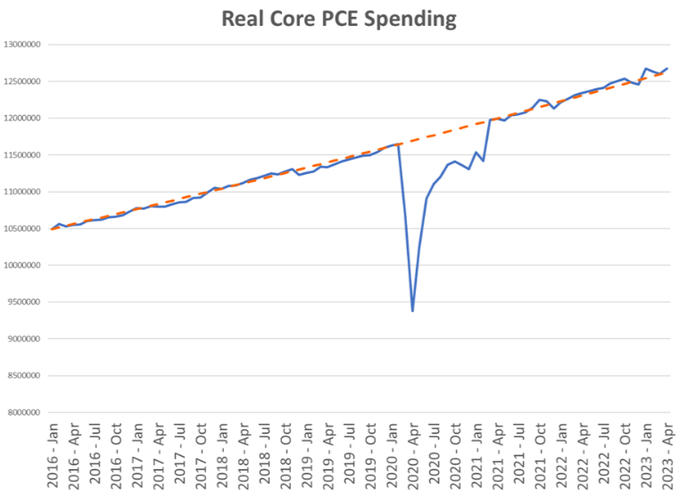
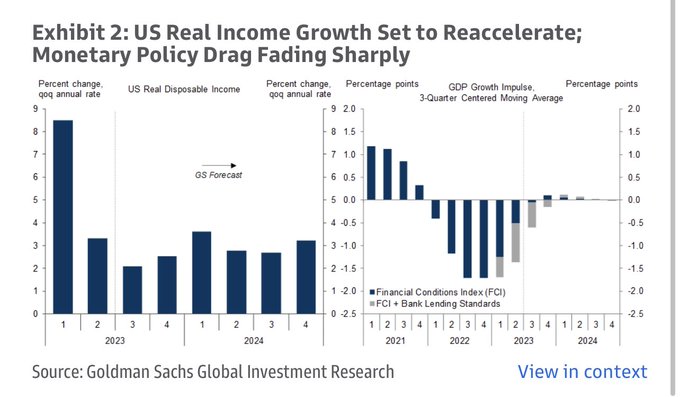
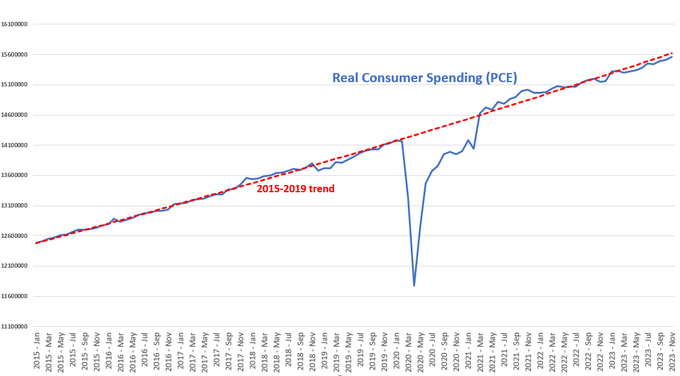
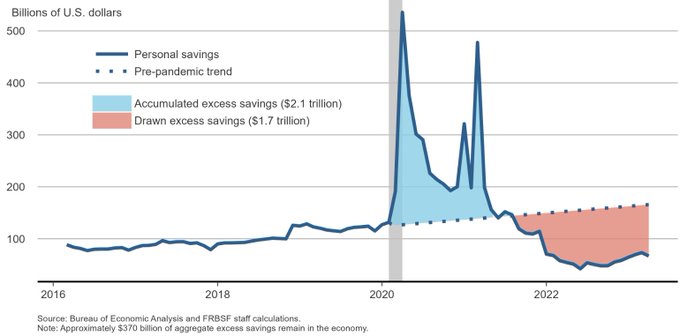
The precision of trend consumer spending is extraordinary
30
83
698
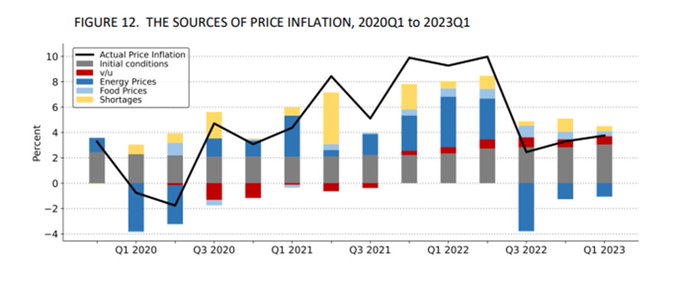
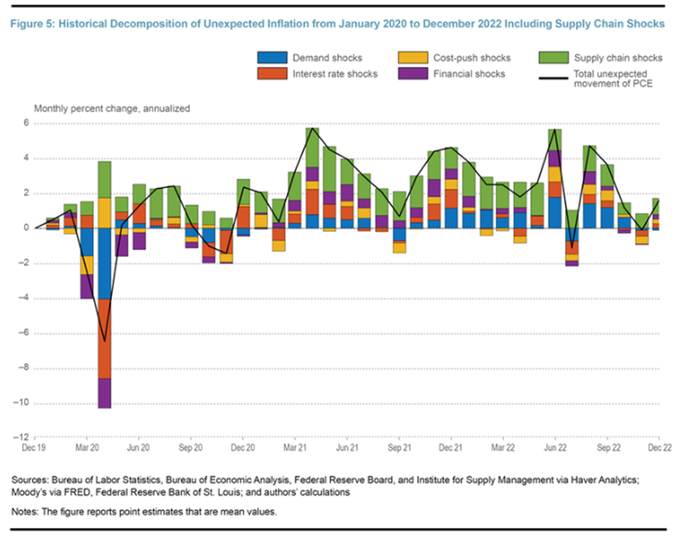
Bernanke and Blanchard find only a tiny fraction of the inflation surge is due to demand (i.e. v/u). An outsized impact due to oil.
35
202
582
Inflation is declining—despite a strong labor market—because supply chains are improving.

18
87
315
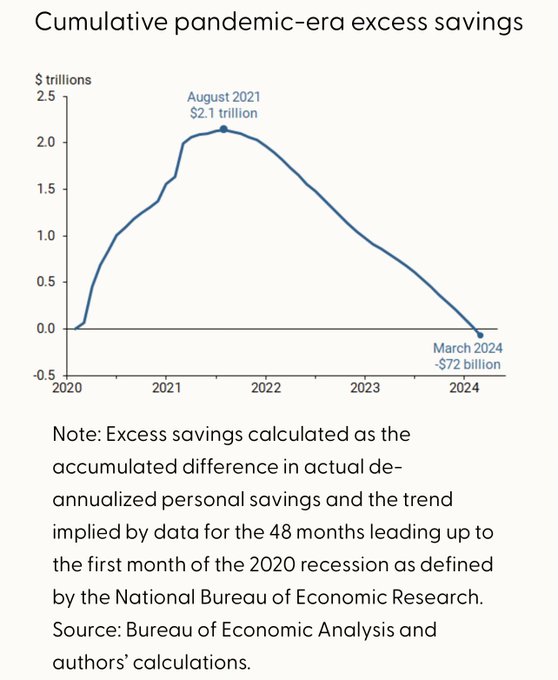
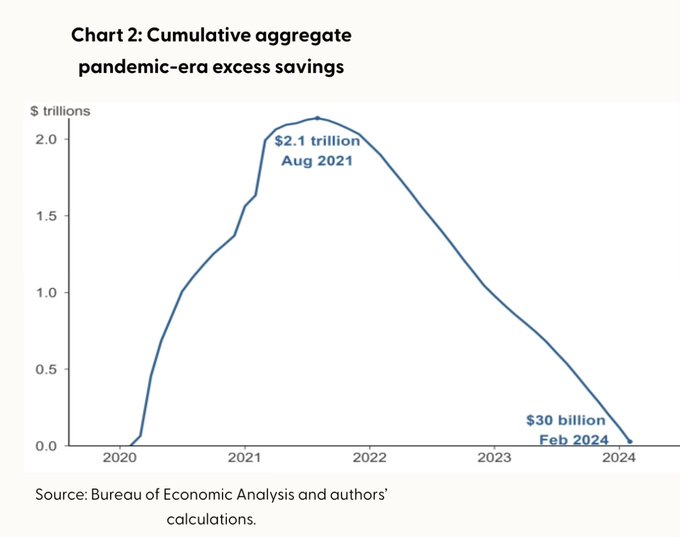
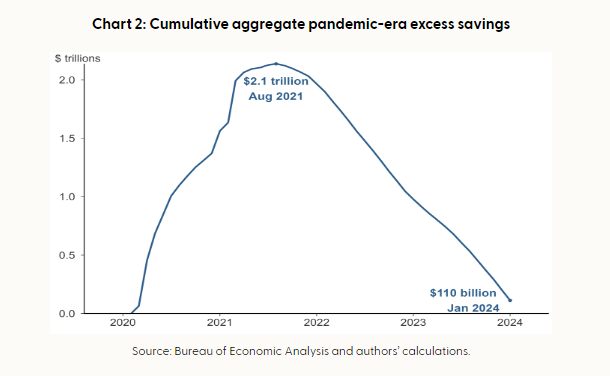
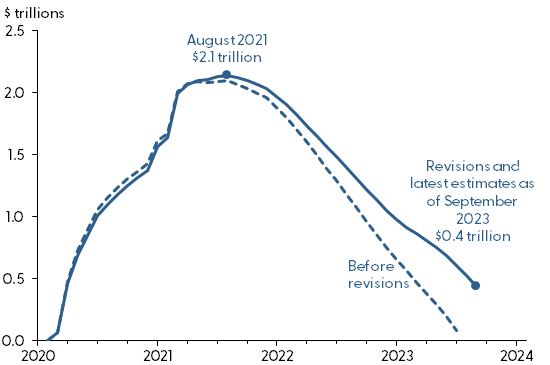
Excess savings are now depleted according to the
@sffed
measure.
Future consumer spending growth relies on “continuous employment or wage gains, other forms of wealth”
write Hamza Abdelrahman and Luiz Oliveira
13
96
314
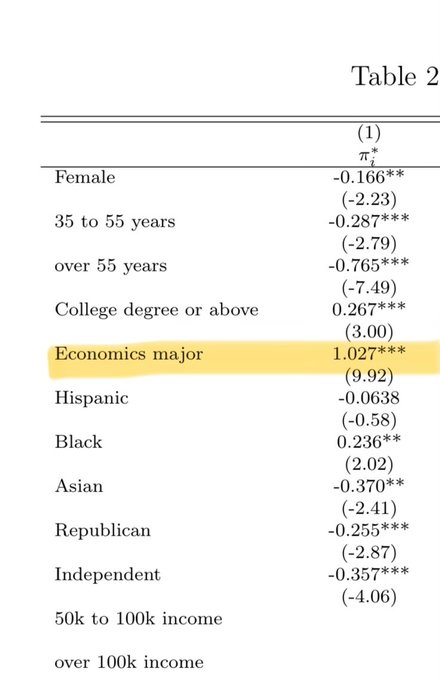
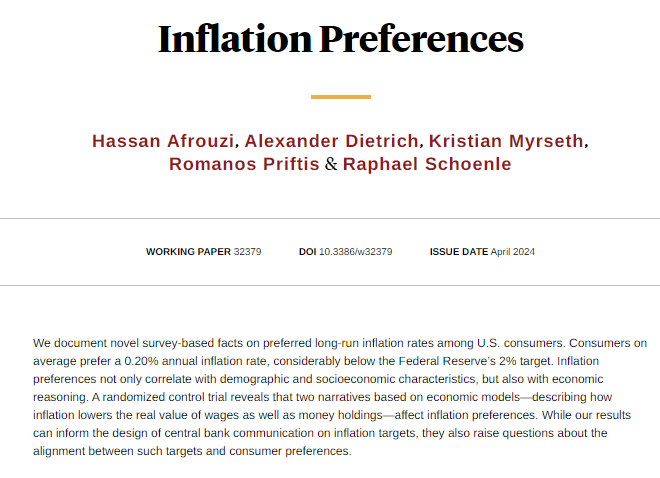
Really interesting survey!
Looks like economics majors have much higher inflation preferences

16
29
308
In an interview with
@kairyssdal
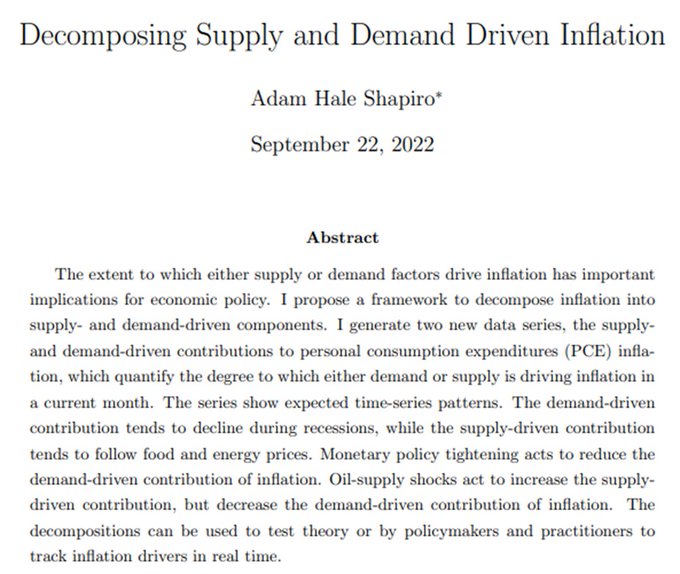
, Powell stated “What [the Fed] can control is demand, we can’t really affect supply with our policies” In a new paper I show that this is, to some extent, true:
4
51
255
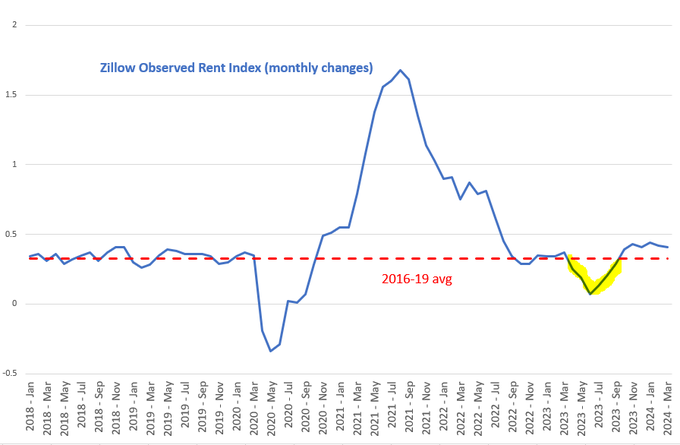
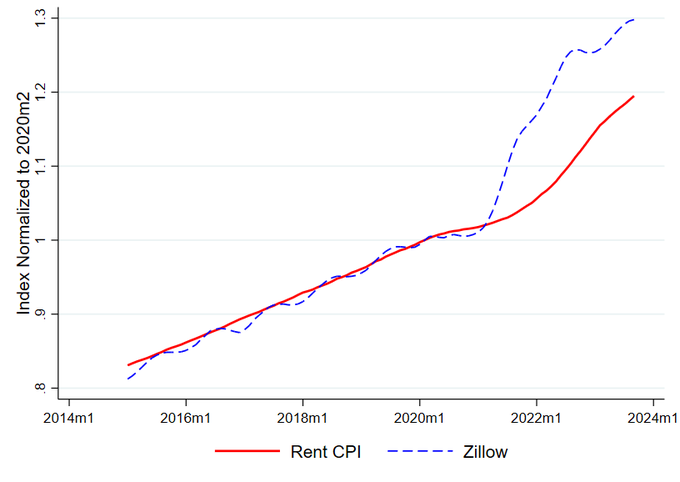
Any upcoming slowdown in rent CPI is now looking less promising
(data is updated to May)
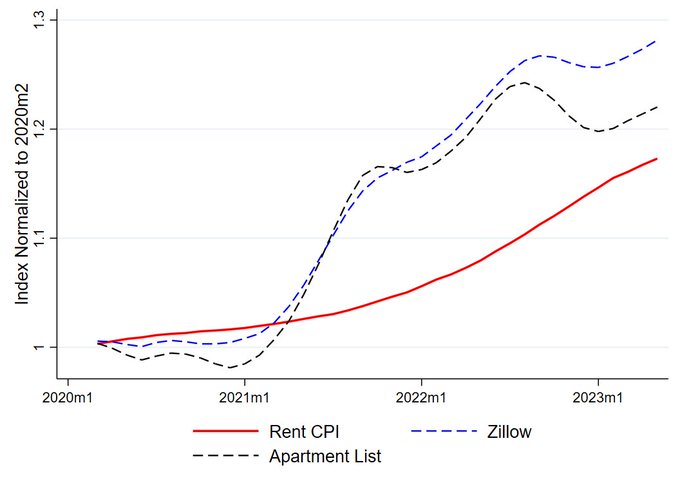
The rent CPI still has a lot of catching up to do to reach market rents.
On top of that market rents are showing some signs of reaccelerating. Implies at least a few more months of very high CPI rent inflation.
9
33
132
14
47
229
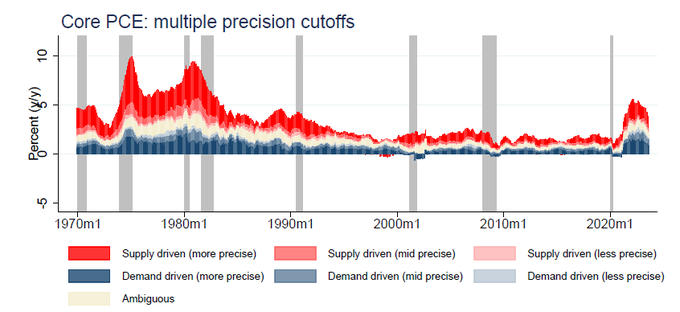
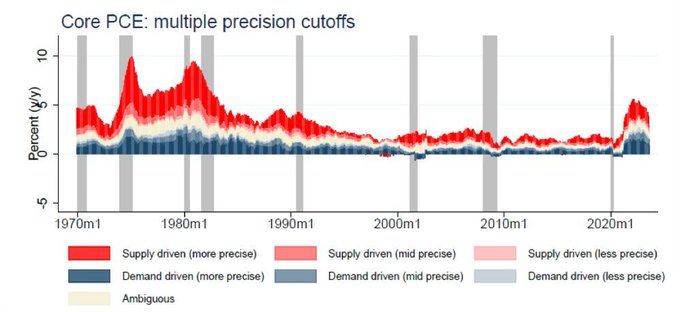
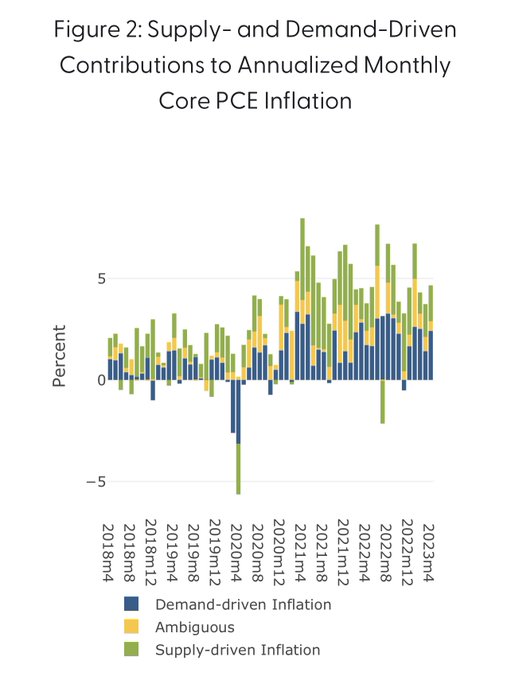
I've extended the supply & demand driven PCE inflation series back to 1969.
There are large differences between the inflation of the 1970s/80s and the recent surge. The 70s/80s was mainly supply driven (about 3/4 of core inflation) whereas the recent surge has been evenly split
7
70
226
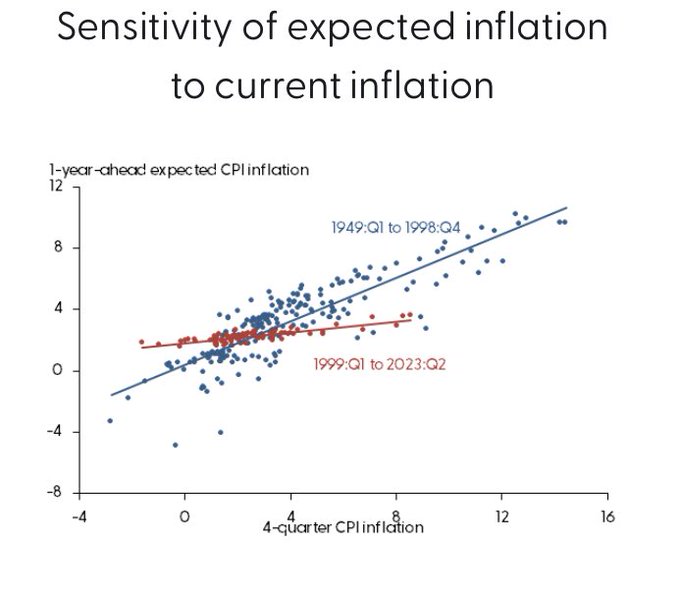
Inflation expectations became strongly anchored in the early 2000s
9
46
202
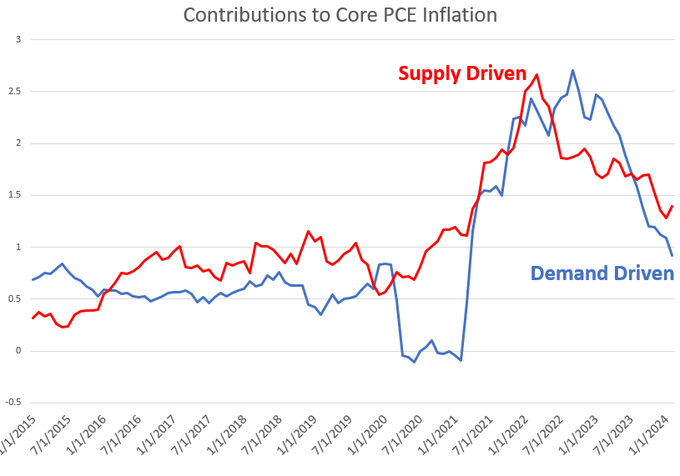
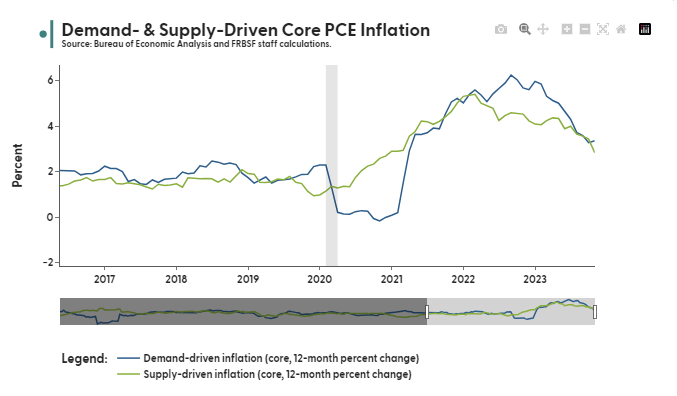
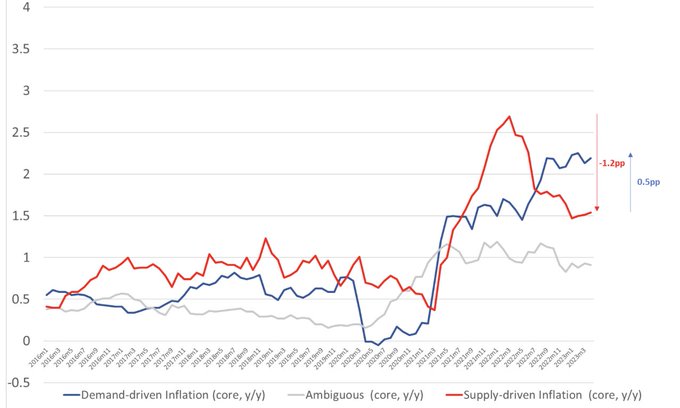
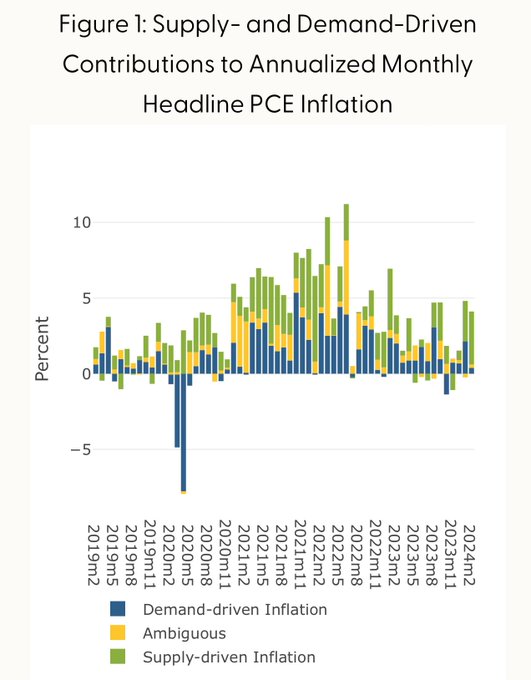
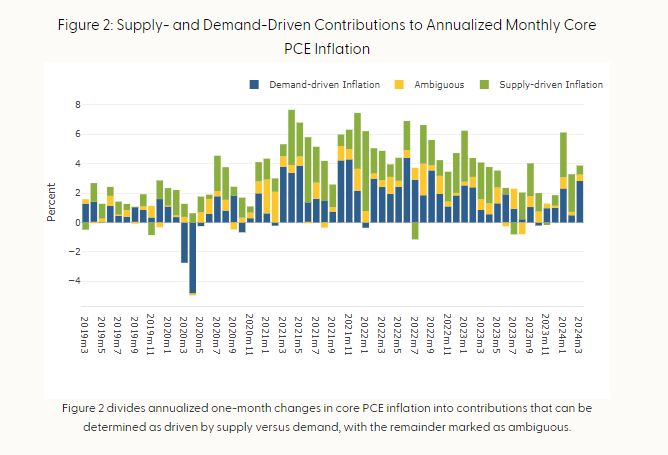
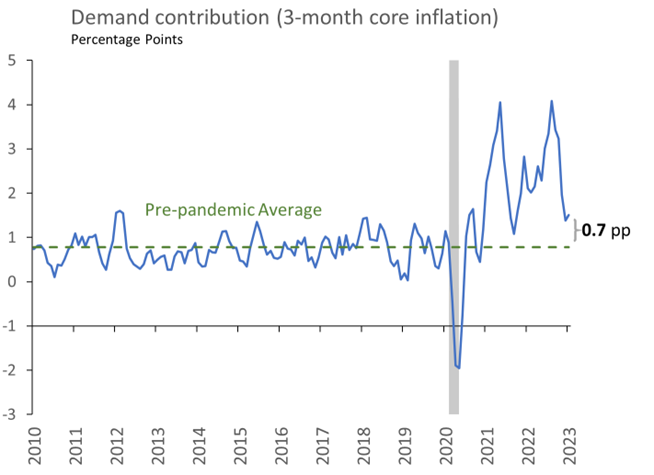
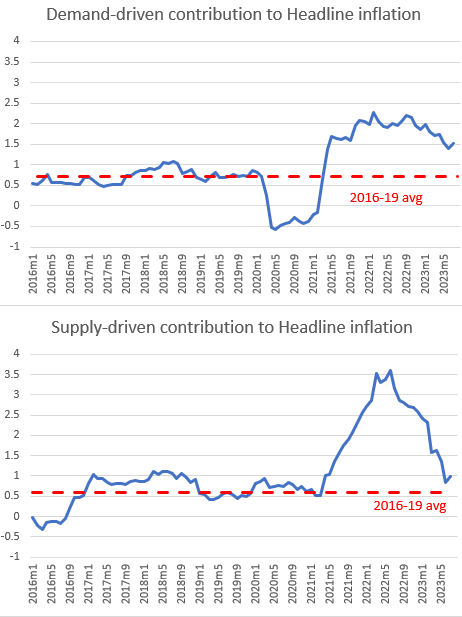
Demand-driven inflation fell dramatically over 2023.
Inflation went from being mainly demand driven in early 2023 to mainly supply driven in early 2024.
7
48
196
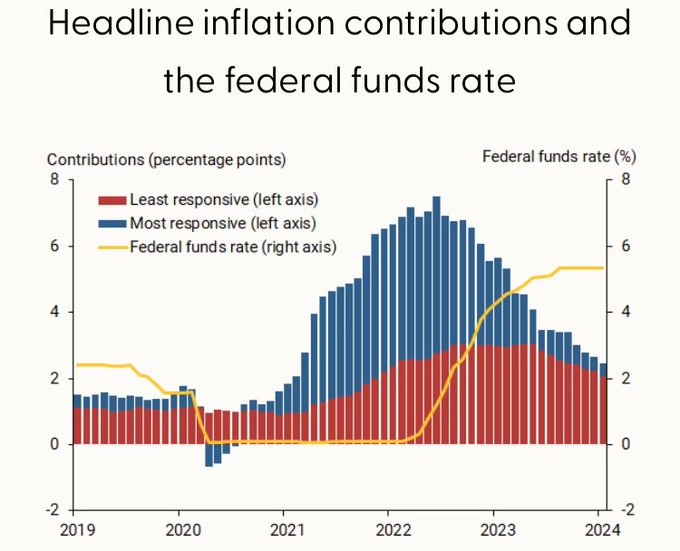
Leila Bengali decomposes inflation into interest-rate responsive and unresponsive categories. (whether each inflation category has historically declined after a surprise interest rate hike)
Current excess inflation is entirely due to the unresponsive categories.
5
45
186
The disinflation over the past year is not just a supply phenomenom.
Cooling demand has been a major contributor. 2/3 of the decline in core inflation over the past year is due to the demand component.
11
52
179
Core PCE inflation is down 0.7pp from its peak in Feb 2022. This entire decline in inflation is due to easing supply factors. In fact, demand pressures have been going up, counteracting this disinflationary process.
9
51
169
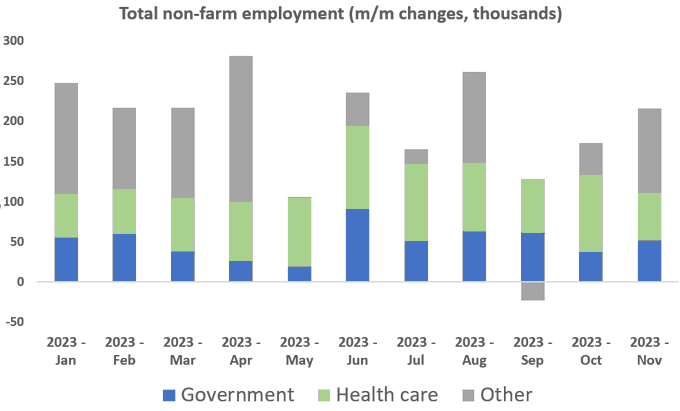
Of the 2.7 million jobs created in 2023, 60% were in government and healthcare---typically acyclical industries.
Close to 1m health care jobs were created in 2023
15
50
162
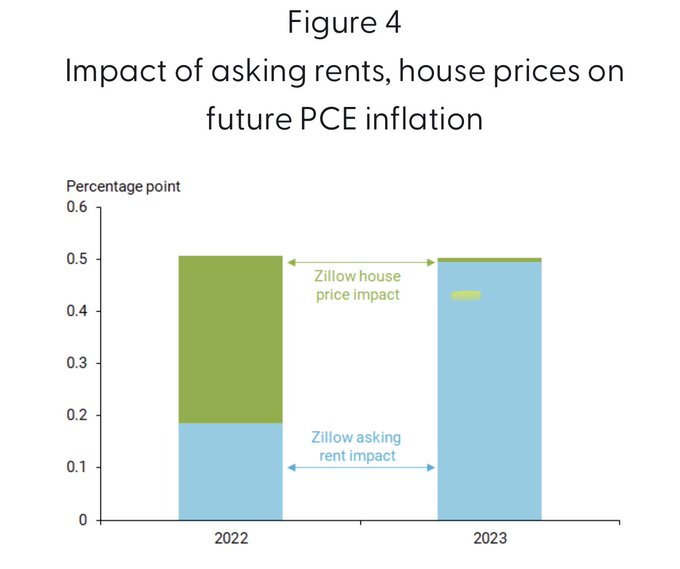
Shelter inflation is likely to be pushing up overall inflation for at least two years
7
23
140
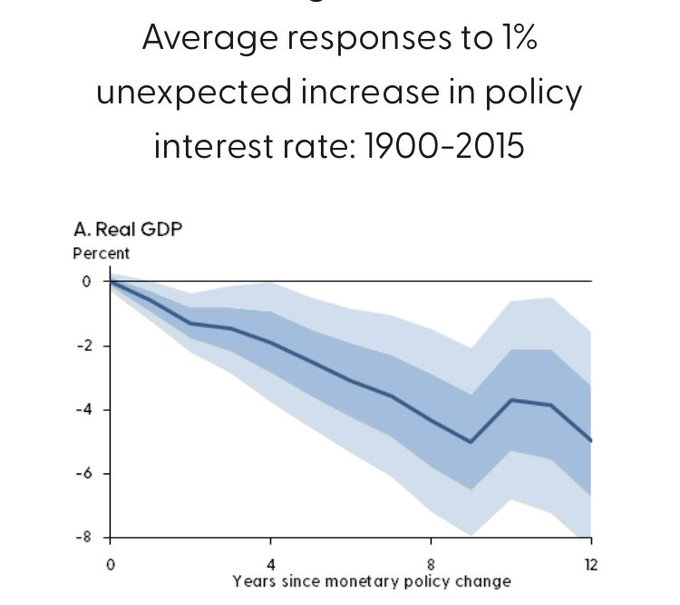
Very very very very long lags of monetary policy found by
@sanjayrajsingh
, Oscar Jorda, and Alan Taylor
6
30
140
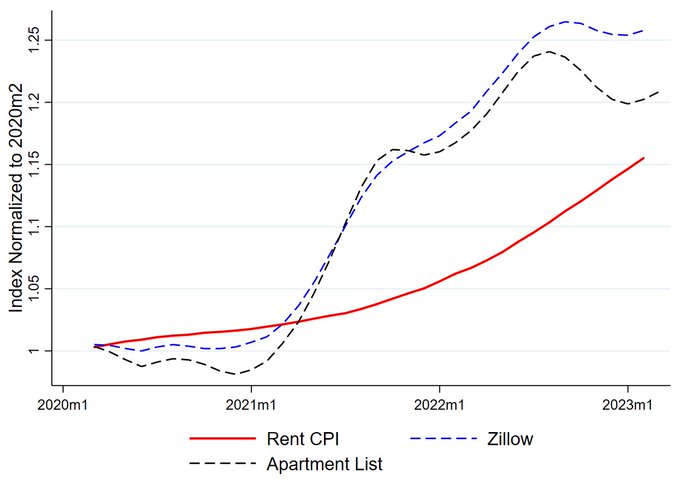
The rent CPI still has a lot of catching up to do to reach market rents.
On top of that market rents are showing some signs of reaccelerating. Implies at least a few more months of very high CPI rent inflation.
9
33
132
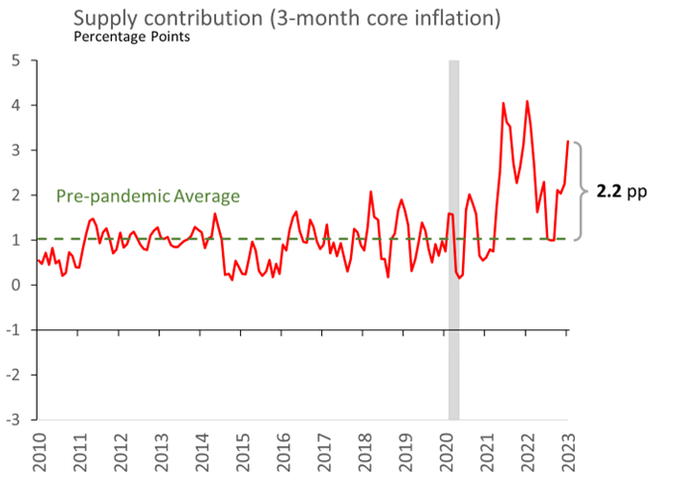
The elevated inflation readings over the past two months have been mainly supply driven
3
24
125
Gordon and Clark (Cleveland Fed) have a similar finding, showing an exceptionally large role for supply factors:
1
28
123
An important note linking theory to empirics by
@Petrosky_Nadeau
and Kevin Lansing.
The shape (ie convexity) of the Beveridge curve has implications for the shape of the Philips curve and the prospects for a soft landing.
2
18
119
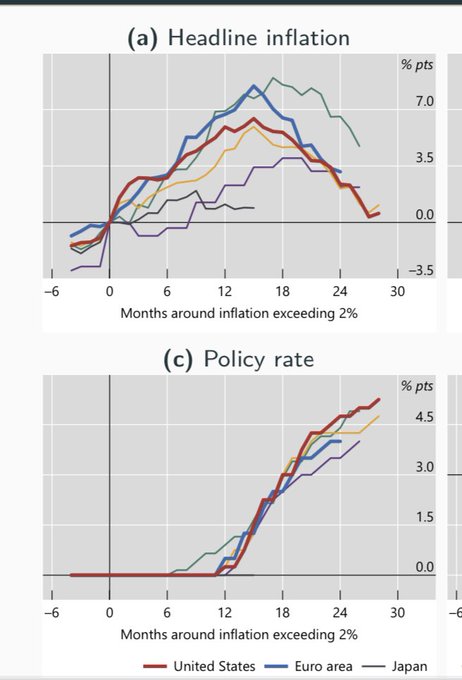
Fantastic chart showing the synchronization in policy rates across countries
Presentation from Fiorella De Fiore (BIS) at a recent Reserve Bank of Australia conference
4
34
116
This is not great inflation news: the disinflation in market rents proved to be really short lived
Recent high CPI rent inflation should (still) not be surprising.
The gap between market rents and paid rents peaked in July 2022 at 15pp, and has since closed to 8pp.
The rate at which paid rents (CPI) catches up to market rents is what we see as CPI rent inflation.
10
14
105
13
34
113
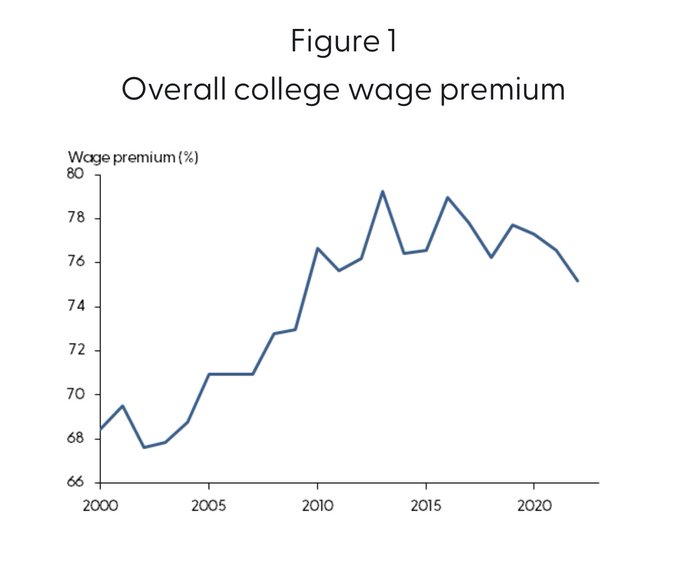
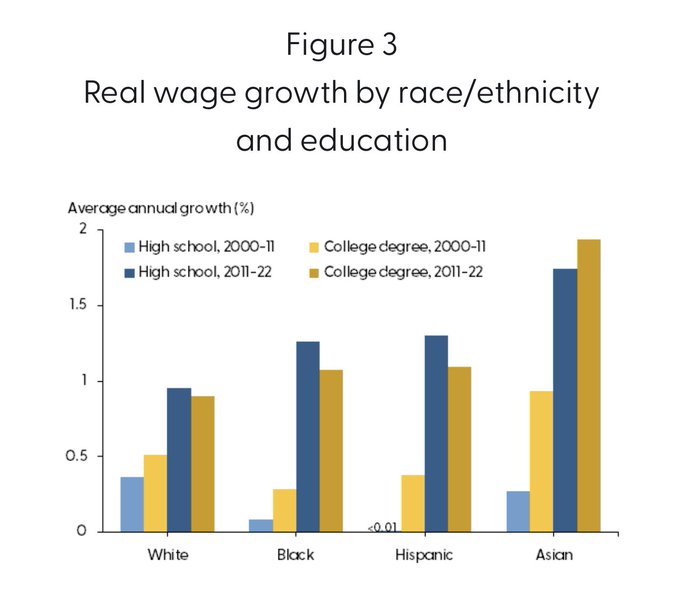
The college wage premium—the extra amount earned from a college degree—has remained stagnant over the last decade.
This was driven by high school wages catching up to college wages (as opposed to overall wages remaining flat)
2
26
112
Replication code for “Decomposing Supply and Demand Driven Inflation”
I'm also now posting my replication code for anyone interested in the details
2
3
33
3
14
113
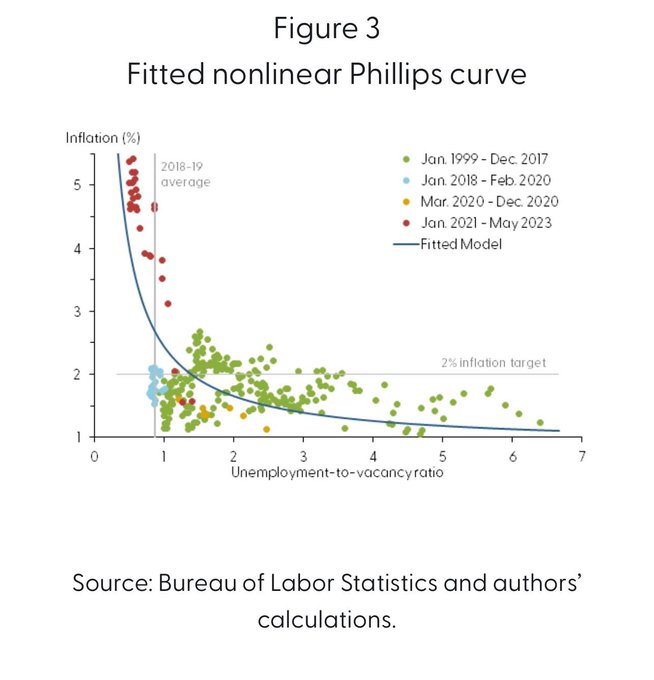
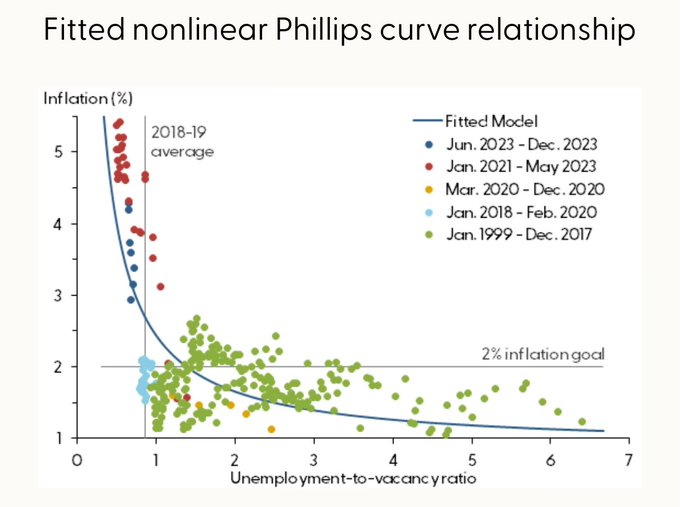
“New data covering the period since May 2023 have continued to follow the path of a nonlinear Phillips curve”
@Petrosky_Nadeau
Kevin Lansing
3
32
110
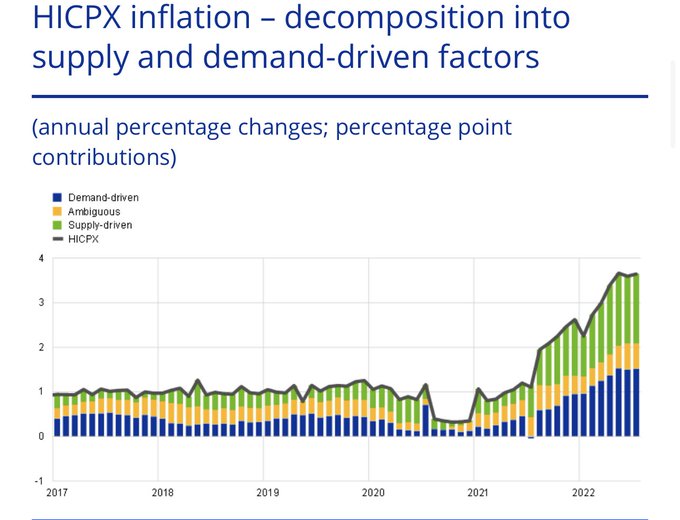
The ECB has done a nice replication of the supply and demand driven components of EA inflation. Although it has slowed recently, demand is responsible for a large portion of Euro inflation
7
24
110
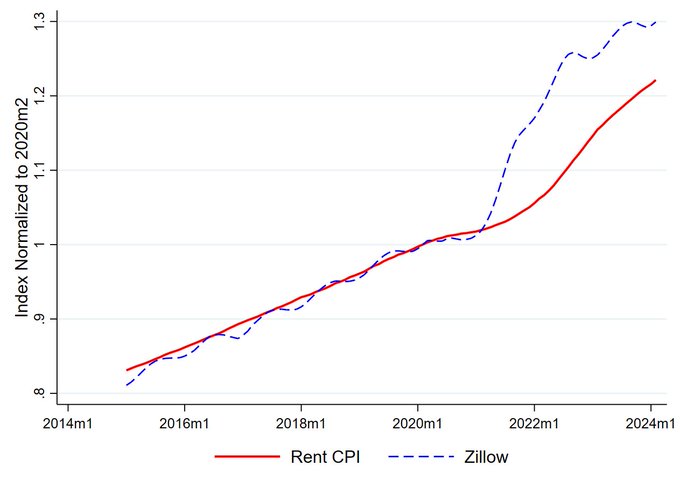
Recent high CPI rent inflation should (still) not be surprising.
The gap between market rents and paid rents peaked in July 2022 at 15pp, and has since closed to 8pp.
The rate at which paid rents (CPI) catches up to market rents is what we see as CPI rent inflation.
Today's high rent CPI number (0.5m/m, 6%ar) is not too suprising.
There still remains a 10pp gap between market rents (the flow) and the CPI rent price level (the stock)--meaning the rent CPI has to outpace market rents by a cumulaitve 10 pp sometime in the future to catch up.
5
3
36
10
14
105
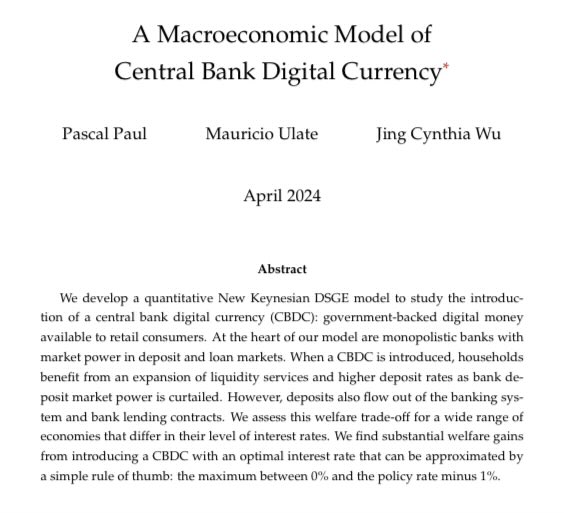
Interesting paper by my colleagues
@pascalpaul
and Mauricio Ulate showing significant welfare gains from introducing a CBDC
1
31
106
Consumer spending has gradually fallen slightly below trend
11
17
100
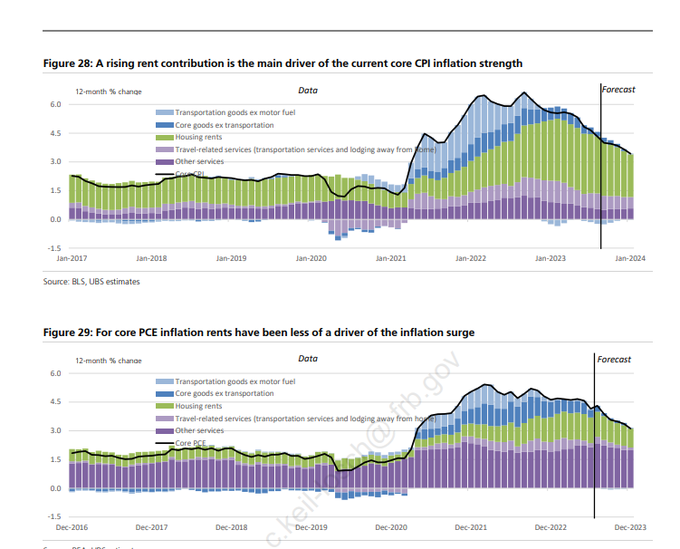
Rent inflation overwhelms the CPI inflation measure.
Chart from UBS
4
17
93
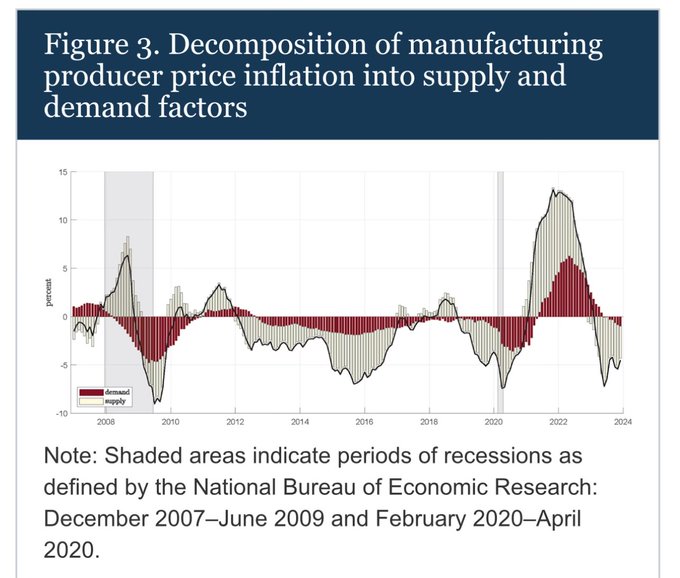
Analysis by Board economists Robin Braun, Aaron Flaaen and Sinem Hoke show that the decline in producer price inflation (ppi) over 2023 was due to both increasing supply and diminishing demand
1
25
94
Supply factors explain the bulk of today's large PCE inflation number. About 2/3 of current excess core inflation (3-month percent change) is attributable to supply factors:
2
32
92
Historically, monetary policy tightening (including forward guidance) has acted to reduce the demand component of inflation
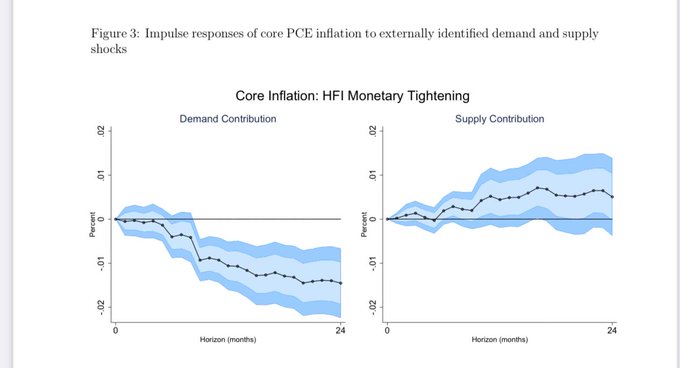
The disinflation over the past year is not just a supply phenomenom.
Cooling demand has been a major contributor. 2/3 of the decline in core inflation over the past year is due to the demand component.
11
52
179
1
27
92
Pandemic-related “excess” savings are now pretty much gone.
Going forward it will be more up to the labor market to keep consumption growth strong.
6
28
92
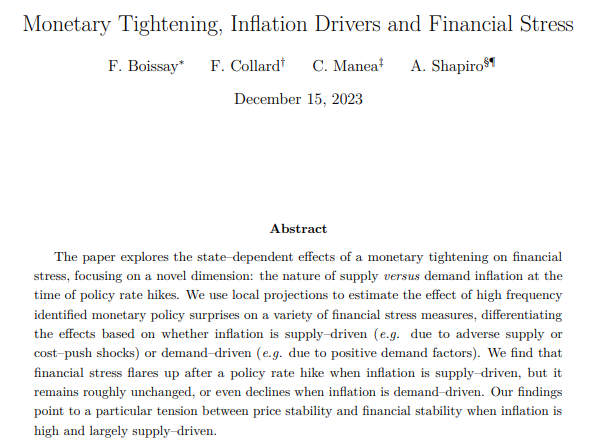
New working paper with Frederic Boissay, Fabrice Collard, and Cristina Manea
The impact of monetary policy tightening on financial markets depends on whether inflation is being driven by supply or demand.
1
17
89
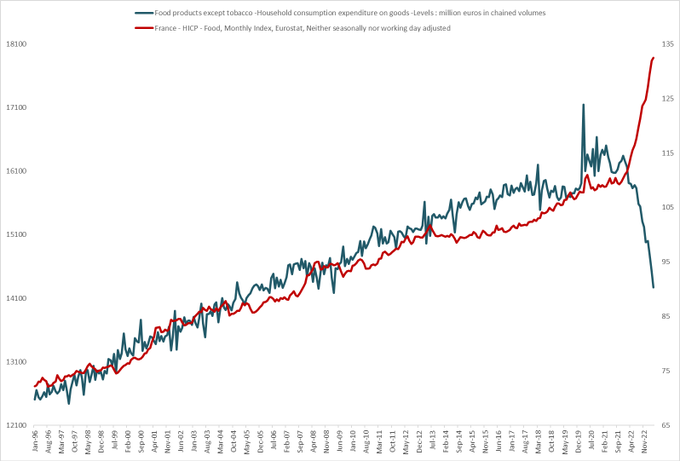
If anyone wants to know what a supply shock looks like

France
Food Price Index & Food Consumption (volume)
16
90
232
3
22
89
The final version of our paper on the costs of administrative hassle in the healthcare system is now available.
Physicians lose 18% of Medicaid revenue to billing problems.
Physicians are more apt to refuse to accept Medicaid in those states with more severe billing hassle.

Recently accepted by
#QJE
, “A Denial a Day Keeps the Doctor Away,” by Dunn (
@AbeDunn3
), Gottlieb (
@GottliebEcon
), Shapiro (
@ah_shapiro
), Sonnenstuhl (
@dj_sunchair
), and Tebaldi:
1
51
145
3
18
87
In terms of headline PCE inflation, the supply shock is mainly behind us.
The contribution of supply-driven inflation to overall inflation is very close to its pre-pandemic level.
5
22
86
Rent prices drive most of the gap between cpi and pce
3
15
80
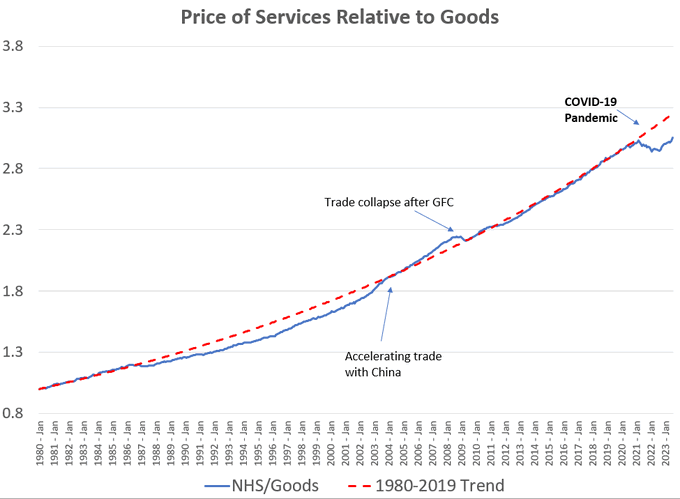
The relative prices of services/goods is well below pre-pandemic trends.
Three possibilities:
- Service prices have some catching up to do
- Goods prices have more disinflation to do
- The pre-pandemic trend is no longer relevant ( the goods market has fundamentally changed)
8
18
83
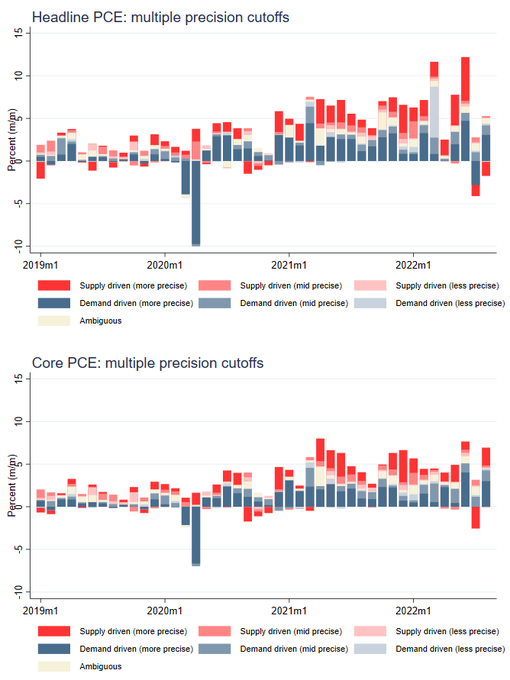
Here is today's August PCE release shown in "multiple precision labeling." This shows a bit better how the supply side factors are coming off headline. Still a lot of positive dark blue in Aug though---on both headline and core.
Data:
9
33
84
Further evidence that monetary policy tightening reduces demand-driven inflation by IMF economists Melih Firat and Otso Hao
This is the average response of a 100bp tightening across 22 countries which includes both time and country fixed effects.
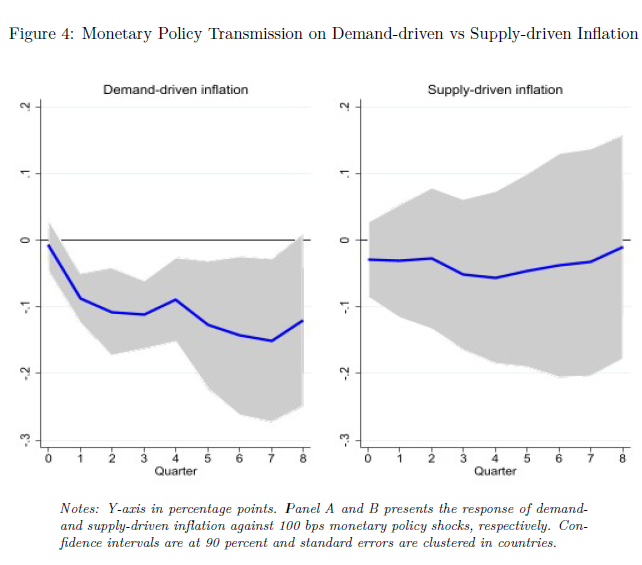
Historically, monetary policy tightening (including forward guidance) has acted to reduce the demand component of inflation
1
27
92
4
28
82
An update on the recent
@sffed
analysis by Hamza Abdelrahman and Luiz Oliveira:
$100B further drawdown of excess savings in April. Spending was revised up in Q1, so an overall change of $150 in drawdowns from their last estimate.
8
25
82
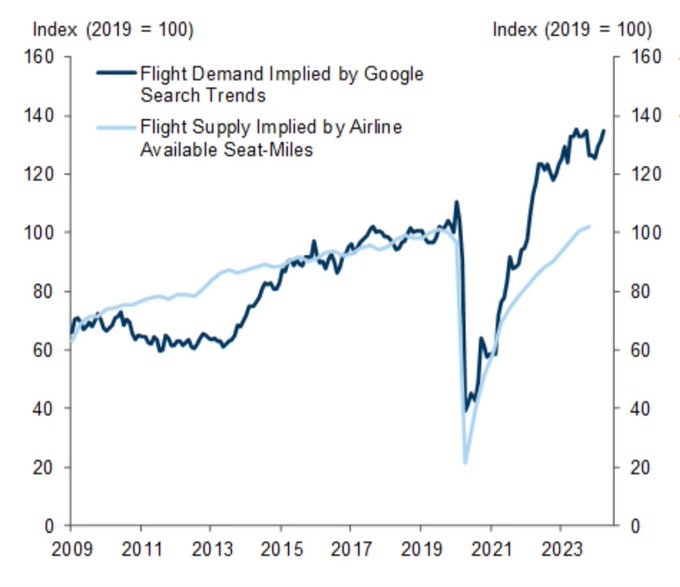
Very interesting use of google trends data by GS.
Airline demand seems to be far outpacing supply
5
15
82
Waller gave an interesting hypothesis as to why we are seeing higher inflation with little change in labor market tightness:
firms are adjusting prices more frequently
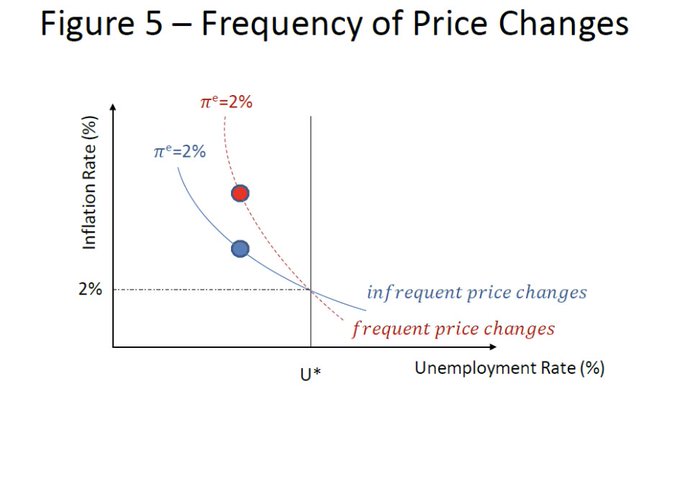

Speech by Governor Waller on the unstable Phillips Curve:
Watch live:
21
19
96
3
12
81
The
@sffed
is now providing data available for download on the contributions to PCE inflation by broad category (goods/housing/services ex housing)
This also includes a breakdown of "supercore" into its subcomponents
3
22
81
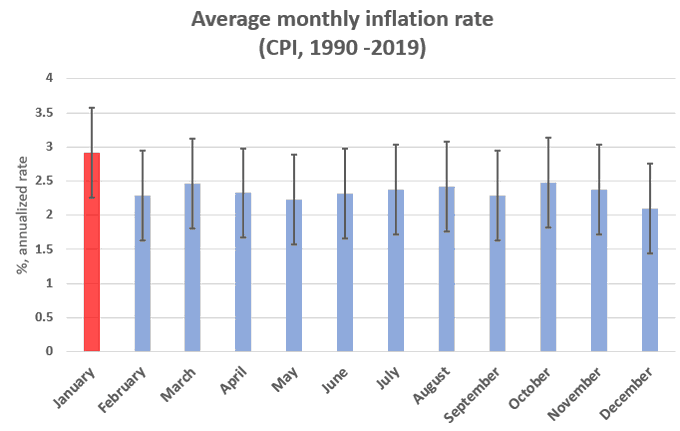
Although the BLS seasonally adjusts the CPI data, there remains some residual seasonality in the inflation numbers.
January tends to be higher than the other months.
(95% confidence bands shown)
3
16
79
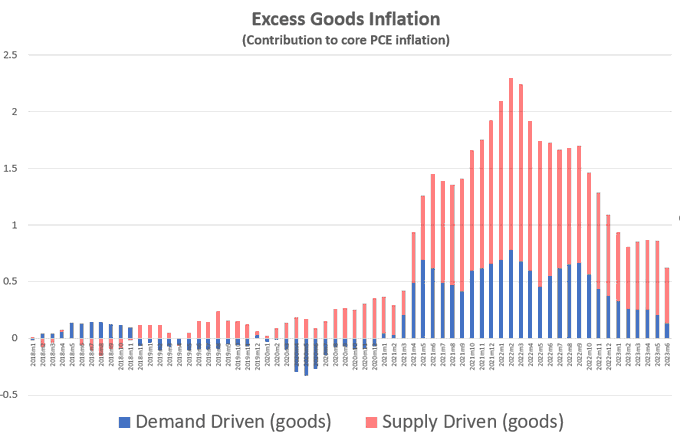
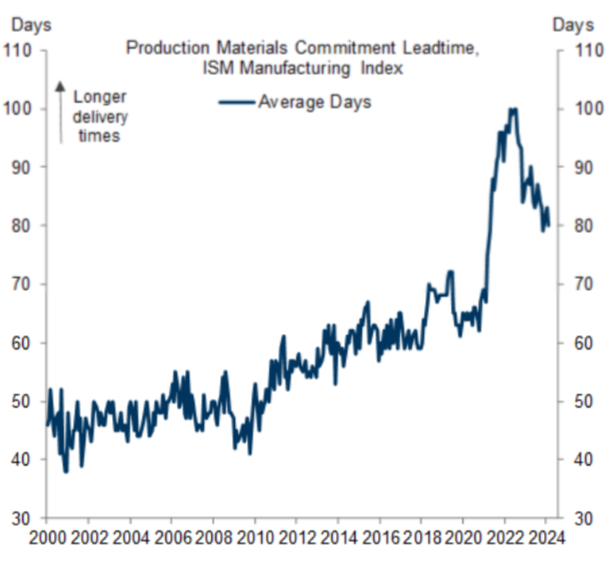
Supply chains are not healed yet. Quite the persistent supply shock!
(chart from GS)
Goods are currently contributing 0.6pp more to core PCE inflation than they were in the 2016-2019 period (ie, excess inflation).
Since peaking in Feb 2022, the supply-driven contribution has declined by 1pp and the demand driven contribution has declined by 0.5pp.
2
8
46
4
18
79
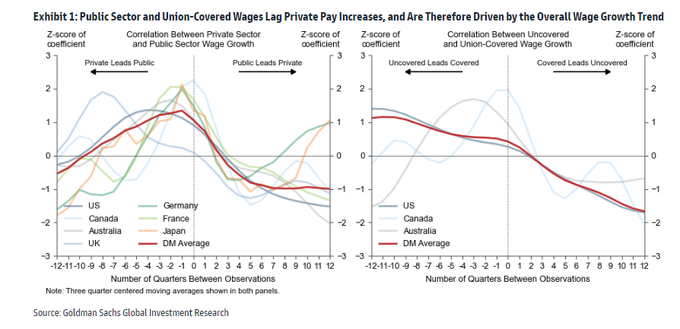
GS finds that union wages lag private wages
Overall wages lag price inflation, so union wages are the last to follow...hence strikes ensue
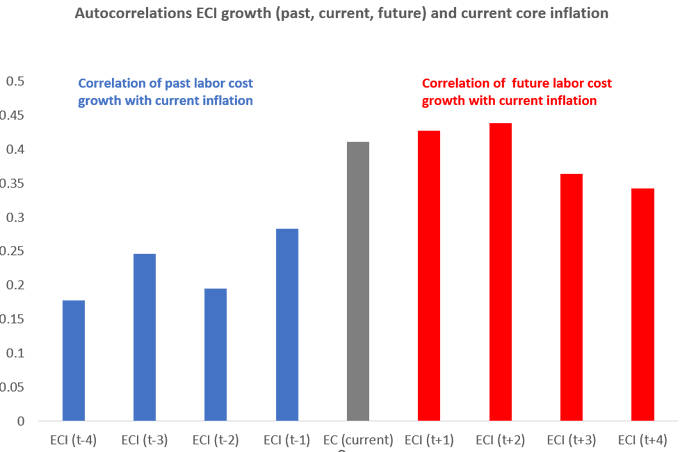
Here's a simple autocorrelation chart showing the lead/lag relationship between labor cost growth and inflation.
Current inflation leads future labor costs, or in other words, labor cost growth tends to lag behind inflation readings
6
18
66
4
21
77
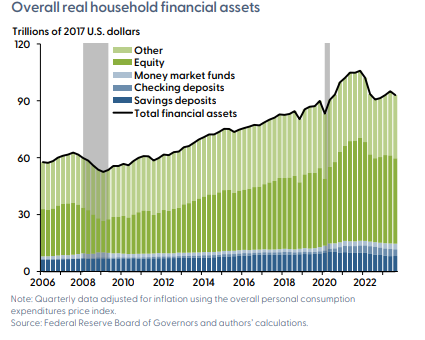
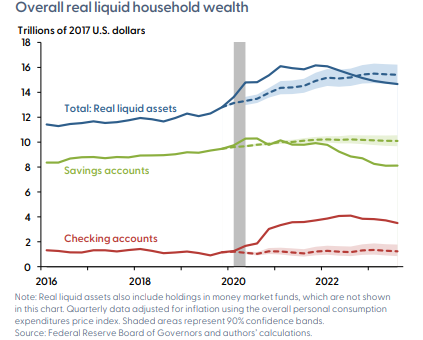
This is part of the reason why economists don't track the "money supply" (eg,M1/M2) when trying to understand inflation dynamics. Assets all have varying degrees of "moneyness." The equilibrium interest rate determines where people park their assets (liquid vs less liquid)
Checking accounts are well elevated, but make up only a tiny sliver of overall household net worth:
2
3
18
3
13
76
We tracked FOMC participants’ views on their preferred inflation target from the transcripts. Most participants favored 1.5, until the GFC hit..
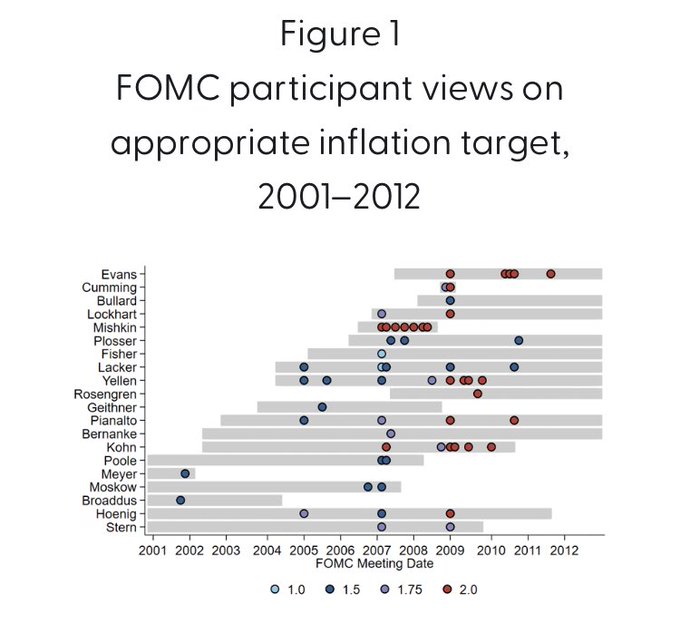

Who set the Fed’s 2% target rate? Why is it sacrosanct as opposed to setting it at 3% given the modern need for strategic reshoring, decarbonization, and wage increases for the working class? Would love Econ Twitter to chime in why we can’t land the plan softly at 3 percent.
356
165
1K
1
15
74
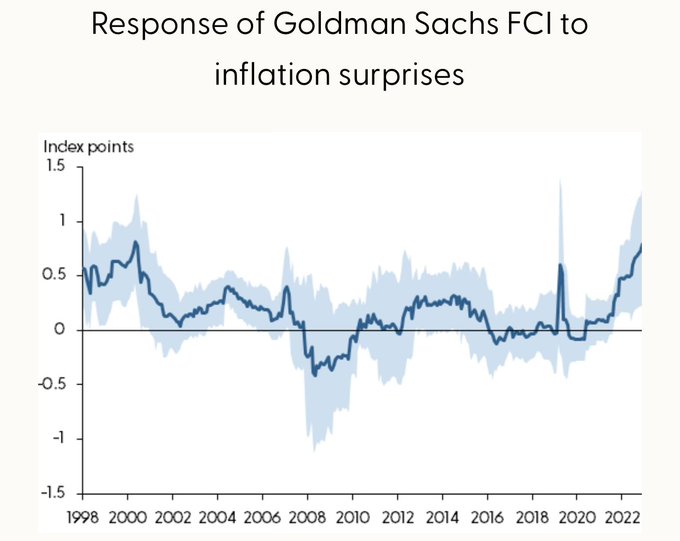
Financial markets have become increasingly sensitive to inflation releases
New Economic Letter from
@michaelbauer_hh
1
18
74
Given the recent credit tightening seen from regional banks, I thought I’d share some insights from a recent paper I wrote with Rhys Bidder and John Krainer published in RED. We examined credit tightening that took place in 2014 from bank exposure to the oil price declines. 1/n
2
16
71
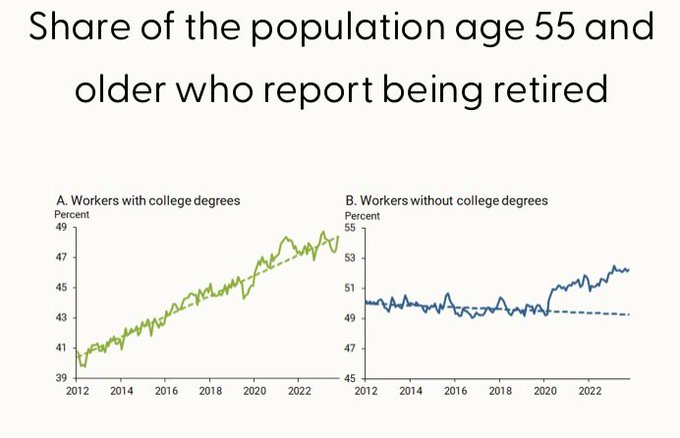
This chart by
@Petrosky_Nadeau
is striking. The pandemic caused a dramatic shift in retirements, but only for those w/o a college degree
3
16
68
Here's a simple autocorrelation chart showing the lead/lag relationship between labor cost growth and inflation.
Current inflation leads future labor costs, or in other words, labor cost growth tends to lag behind inflation readings
6
18
66
This persistence in housing inflation was forecastable at least two years ago
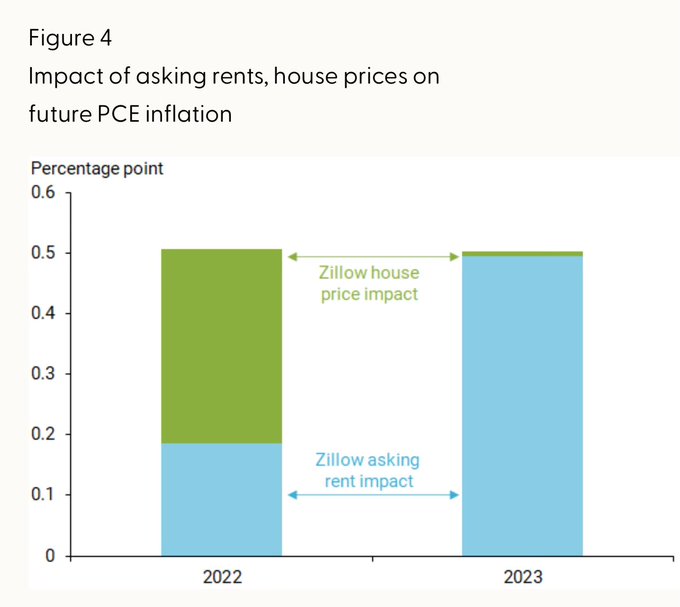
1
5
63
November 2022 was the lowest demand-driven core inflation reading since September 2021
2
11
61
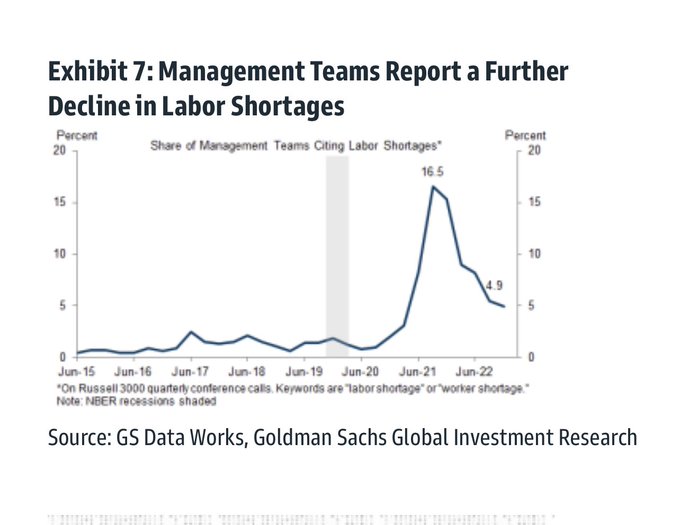
Very neat data source: the fraction of times that “labor shortage” or “worker shortage” is mentioned in publicly traded quarterly conference calls. Looks promising
4
9
62
Interesting take by Goldman Sachs on the increase in layoffs
2
10
60
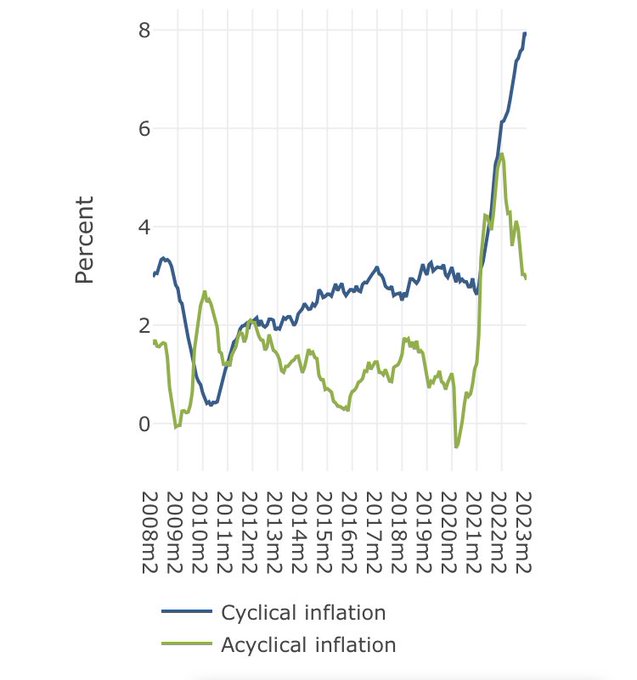
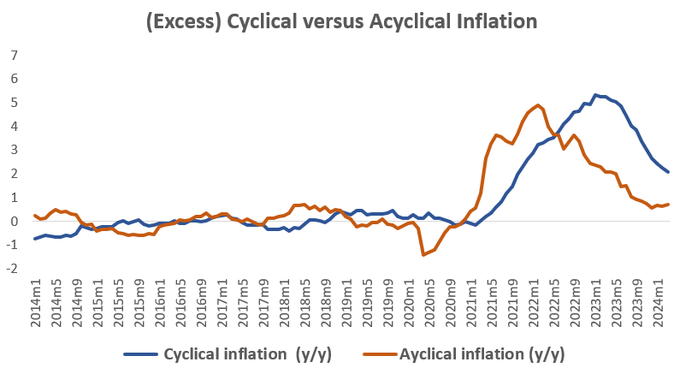
Cyclical inflation has risen to historical highs.
Unless the labor market starts to loosen, we can expect this inflation component to remain elevated
7
11
61
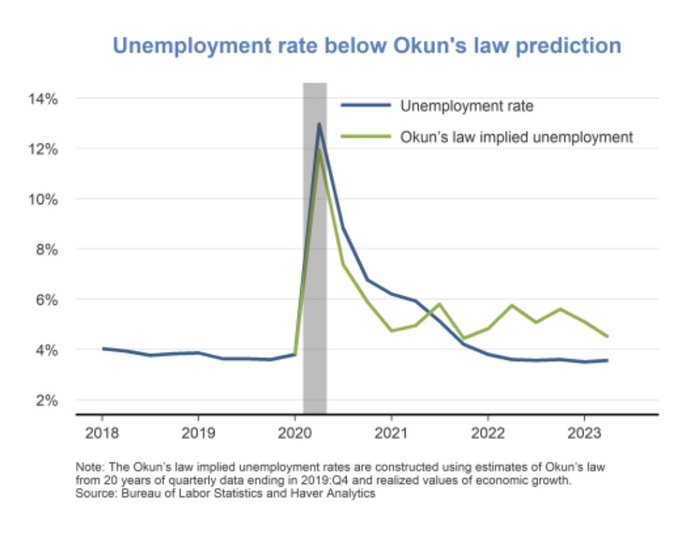
The labor market is stronger than that would be implied by GDP growth (ie Okun’s law)—evidence of labor hoarding.
FedViews by Sylvain Leduc
1
11
58
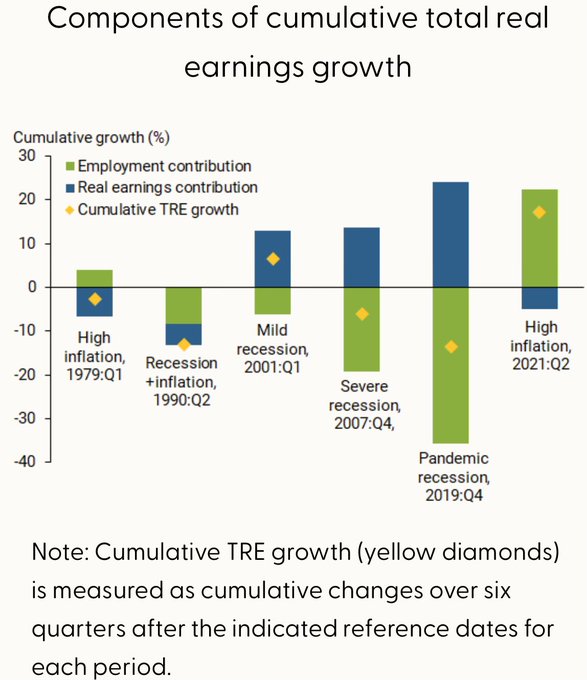
Total real earnings actually increased during the inflation surge in 2021. This is in stark contrast to the stagflation period in 1979
@sffed
letter by Leila Bengali and Genya Duzhak
2
19
54
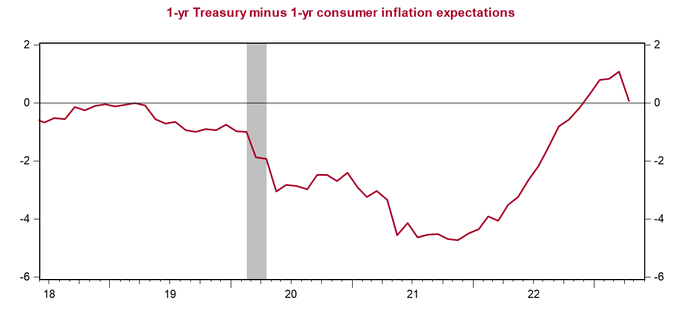
The 1-year real interest rate has climbed to 2%.
It hasn't hit this level since early 2007.
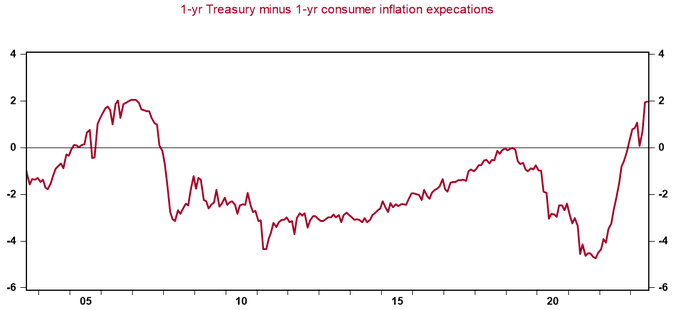
A good measure of the current real rate of interest (in my opinion) is the 1-year treasury minus 1-year consumer inflation expectations (U of Mich).
It's showing that the current real rate of interest is about 0%
2
7
17
6
8
52
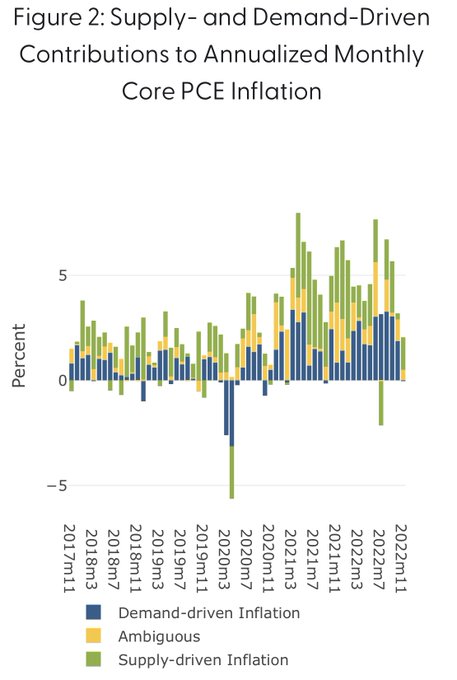
There's been a lot of talk about whether supply or demand factors are responsible for current elevated inflation levels. In this note, I discuss a method that divvies up the supply and demand contribution to inflation in real time (1/4):

2
8
53
The April PCE inflation release shows continued pressure from the demand side.
Consistent with uptick in real consumption, drawdown in savings, and elevated v/u
1
12
51
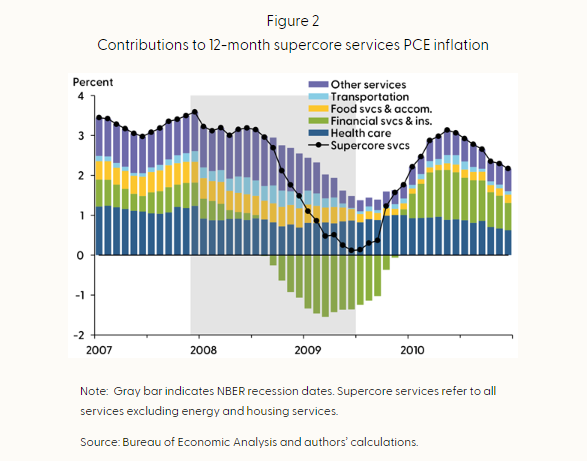
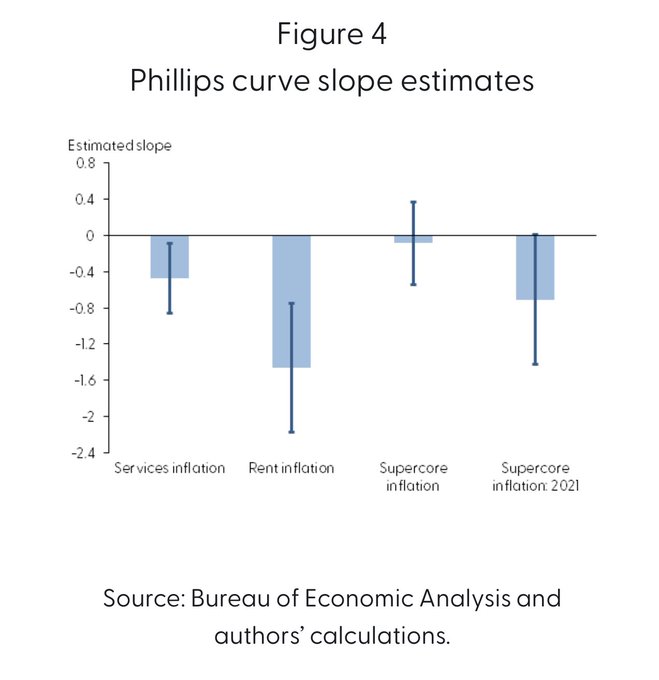
A great deal of inflation cyclicality stems from rent inflation. Non-housing services (super core) marches to the beat of its own drum.
Implies a slowdown in economic activity will ultimately be needed to bring rent inflation back to pre-pandemic levels
2
8
49
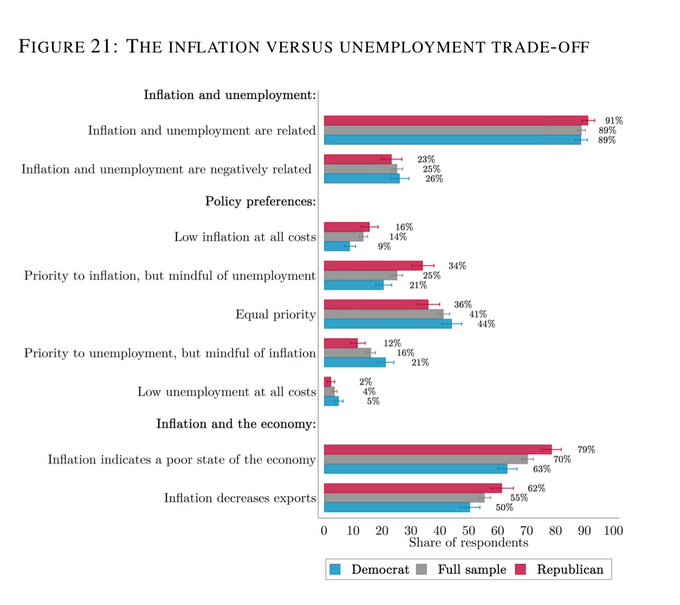
The public doesn’t believe in a Phillips curve, and tends to lean more hawkish
This and 30 other super interesting charts from
@S_Stantcheva
3
11
50
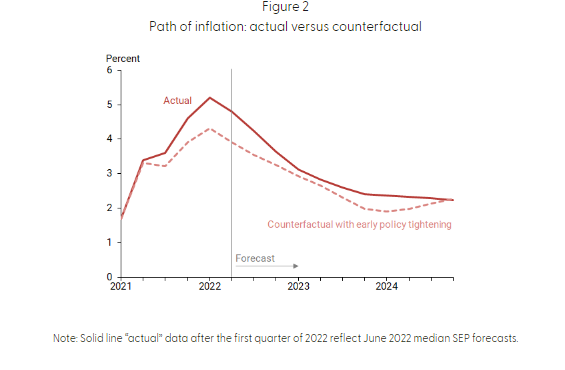
My colleague Regis Barnichon does a really interesting counterfactual exercise of where we'd be if the FOMC raised rates earlier in the cycle:
This is based on his work with Geert Mesters:
0
13
49
Thank you
@mredmond88
for inviting me to present at the
@NatlEconClub
!
I’m sharing some of the slides from today’s presentation about inflation drivers over the pandemic period
2
9
48
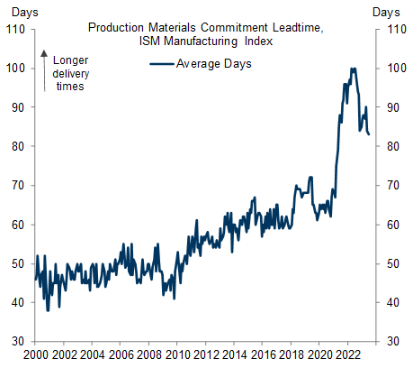
Manufacturing materials delivery times are still 10 days higher than pre-Covid times.
0
11
48
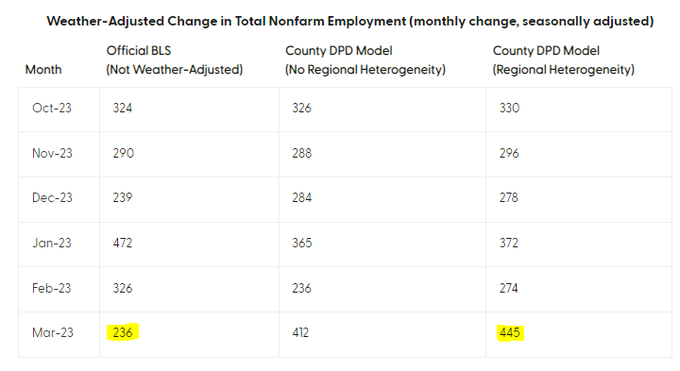
SF Fed's Weather Adjusted Employment (by
@wilson_daniel_j
) is showing that today's employment report was pushed down by over 200k jobs due to lagged weather effects.
Absent unseasonable weather patterns, today's number would have been over 400k according to the model.
3
15
47
Black and Hispanic workers saw especially large high-school wage gains
0
12
47
Goods are currently contributing 0.6pp more to core PCE inflation than they were in the 2016-2019 period (ie, excess inflation).
Since peaking in Feb 2022, the supply-driven contribution has declined by 1pp and the demand driven contribution has declined by 0.5pp.
2
8
46
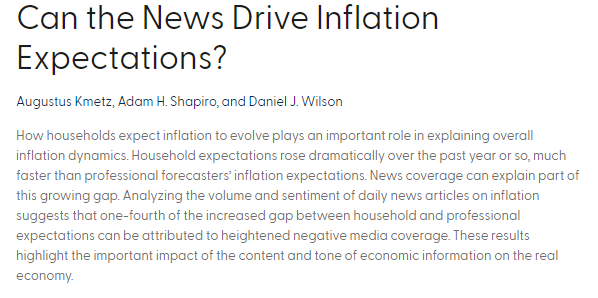
In a new Economic Letter, Gus Kmetz,
@wilson_daniel_j
and I find that the media's strong attention on inflation over the past year has played a significant role in raising household's inflation expectations:
2
8
46
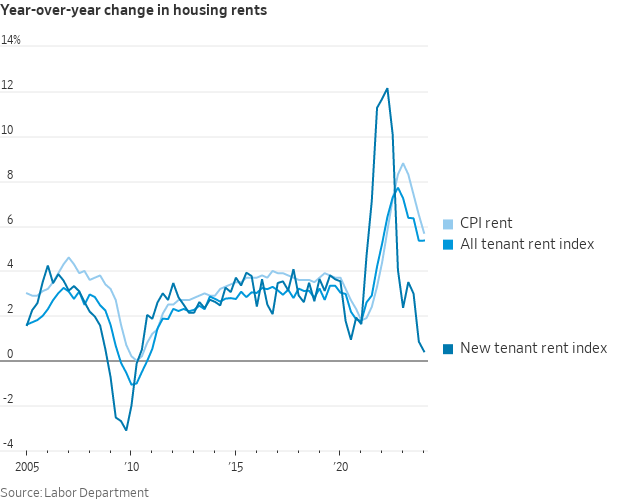
These rent indexes are certainly interesting, but I would take caution in using them for forecasting purposes.
The "All-tenant index" which includes new and old leases does not match the published CPI rent series very closely
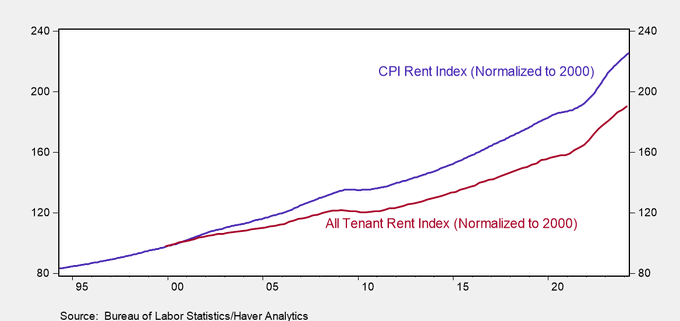

The BLS's experimental "new tenant rent index" fell again in early 2024, posting the smallest four-quarter increase (+0.4%) since 2010
But the "all tenant" rent index held steady in Q1, rising 5.4%, the same as Q4
35
96
488
6
7
43

A new Economic Letter with Hamza Abdelrahman and Luiz Oliveira. Excess real household total and liquid wealth diminished in late 2022.
Households continuously shifted assets from their savings accounts into their checking accounts to fund spending.
3
7
44
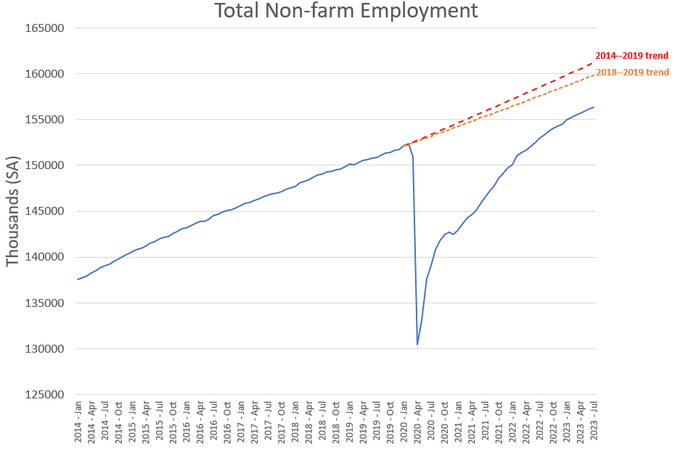
The labor market is certainly strong, but there is probably still some catching up to do. We're about 3 to 5 million jobs behind pre-pandemic trends.
Note that aging effects (boomers entering into retirement) would make this an upper bound.
5
10
42
Interest rate sensitive sectors explained half the variation in employment gains in 2023 (from Goldman Sachs)
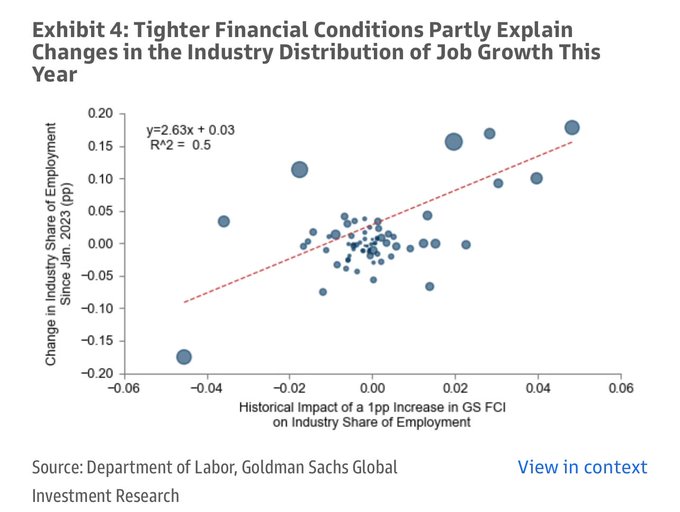
Of the 2.7 million jobs created in 2023, 60% were in government and healthcare---typically acyclical industries.
Close to 1m health care jobs were created in 2023
15
50
162
1
11
43
The breakdown of supply and demand inflation into goods, non-housing services, and housing services is now for download (it's a seperate tab on the excel file)
1
7
43
Kudos to the
@sffed
economics research department!
Mauricio Ulate,
@sanjayrajsingh
,
@JoanMonrasEcon
,
@pascalpaul
,
@michaelbauer_hh
, and
@MariannaKudlyak
all acknowledged in the top young economists list in the IDEAS ranking
2
5
41
The
@sffed
Research Department is taking applications for the 1-year visiting fellow position. A great way to meet the economists in our department and gain exposure to policy discussions
0
12
42
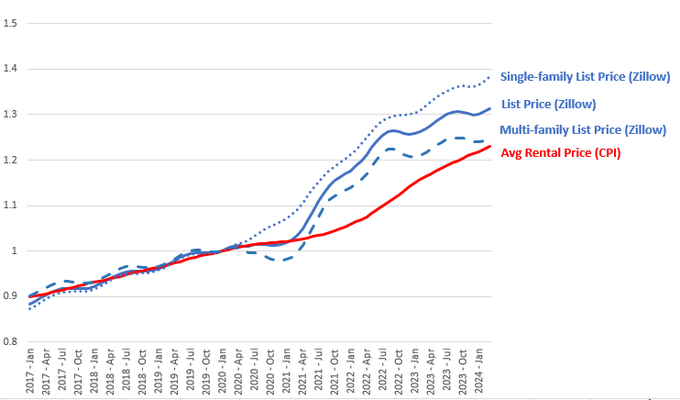
Multi-family list rents have been flat for a while but still lie slightly above the rent CPI.
Single-family list prices continue to surge.
The rent CPI is a mix of both structure types, and represents the amount paid by the tenant based on the lease agreement.
4
7
41
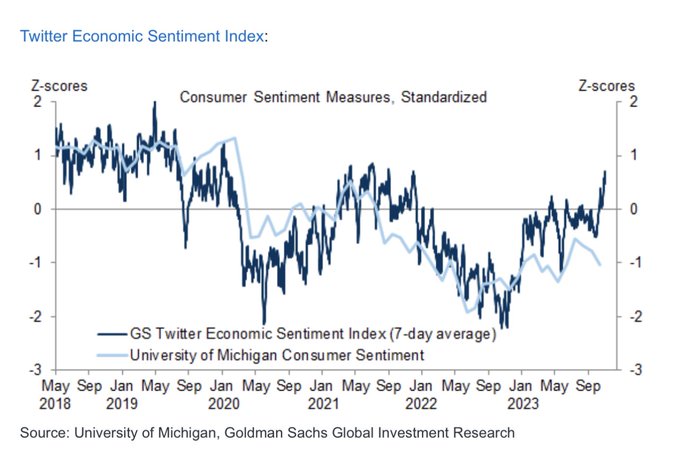
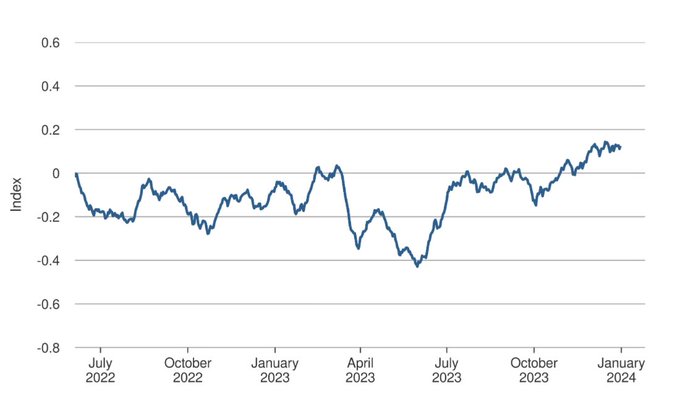
Economic news has been pretty chipper since bottoming out last summer
0
10
37
Isn’t this just the hybrid Phillips Curve from Gali/Gertler 1999?
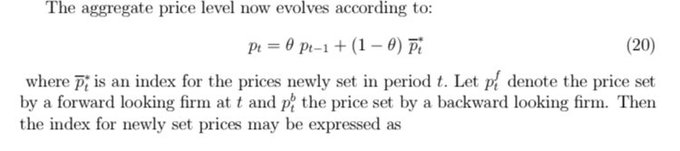

A picture, which I could swear I've circulated before, but can't find, shows "equilibrium", self-sustaining 10% wage inflation: 3/
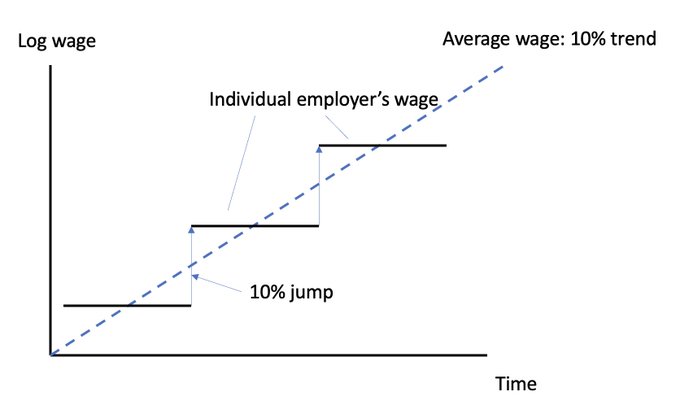
4
8
78
3
2
39
And likely to continue unless asking rents (new lease prices) decelerate
Today's high rent CPI number (0.5m/m, 6%ar) is not too suprising.
There still remains a 10pp gap between market rents (the flow) and the CPI rent price level (the stock)--meaning the rent CPI has to outpace market rents by a cumulaitve 10 pp sometime in the future to catch up.
5
3
36
1
2
38
The
@sffed
will be updating the excess savings measure monthly on the data indicators page, including data available for download.
2
4
38
Today's high rent CPI number (0.5m/m, 6%ar) is not too suprising.
There still remains a 10pp gap between market rents (the flow) and the CPI rent price level (the stock)--meaning the rent CPI has to outpace market rents by a cumulaitve 10 pp sometime in the future to catch up.
5
3
36
The breadth of price increases in the Euro area is looking much more worrisome than in the US. See this nice chart from GS:
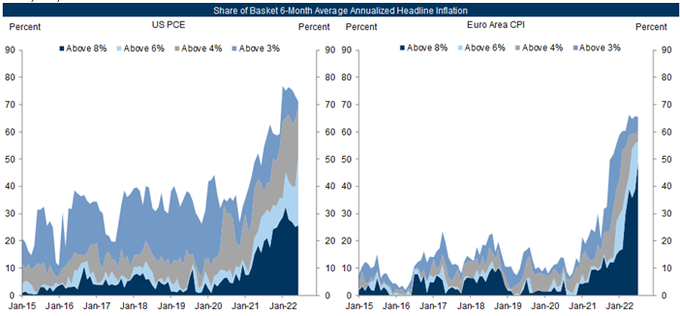
1
11
35
Inflation rates for categories where prices historically adjust more frequently or “flexibly” (in black below) have been back to normal for some time
Atlanta Fed’s “Flexible” and “Sticky” CPI series
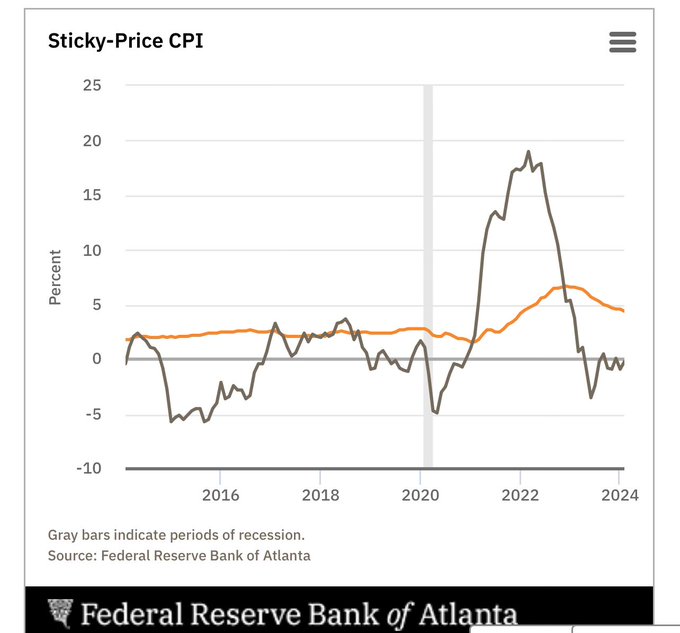
1
8
36
CPU rent inflation will continue to remain elevated
From UBS
Recent high CPI rent inflation should (still) not be surprising.
The gap between market rents and paid rents peaked in July 2022 at 15pp, and has since closed to 8pp.
The rate at which paid rents (CPI) catches up to market rents is what we see as CPI rent inflation.
10
14
105
1
6
35
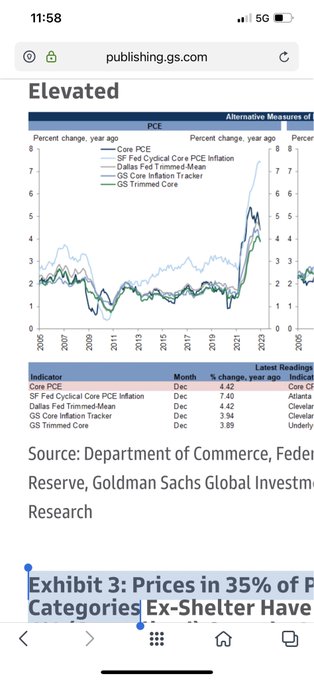
The
@sffed
cyclical core pce is currently well above 7 percent. Some of this is rent inflation, but otherwise indicative of a lot of aggregate demand pressure.
0
8
34