

Kees van der Leun
@Sustainable2050
Followers
37,524
Following
1,331
Media
16,939
Statuses
140,762
Building Common Futures, a new energy transition consultancy. Energy, climate &more. @Sustainable2050 @Mastodon .energy RT≠endorsement Views=own
Netherlands
Joined December 2009
Don't wanna be here?
Send us removal request.
Explore trending content on Musk Viewer
jaemin
• 386688 Tweets
Norawit with L'Oreal Paris
• 233469 Tweets
Will Still
• 116792 Tweets
PP is WORTH IT
• 67424 Tweets
プロフェッショナル
• 43245 Tweets
Tina
• 33326 Tweets
SDカード
• 26809 Tweets
YOASOBI
• 25307 Tweets
高利貸し
• 24593 Tweets
GW後半戦
• 24492 Tweets
カメムシ
• 22593 Tweets
金利60
• 21275 Tweets
中条きよし参院議員
• 20704 Tweets
#素のまんま
• 18926 Tweets
出資法違反の疑い
• 18587 Tweets
Princess Charlotte
• 16741 Tweets
物語シリーズ
• 15120 Tweets
ウマチュン
• 14035 Tweets
外国人嫌い
• 14004 Tweets
東京地検特捜部
• 13139 Tweets
#モニタリング
• 12900 Tweets
FORCE LOVE SEALECT
• 11380 Tweets
排外主義的
• 10918 Tweets
#びりーぶ
• 10624 Tweets
Last Seen Profiles


Pinned Tweet

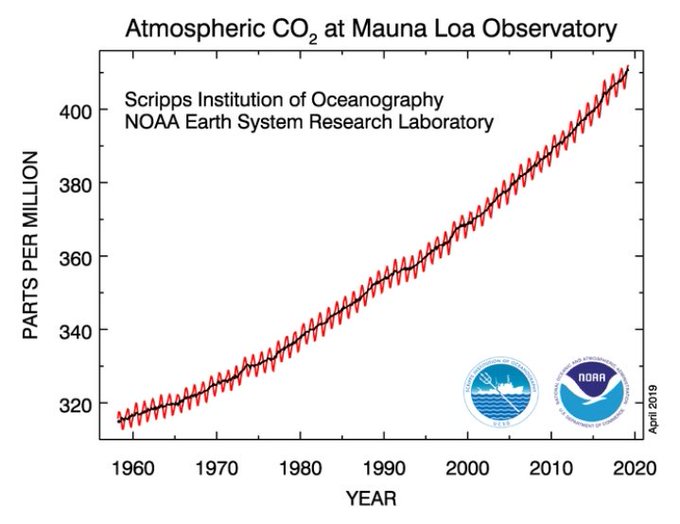
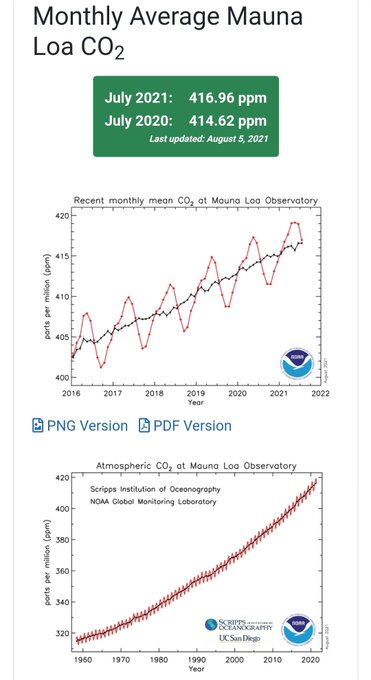
Years it took us to drive up CO2 by 10 ppm:
320 → 330: 12
330 → 340: 8
340 → 350: 6
350 → 360: 7
360 → 370: 6
370 → 380: 5
380 → 390: 5
390 → 400: 5
400 → 410: 4
That’s making the climate crisis worse faster.
91
2K
2K
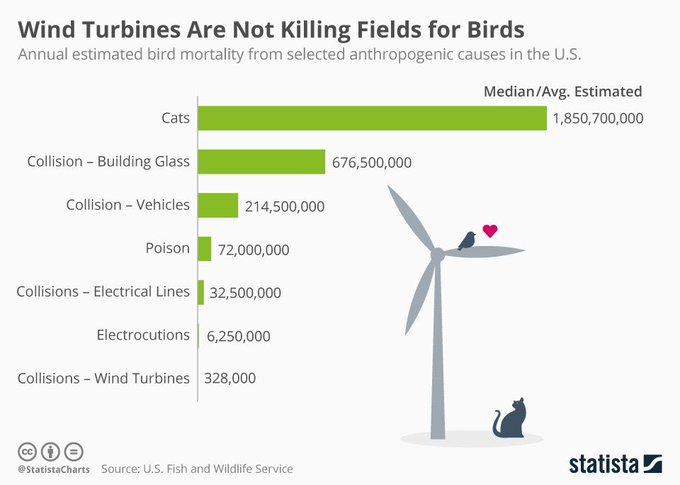
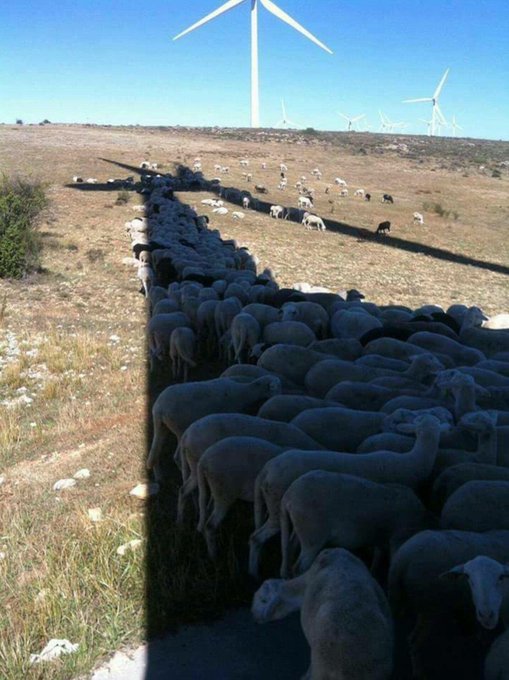
How often have you heard the argument that driving a car kills birds used against driving cars?
Then you should hear the argument of bird deaths used against wind turbines about 700 times less.
146
3K
5K
President Macron of France:
"I repeat: We will not sign trade agreements with countries not honoring the
#ParisAgreement
on climate action."

Je l’ai dit, le répète : on ne signera plus d’accords avec des puissances qui ne respectent pas l’Accord de Paris sur le climat.
1K
2K
9K
139
2K
4K
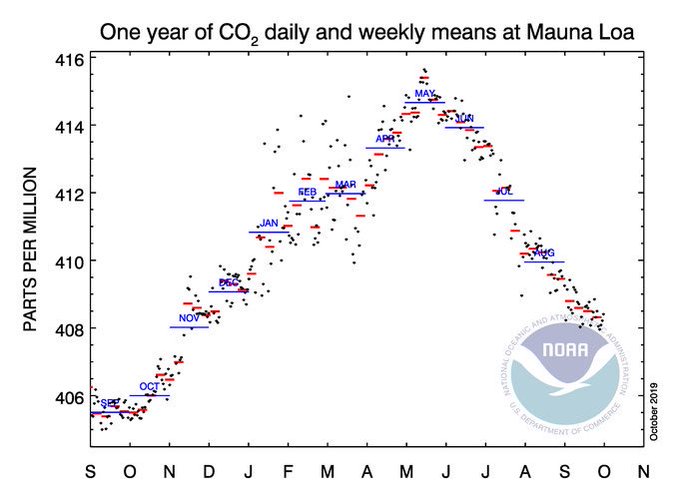
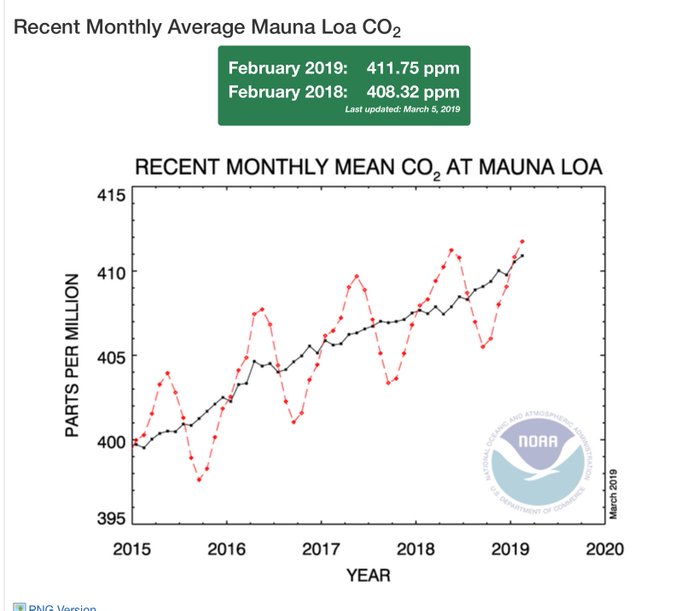
One of the most important indicators for the world. Yet chances are you won't see this graph in the media today. As opposed to tons of stock market charts.
Based on daily values, the September average of atmospheric CO2, measured at Mauna Loa, was ~408.5ppm, that’s 3.0 ppm higher than last year. September normally has the lowest value for the year.
Overall: still speeding in the wrong direction!

23
617
693
56
2K
4K
Unusual footage of an airplane producing its contrail, from above!
Also a reminder of the amount of CO2 it emits. What you see is water vapor, and for every molecule of water, there’s roughly one molecule of (invisible) CO2 as well.
Imagine all our CO2 emissions were visible!
75
2K
3K
I'd like two tonnes of CO2 emissions to be prevented for every new one emitted.

Trump wants to cut two regulations on businesses for every new one imposed
52
65
73
36
1K
3K
It's like climate wants us to know that we're 3.5 years into the
#ParisAgreement
, and global emissions are still increasing.
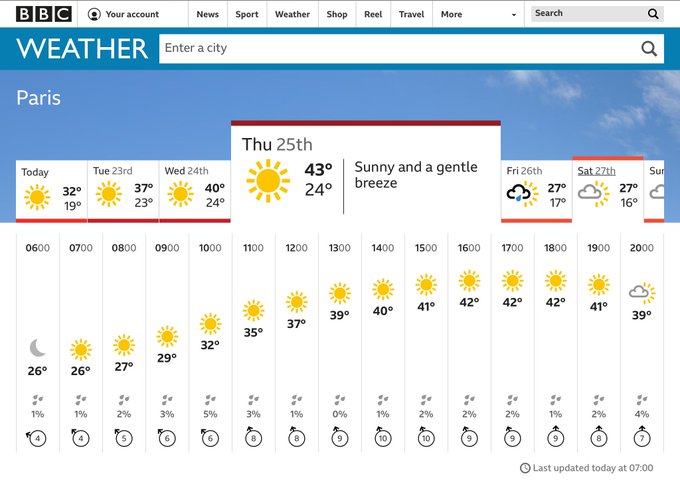
Forecasts for Paris, Thursday, now moving into the 42-43°C range. Unprecedented.
15
118
111
41
1K
3K
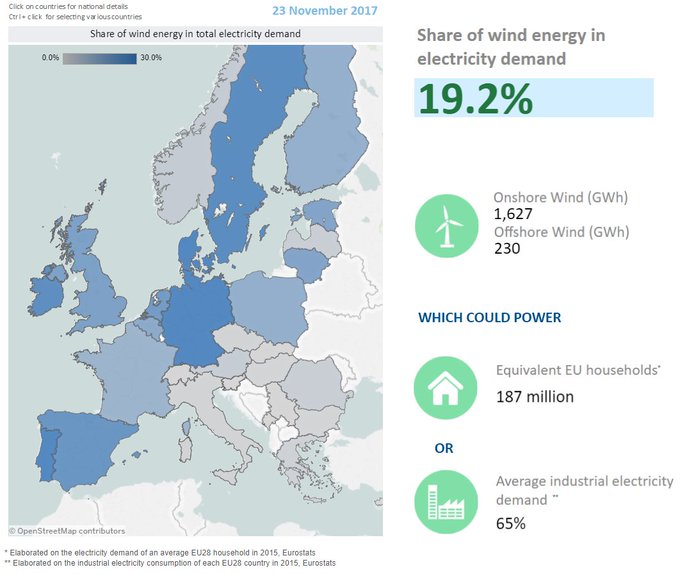
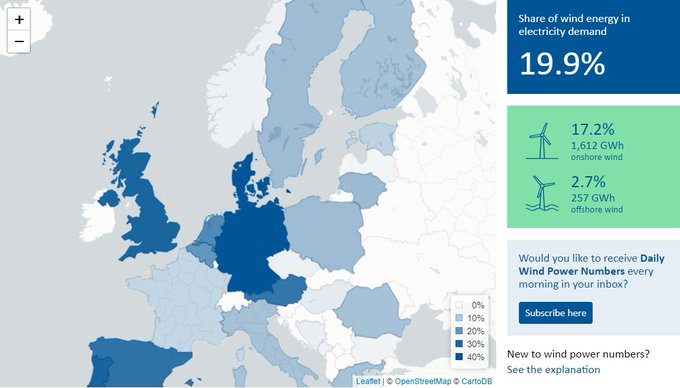
Yesterday, wind produced 19% of Europe's electricity!
Denmark 93%
Portugal 47%
Germany 46%
Sweden 28%
Ireland 27%
Spain 24%
Netherlands 22%
United Kingdom 20%
Lithuania 18%
Estonia 18%
78
2K
3K
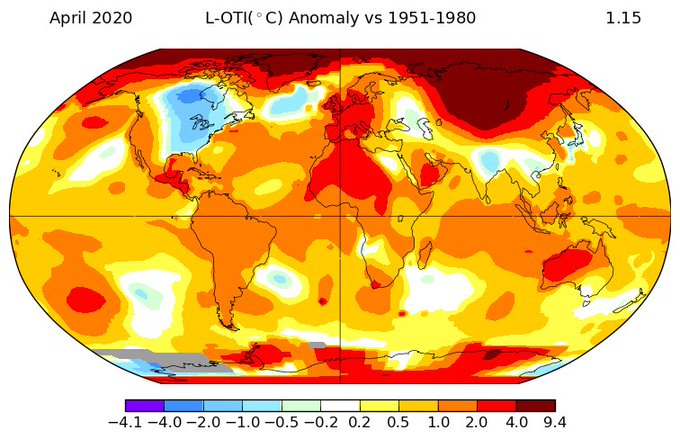
NASA: April was the warmest on record, globally: +1.16°C above the 1951-1980 normal, ahead of 2016 and 2019.
Between 4 and 9.4°C(!) above normal in the Arctic and Central Russia. Very warm in Europe, North-Africa, Mexico, C-America, W-Australia. Cool in E-US and C-Canada.
76
1K
2K
Let's show our support
@GretaThunberg
, under attack by Murdoch media, by bringing her to 1 million followers on Twitter! (839k now)
Very much worth the follow too, and on her way to the Climate Summit in NYC now, crossing the Atlantic by sail.
43
1K
2K
Another region where precipitation is completely out of line with anything observed before: New Zealand's North Island.

34
602
2K
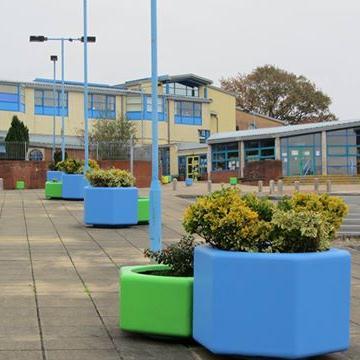
Utrecht bicycle jam, as seen from the Common Futures office :)
43
352
2K
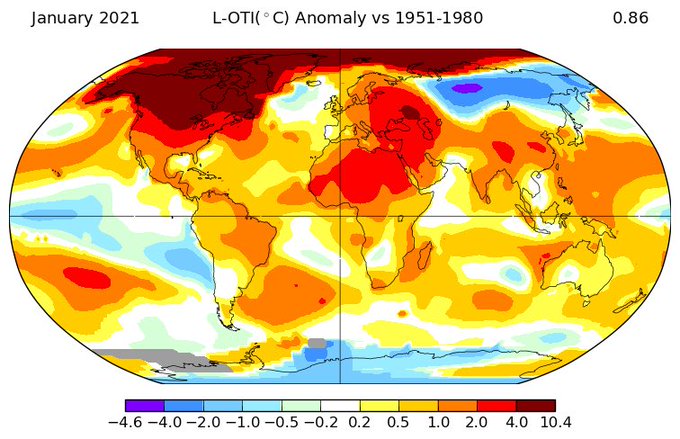
NASA: January 2021 was the 6th warmest on record, behind 2020, 2016, 2017, 2007, and 2019: +0.86°C above its 1951-1980 average.
Look at Alaska, Canada, and the Arctic: all between 4 and 10.4°C (that’s 7.2-18.7 F) above that ‘normal’!
Way below normal in central Siberia.
45
553
2K
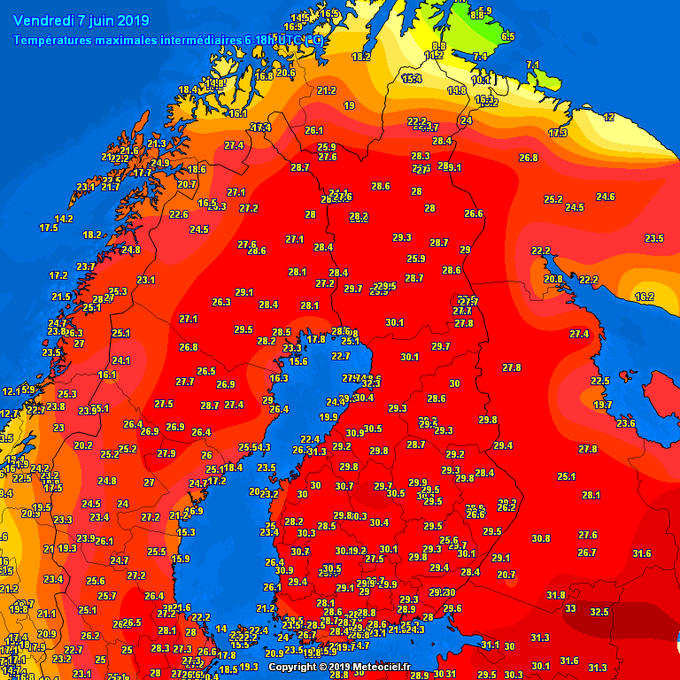
Heatwave in Finland: 32.3°C in Oulunsalo (near Oulu), close to the Arctic circle, at 65° North, yesterday.

Historical chart. There are no known cases in Finland's climate history when it has been hotter than now so early in the summer.
224
4K
6K
42
1K
2K
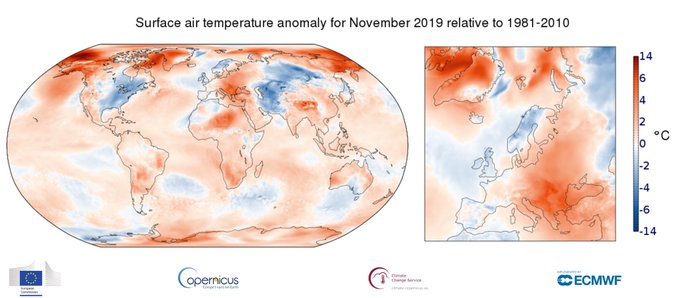
November 2019 was the warmest on record globally, together with 2016, and just ahead of 2015: +0.64°C above its 1981-2010 normal. Extremely mild in Alaska, Greenland and Eastern Siberia. Warm in SE-Europe, cool in E-US and W-Asia. [EU analysis]
41
701
1K
Ouch. Look at the enormous difference between Dutch and German average home insulation: the Dutch ones lose 2.4 times as much heat as the German ones!

97
434
1K
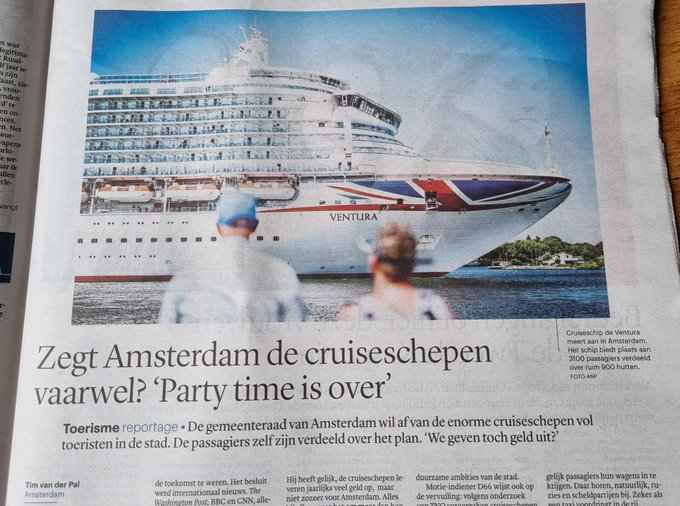
Amsterdam's city council voted to shut down the city's cruise terminal to reduce mass tourism.
The city: Yes, the cruise ships do bring in €100 million per year, but half of that is for their fossil fuel suppliers here. And they cause a lot of air travel to and from Amsterdam.
37
313
1K
My advice after 8+ years of tweeting on energy & climate: don't spend too much time on correcting climate confusers. Focus on interaction with others that want to understand climate change, and want to do something about it.
Much more effective, much more fun!
27
298
1K
Yesterday, wind produced 22% of all Europe’s electricity!
Top-5, by share:
Denmark 68%
Germany 59%
Lithuania 27%
Belgium 27%
Portugal 27%
Top-5 by production (GWh):
Germany 717
UK 178
France 152
Spain 96
Sweden 76

18
627
1K
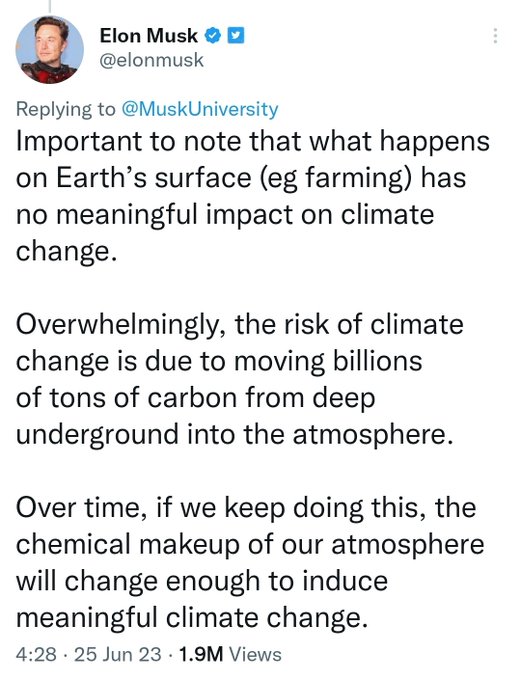
The owner of this site displaying his cluelessness on the climate impact of land use, and suggesting the level of climate change we're experiencing now isn't 'meaningful' yet. In one lengthy tweet.
147
183
1K
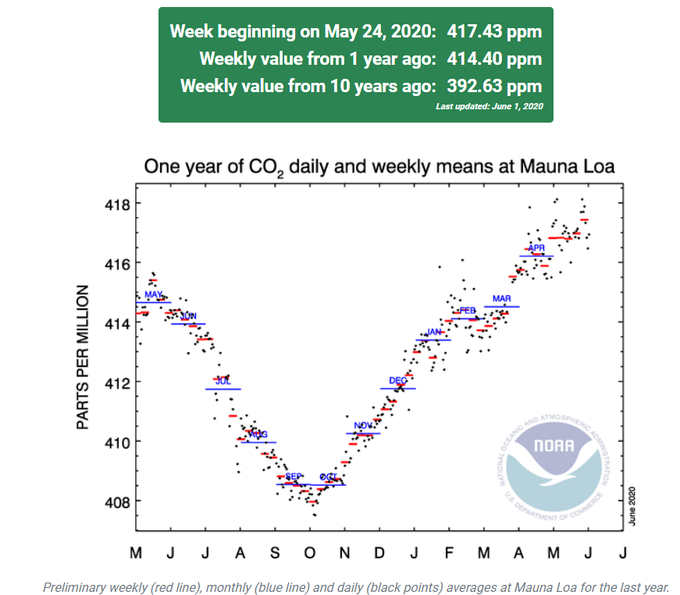
15-million year high in CO2 concentrations last month!
Based on daily values, atmospheric CO2, measured at Mauna Loa, averaged ~417.0 ppm in May. That's 2.3-2.4 ppm higher than last year, and probably the highest Earth has seen in the last 15 million years.
38
573
1K
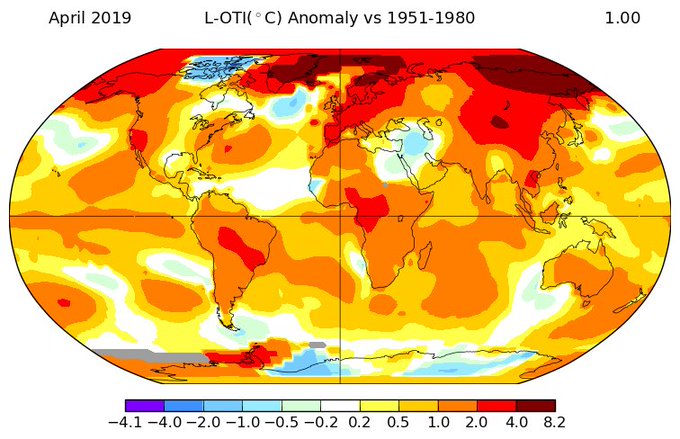
NASA: April 2019 was the 2nd warmest on record globally, behind 2016: +0.99°C above the 1951-1980 average.
More than 4°C above normal in parts of Greenland, N of Norway, and in NE-Siberia.
And the North-Atlantic cool blob, related to slowing ocean currents, is still there too.
23
909
1K
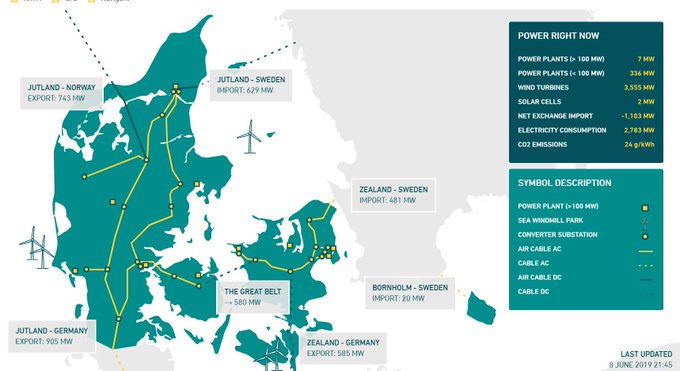
Denmark did it again: Power produced by its wind farms equals 100.3% of national electricity demand at the moment, and still going up!
35
1K
1K
On Saturday, wind power produced 20% of Europe's electricity!
Denmark 68%
Germany 53%
UK 30%
Portugal 30^%
Spain 27%
Austria 27%
NL 23%
Belgium 20%
(Ireland's data still seem to be missing)
27
492
1K
Replacing the SUVs sold globally by normal cars would free up enough steel for all wind turbines produced and installed. Actually it would allow to at least double wind power capacity additions!
35
284
1K
Please tweet this suggestion to TV meteorologists in your country. Let's see if we can get all of them to kick the habit of calling the last (warmest) 30 years 'normal'!
The meteorologists of
@NOS
Dutch public TV news will use the new 1991-2020 average as reference, but they won't use the word 'normal' for it anymore. "Because the weather isn't normal anymore". Fully agree!
7
71
269
22
276
1K
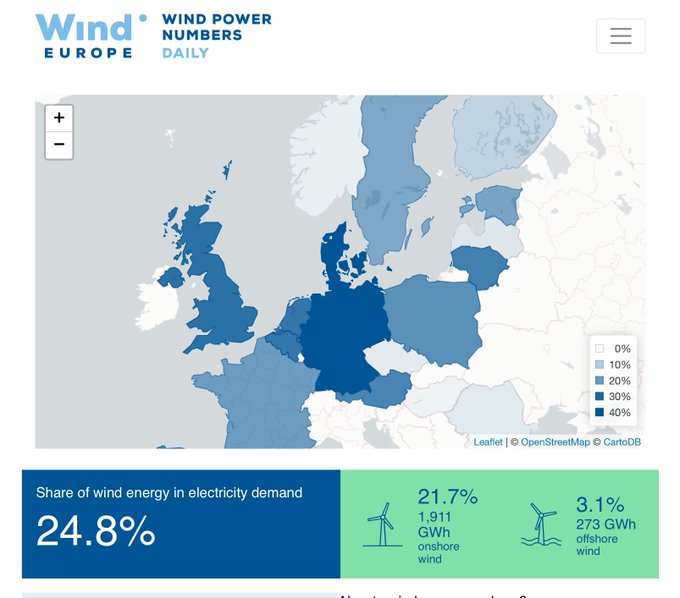
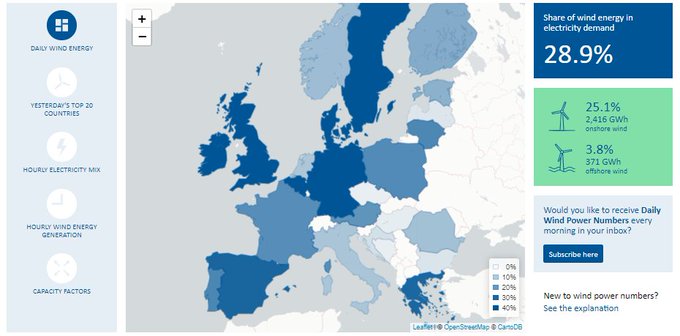
Yesterday, wind produced 27% of all electricity for Europe!
Top-5 by share of total:
Denmark 116%
Germany 75%
Ireland 67%
Sweden 41%
UK 35%
Top-5, millions of kWh produced:
Germany 987
UK 288
France 189
Sweden 161
Poland 112

26
558
1K
Confirmed: the average atmospheric CO2 concentration in September, measured at Mauna Loa, was 411.3 ppm, that’s 2.75 ppm higher than last year.
Overall trend: still speeding in the wrong direction!

23
465
970
On Saturday, wind power generated 25% of Europe’s electricity!
Denmark: 95%
Germany: 71%
Portugal: 28%
UK: 28%
NL: 27%
Belgium: 26%
Lithuania: 25%
Spain: 24%
Austria: 24%
Poland: 21%
France: 19%
#COP24
30
566
962
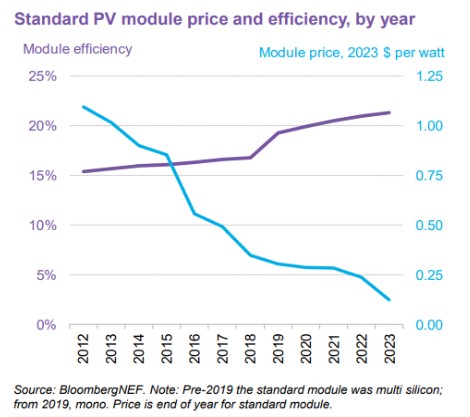
1 m² of solar panels now give you 38% more power for 83% less money than eleven years ago!

Pretty cool chart from my team at BloombergNEF. In 2012, the standard solar module was multicrystalline silicon, 15.4% efficient and costing $1.09/W in 2023 $. In 2023, standard is mono PERC, efficiency 21.3%, price $0.13/W.
33
309
916
34
285
983
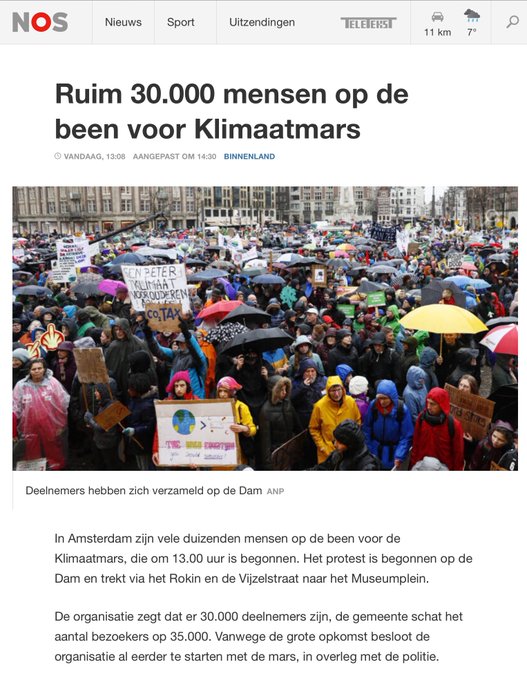
35,000 people marched for climate in Amsterdam today, asking NL govt to take real climate action, soon.
#klimaatmars
15
272
931
Cheapest electricity on the planet now is Mexican solar power at 1.77¢/kWh - 2 bids by
@ENEL
or 289 MW in total.
31
773
918
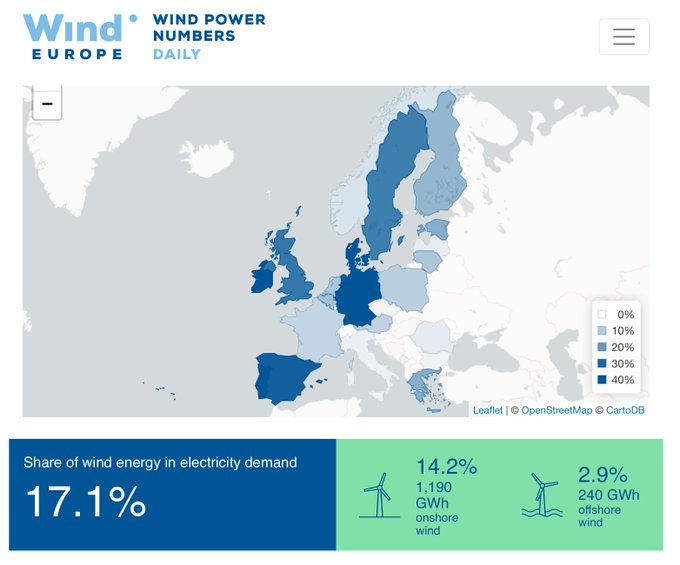
Yesterday, 1/6 of Europe’s electricity was produced by the wind!
Denmark 73%
Portugal 46%
Ireland 46%
Germany 34%
Spain 31%
UK 26%
Sweden 25%
23
505
870
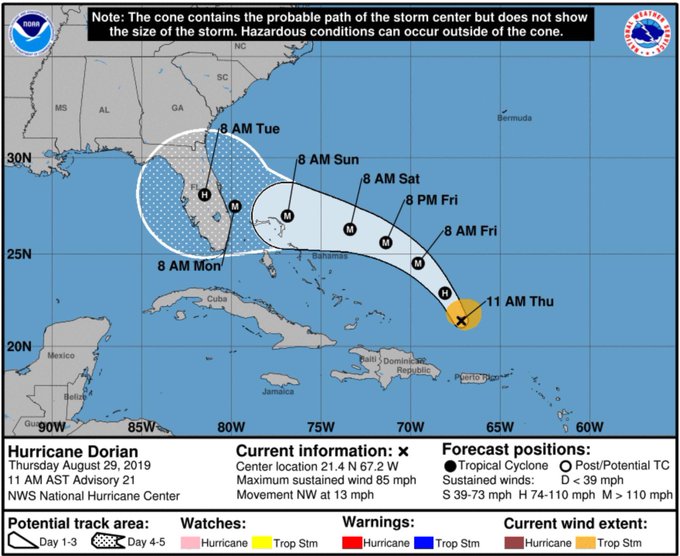
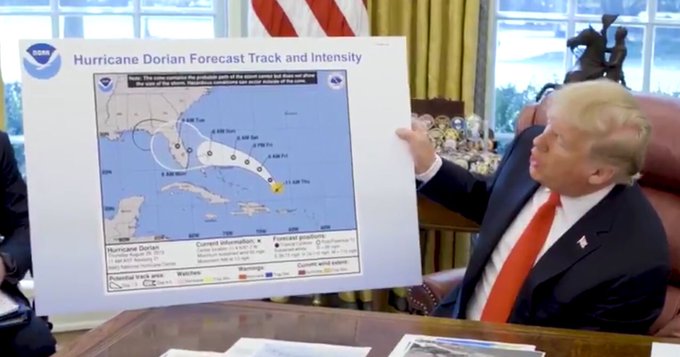
@bassett_taylor
Side by side: NHC Advisory 21 and Mr Trump’s “See, I told you Alabama was at risk too” version.
63
211
559
45
130
806
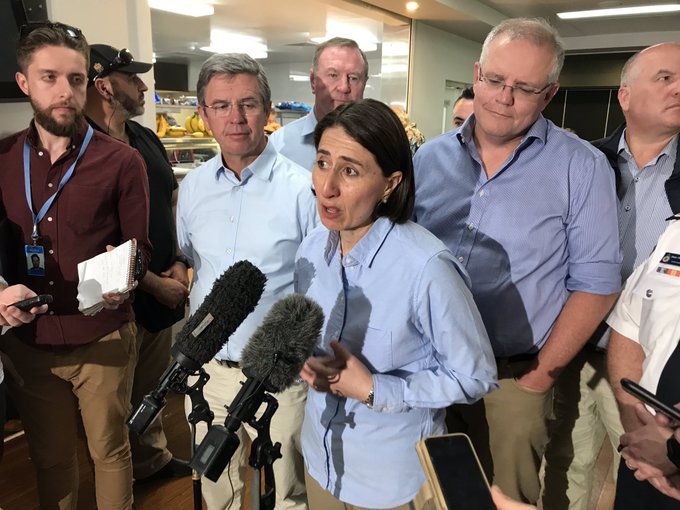
Imagine scientists had been warning for a long time that a certain airplane was unsafe, and would crash, and the airline's CEO had still kept it flying.
One day it crashes and journalists ask the CEO about the warnings.
"Not today. Not today! - the CEO says.

“Not today. Not today!” -
@GladysB
said, shaking her head, when
@ScottMorrisonMP
was asked about the effect of climate change on bushfires.
@7NewsAustralia
528
244
447
23
325
866
Denmark adopts climate law to cut emissions 70% by 2030!
11
391
853
"A 2°C world might be insurable,” warned Henri de Castries, former Chairman and CEO of insurance giant AXA.
“A 4°C world certainly would not be.”
18
571
832
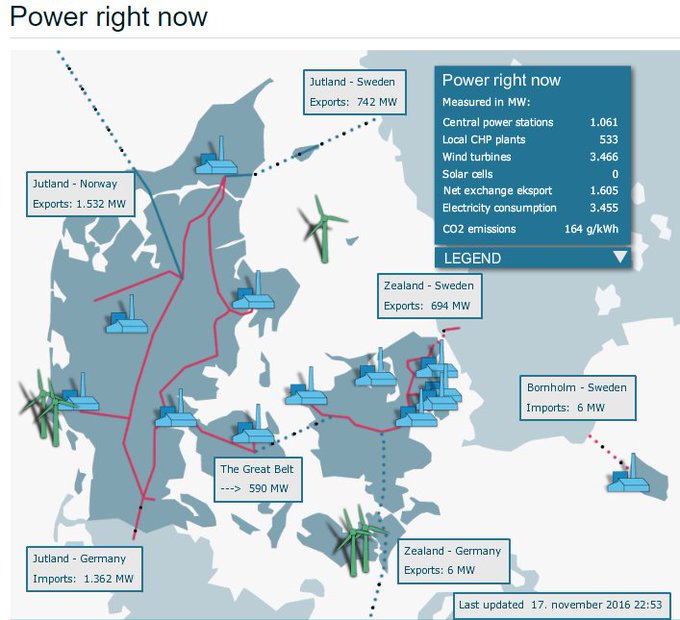
Denmark wind turbines producing 103% of national electricity demand right now! See the power flows in realtime:
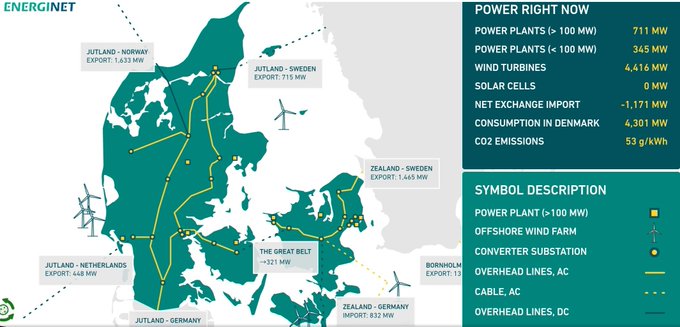
29
170
873
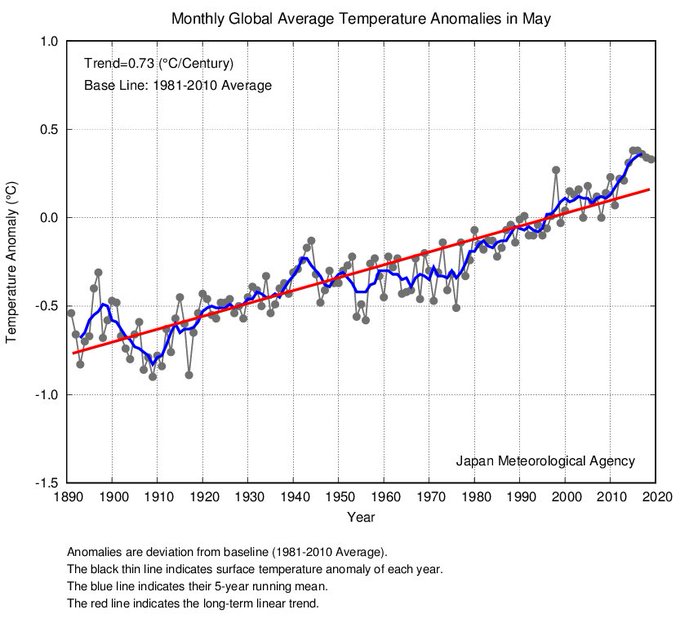
May 2019 was the 5th warmest on record globally: +0.70°C above the 20th century average. Top 5 warmest after 129 years:
1. 2016
2. 2015
3. 2017
4. 2018
5. 2019
[Japan Meteorological Agency]
26
601
835
Last night, a Rotterdam subway train smashed through its buffer stop at the end of the line in Spijkenisse, and was caught by a whale.
h/t
@Peterleun

40
284
851
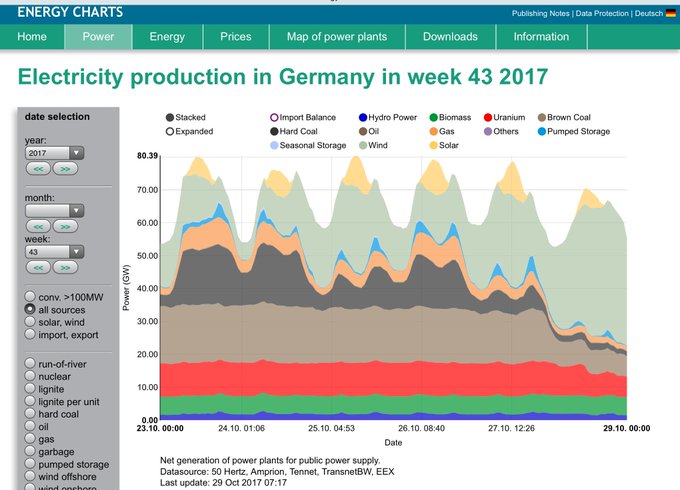
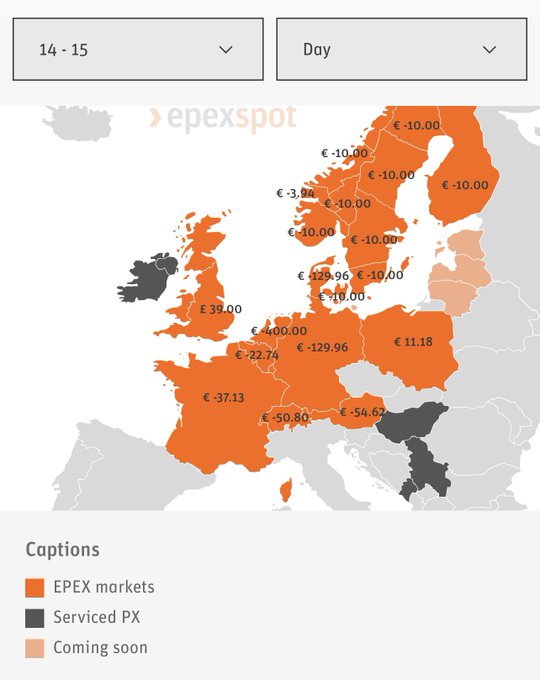
Last night, lots of wind produced over 60% of German electricity, pushing prices into negative territory, forcing lignite and nuclear power plants to switch off.
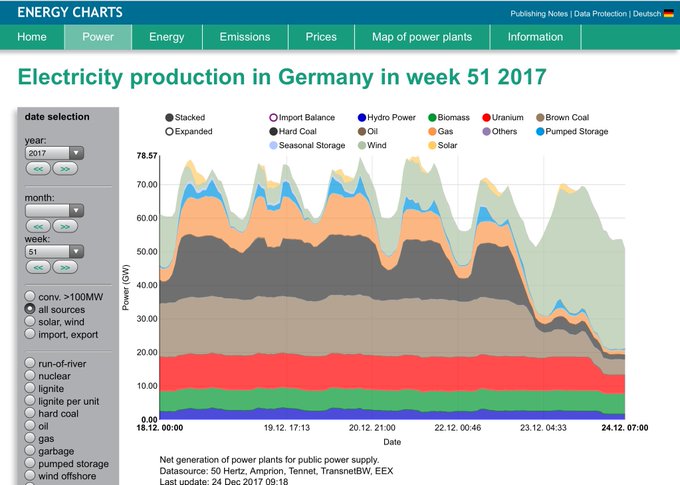
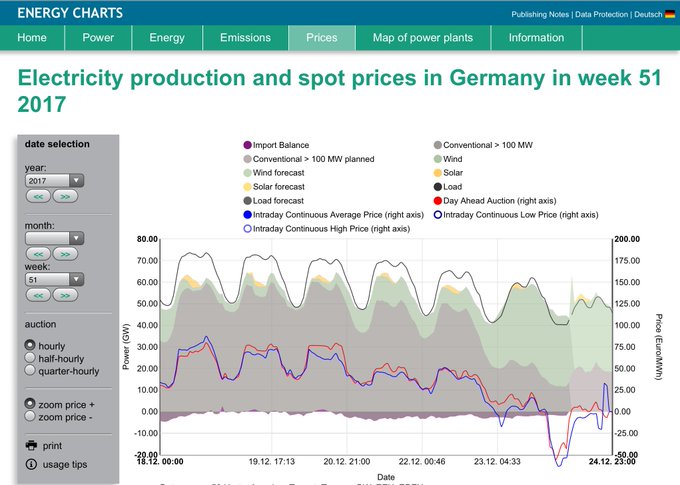
16
619
829
Amsterdam to ban fossil fuel cars by 2030, from the entire city!
2022: no fossil fuel buses in the city center
2025: all ferries and recreational boats, trucks, taxis, buses in the whole city to be emission-free. Only electric scooters allowed.

18
422
802
Responding to the climate crisis by saying that CO2 is plant food is like responding to an imminent flood threat by saying that water is plant drink.
17
273
783
India: Look at that temperature jump over the last 2 years. That's massive, for such a large country!
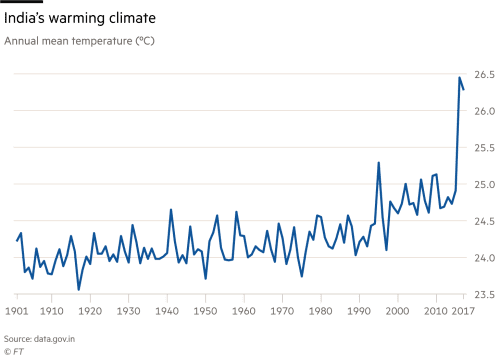
29
531
766
Finally, Utrecht's city moat is complete again, 50 years after this part was drained and turned into a concrete 4-lane road. Friends took us on a boat tour today, and it is great!
cc
@BrentToderian
11
198
801
Woke up early with Ukraine on my mind. Back to work on offshore wind today, reminding myself that Putin's power is based on fossil fuels.
15
126
788
How climate denial contributed to the climate crisis:
1. Taking an extreme, nonsensical position
2. Pressing climate scientists to err on the side of caution
3. Getting the media to apply 'false balance' between the two.
Result: Society has no clue how bad the situation is.
17
473
779
At this moment, Denmark's wind farms are producing 128% of the electricity the country needs! The rest is exported. Follow it live, at the site of transmission system operator
@EnerginetDK
(scroll down):
13
398
758
Yesterday, wind produced 1/9 of Europe's electricity. Denmark 49%, Portugal 45%, Bulgaria 41%!, Spain 21%, Germany 17%, Lithuania 17%.
13
679
745
On Saturday, wind produced 22% of Europe's electricity!
Denmark 104% (more than the country used)
Germany 66%
NL 33%
Lithuania 28%
Belgium 25%
Spain 24%
Poland 22%
Estonia 22%
Portugal 21%

22
460
731
Dear (Dutch) media, are you paying attention?
Why don’t we see these growing weekly school strikes and climate marches on the front page? Is it because they don’t wear vests? Because they don’t damage anything? Because they’re children?

22000 on schoolstrike in Switzerland today. And way over 30000 in Germany. The people are rising. The world is at a tipping point. Now we have to continue pushing hard! Everyone is needed. This is just the beginning.
#FridaysForFuture
#schoolstrike4climate
#ClimateStrike
84
2K
4K
11
358
737
Based on daily values, the September average of atmospheric CO2, measured at Mauna Loa, was ~408.5ppm, that’s 3.0 ppm higher than last year. September normally has the lowest value for the year.
Overall: still speeding in the wrong direction!
23
617
693
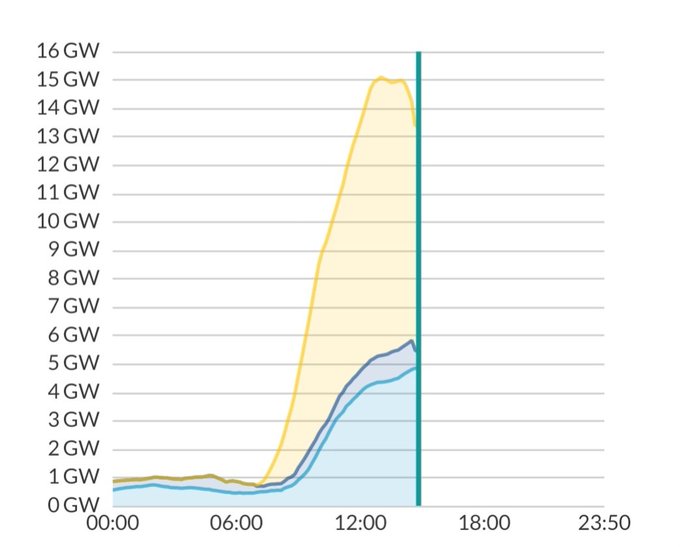
Solar + wind power production in the Netherlands just peaked at 15 GW. That's more than the national electricity demand at that moment!
From
69
144
690
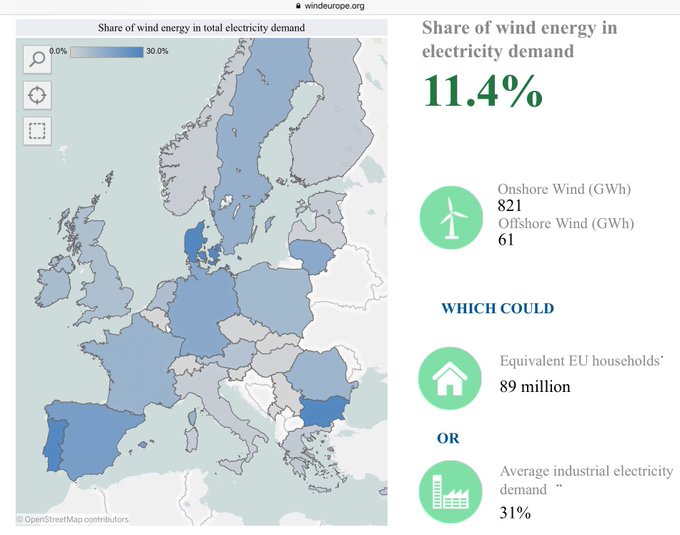
Yesterday, wind produced 22.5% of European electricity!
Top countries:
Denmark 79%
Ireland 61%
Germany 60%
Netherlands 32%
Belgium 26%
Romania 23%
UK 22%
14
339
637
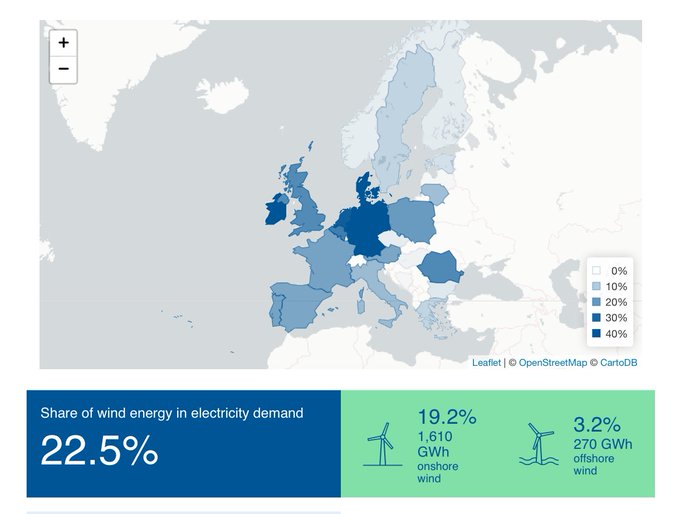
Yesterday, wind produced almost 1/4 of all Europe's electricity!
Top-5 by share of total:
Ireland 63%
Denmark 60%
Germany 47%
Portugal 42%
Spain 37%
Top-5 by GWh produced:
Germany 563
Spain 220
France 205
UK 198
Belgium 70

13
274
648
Madness: empty flights because airlines operating out of Europe must continue to run 80% of their allocated slots or risk losing them to a competitor.
We're not taking the climate crisis seriously.
9
357
642
Based on daily values, the April average of atmospheric CO2 measured at Mauna Loa was ~413.2 ppm! That's around 3.0 ppm higher than last year, and by far the highest monthly value on record. Most probably the highest in 3 million years too
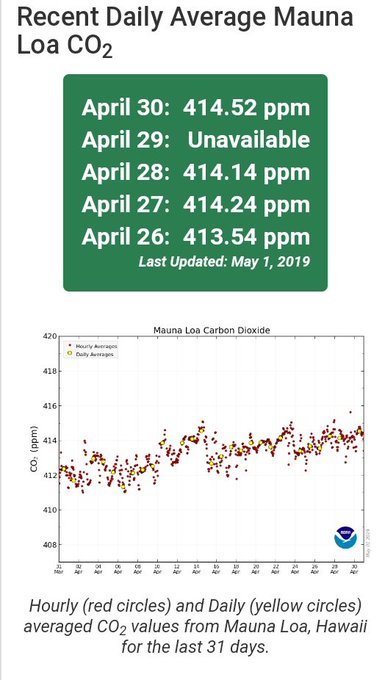
24
642
622
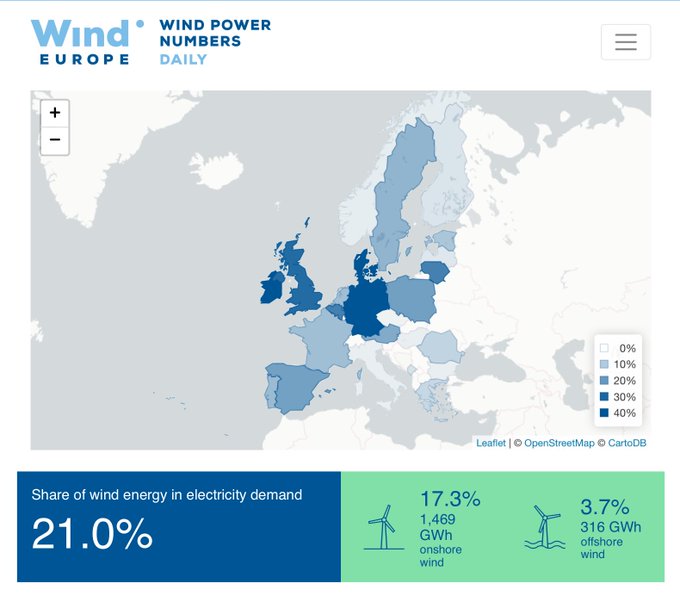
Yesterday, wind produced 21% of all Europe’s electricity!
Top-6 by share of total:
Denmark 81%
Germany 59%
Ireland 42%
UK 29%
Belgium 24%
Lithuania 24%
Top-6 by wind electricity generated (GWh):
Germany 836
UK 228
France 138
Spain 122
Poland 90
Denmark 78
15
366
631
German Greens launch plan to boost railways, make domestic flights obsolete by 2035, and strengthen European rail travel by a network of night trains.
Involves lower VAT for rail, higher jet fuel tax, and €3 billion annual investment in German railways.

Exklusiv: Die Grünen fordern mehr Geld und weniger Steuern für die Bahn. Inlandsflüge sollen dadurch "obsolet" werden, schreibt
@MBauchmueller
25
47
363
23
275
637
Good evening, from the central Utrecht rush hour ;)
6
76
637
The similarity with that statue in Berlin struck me:
"Politicians discussing global warming" vs
people living the consequences.

4
339
632
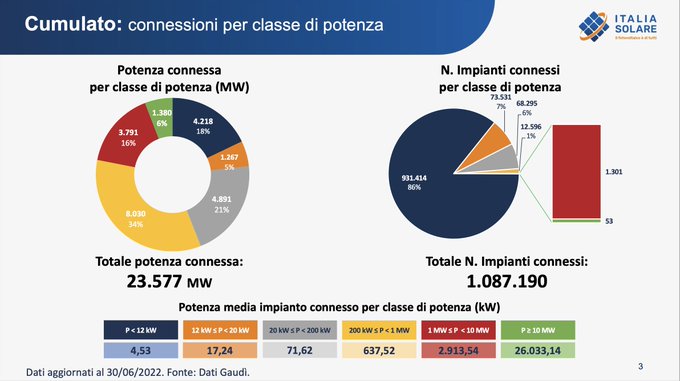
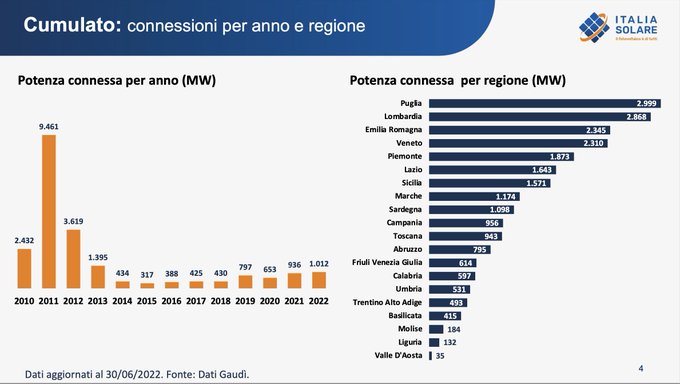
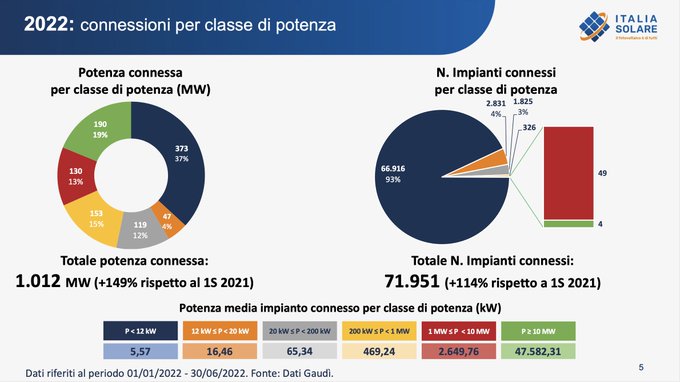
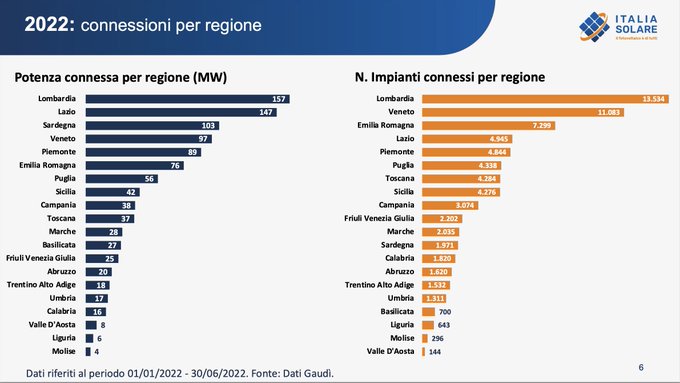
Italy, a large and sunny country with massive energy problems and sky-high electricity prices, only installed 1 GW of solar PV in the first 6 months of this year: less than the Netherlands. Unbelievable.

Nei primi 6 mesi dell'anno l'Italia ha installato 1GW di nuova potenza fotovoltaica, meglio dell'anno precedente ma ancora molto lontana dagli obiettivi si sviluppo del solare al 2030.
Leggi i dati elaborati da ITALIA SOLARE
4
36
101
26
245
626
Yesterday, the last coal was burned in Portugal's last coal-fired power plant at Abrantes.
In the first 9 months of this year, 64% of Portugal's electricity was from renewable sources!
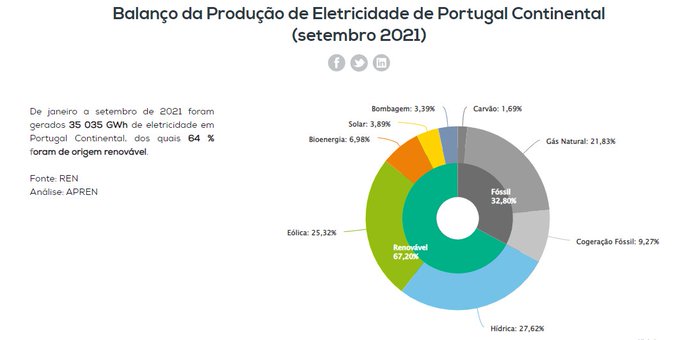

The end of coal for electricity generation in 🇵🇹 Portugal! via
@expresso
@mpradoexpresso
Back in 2017 the plans were to end coal use for power by 2030. 💪👏
7
40
132
12
214
607
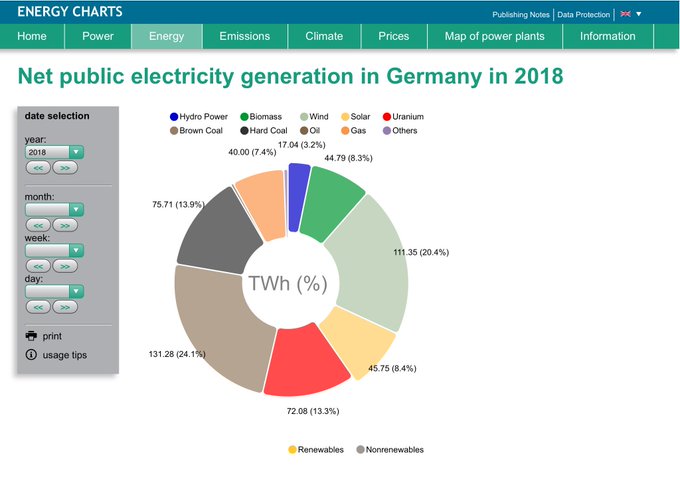
Germany made it! Over 40% renewable electricity* in 2018, for the first time ever. After 38.2% in 2017, now 40.4%.
Nuclear 13.3%, fossils 46.3%
*) based on net power generation for the public grid.
Thx Bruno
@energy_charts
for your data and charts!
26
368
606
Yesterday, wind produced 29% of all Europe's electricity!
17
163
602
@bassett_taylor
Side by side: NHC Advisory 21 and Mr Trump’s “See, I told you Alabama was at risk too” version.
63
211
559
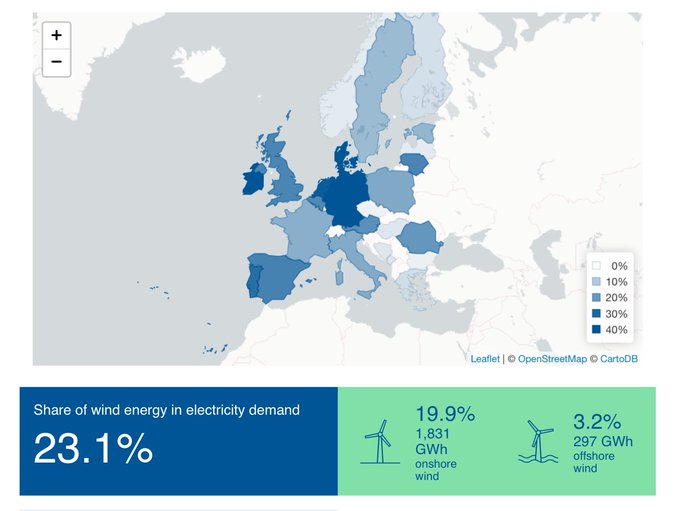
On Thursday, wind turbines produced 23% of Europe's electricity!
Denmark 74%
Germany 57%
Ireland 50%
Netherlands 32%(!)
Portugal 28%
Spain 24%
Lithuania 24%
UK 23%
Belgium 23%
20
329
565
Confirmed: the July average of CO2 at Mauna Loa was 416.96 ppm; that's 2.3 ppm more than last year.
Overall: still speeding in the wrong direction!
11
243
561
For the first time ever, wind and solar will beat coal (brown + hard coal) in German electricity this year!
Wind 24.4% + solar 9.2% = 33.6%
Brown coal 19.8% + hard coal 9.5% = 29.3%
(Electricity supplied to the public grid, with 9 days to go)

16
250
575
Massive outbreak of range anxiety among British fossil fuel car drivers.

Hundreds of petrol stations have had to impose a £30 limit on fuel due to the HGV driver shortage causing issues for fuel supplies across the UK.
Read the latest here:
844
487
1K
18
122
583
Danish government announces plan to end sales of fossil cars in the country by 2030

22
285
548
In the Netherlands, we're now in by far the warmest June ever, in by far the longest streak (13) of warm days (>25°C) in June ever, and we've just experienced by far the longest period of days without rain (39!) in any part of the year ever. Not that it's talk of the town though.

24
190
559
I asked you what to recommend for people that don't accept or understand human-caused climate change. Clear winner:
28
557
537
Putting more CO2 in the atmosphere is messing with Earth's thermostat. And this is what we're doing. So we need to stop adding CO2 asap.
56
703
524
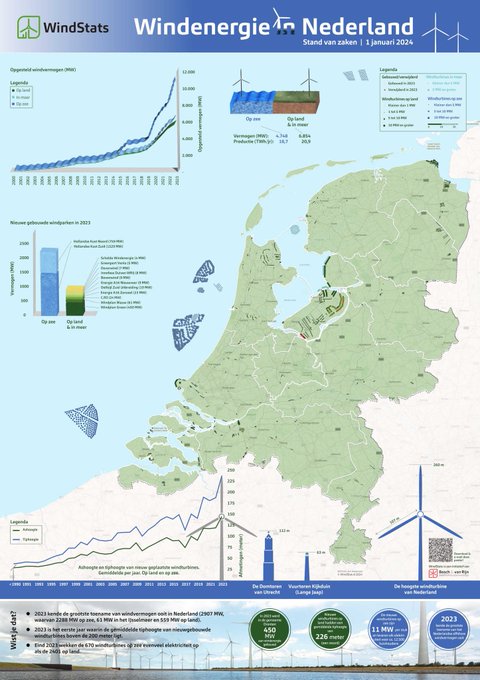
Yes, we did it!
50% of all Dutch electricity came from renewables in 2023:
25% wind (out of which 10% offshore)
18% solar PV
7% biomass
Now for the other half :)
Source: via
@Vision23

39
148
529
Finland's new nuclear power plant temporarily throttles its production as electricity price plunges. This will happen more frequently as Finland is experiencing a big wind power boom, with lower marginal cost of electricity than nuclear.

48
189
521
Highest weekly average CO2 ever measured at Mauna Loa: 412.4 ppm, almost 4 ppm above same time last year.
February seems on its way to end as highest month too, most probably for the last 2 million years.

26
624
494
In the 1980's, it took 133 wind turbines (75 kW each) to build a 10 MW wind farm. Soon, one turbine will be enough.
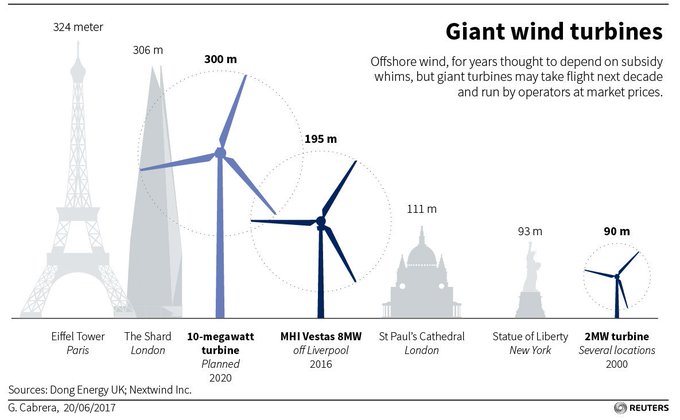
13
475
505
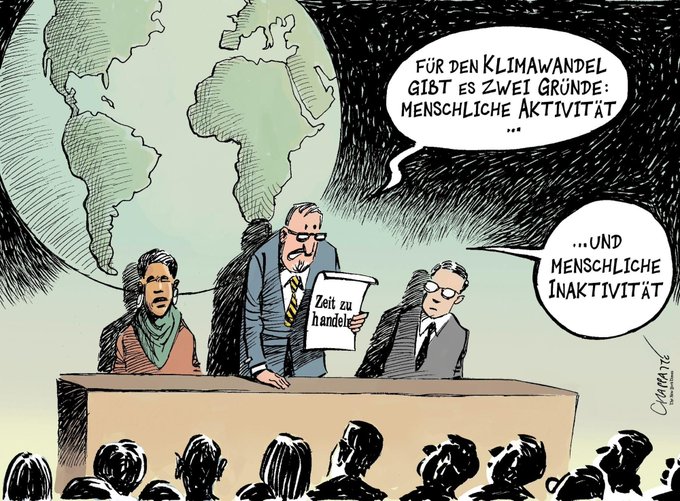
“Climate change has two causes: human activity and human inactivity.”

6
237
498
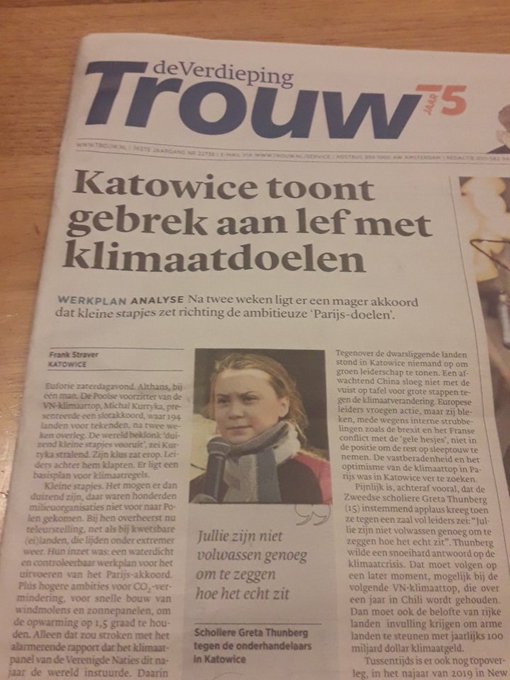
.
@GretaThunberg
on the front page of the morning paper here, quoting her speech on climate action for
#COP24
delegations:
"You are not adult enough to tell it like it is"
5
160
495
The Netherlands added a record 2.9 GW of wind power in 2023!
11.6 GW now capable of producing almost 40 TWh/year, that's more than 1/3 of our national electricity demand.
By
@boschenvanrijn
22
137
519
Yesterday, renewables produced 79% of all electricity for the German public grid! A new alltime high.
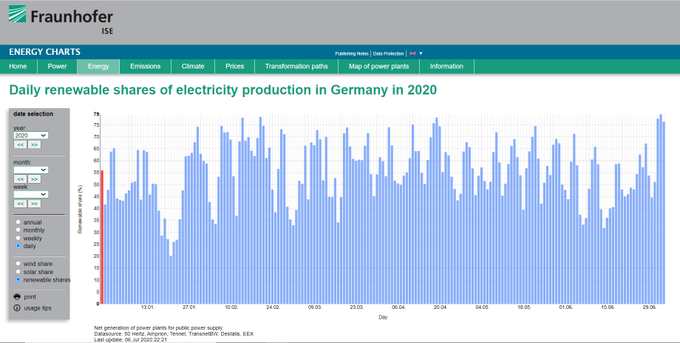
10
217
512
EU CO₂ emissions have now returned to the level of 45 years ago. They peaked in 1979, and came down by about 1/3 since then.
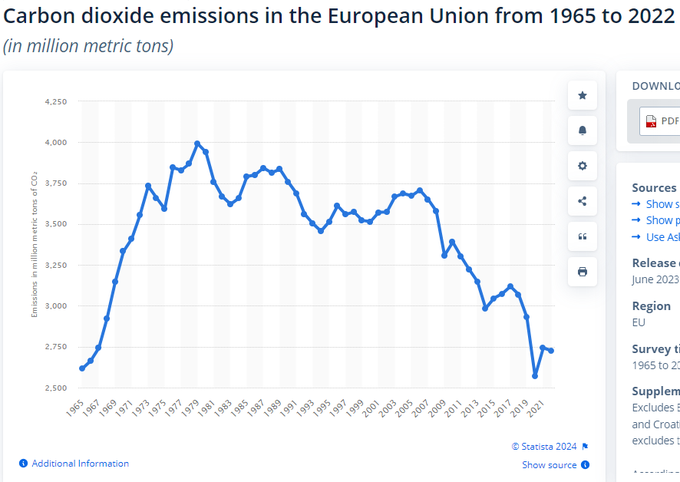
27
157
503
World's largest bicycle parking (12,656 bikes), next door from
@NavigantEnergy
in Utrecht: impression of the full length, from the bicycle road leading through it!
16
170
486
China's biggest-ever solar power plant goes live: world's
#2
at 2.2 GW! Construction on the project was completed in September after just four months.
14
226
483
Right now, Danish wind farms produce 98% of the electricity the country consumes! Follow the flows live here:
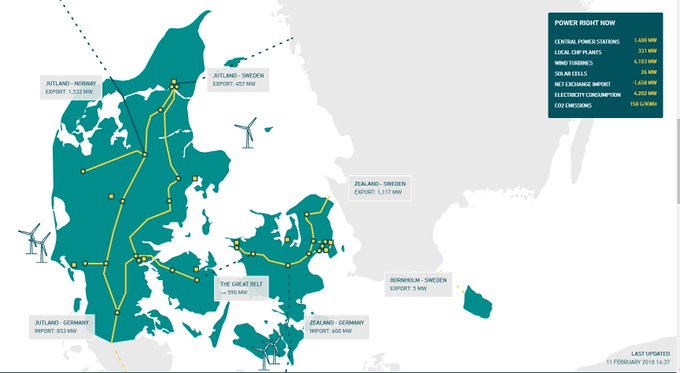
12
327
477
Honda to stop producing gasoline-only vehicles in Europe by 2022; to be replaced by hybrid and electric cars 3 years ahead of its previous schedule.

15
224
468
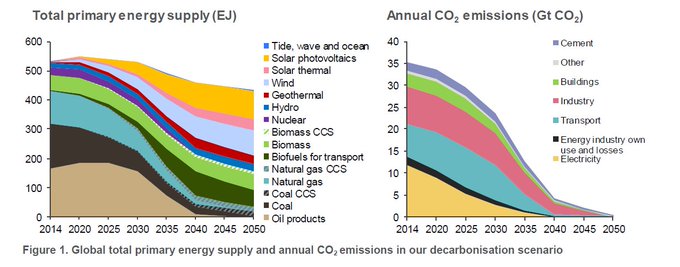
Energy transition within 1.5°C: our new
@Ecofys
/
@NavigantEnergy
paper on a disruptive approach to 100% decarbonisation of the global energy system by 2050:
A good read, 11 understandable pages, and exciting stuff!
30
371
457
EU Parliament votes for 55% emissions cuts (instead of 40%) by 2030, and net zero emissions by 2050!
And with an overwhelming majority: 369-116

19
259
456
This time it's London. Sloane Square tube station flooding after torrential rain hit the city.

21
224
446
Thread of things we can do for Ukraine. As they come to mind, unstructured, in no particular order. To help shape my own thoughts as well.
19
250
452
.
@Volkswagen
's math on the end of fossil cars:
2050: no fossil cars on the roads anymore
2040: last fossil car sold
2032: last new fossil car model enters market
2025: last new fossil car model development starts.
Link via
@peter_simone
48
313
432
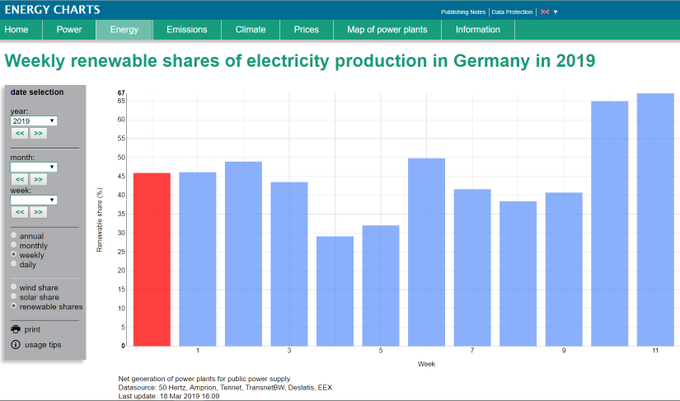
Record renewable electricity share in Germany, second week in a row!
50% of all electricity there was from wind last week, 67% from all renewables together, beating the 65% of the week before.
16
234
425
History of solar PV deployment:
1 GW per year was achieved in 2004
1 GW per month was achieved in 2010
1 GW per week was achieved in 2016
1 GW per day will be achieved in 2023

13
209
441
From what I see, climate ignorism is a bigger thing than climate alarmism.
8
110
429
Confirmed: Atmospheric CO2, measured at Mauna Loa, hit 411.8 ppm last month, already beating last year's record (411.2 ppm, May), and probably the highest in 2 million years too.
+3.4 ppm higher than last year, and that's a lot.
Overall trend: speeding in the wrong direction.

15
587
417
Last night, up to 40 GW of wind power provided over 60% of German electricity, squeezing out fossil & nuclear and causing negative prices.
22
338
413
Our 20 GW of solar PV is a bit too much for a Sunday afternoon: Dutch wholesale power price -€400 (so negative) per MWh between 2 and 3 pm tomorrow!
Export capacity fully in use already. Most of NW Europe in negative territory.
Via
@KPurchala
51
110
427
BREAKING: Your climate action only makes a difference of 0.0000000003°C in global temperature.
Argument used (multiplied by 17 million) for the Netherlands as a whole. But together with 7 billion other people, it's the difference between a liveable and an unliveable world.
11
187
406