

Peter Atwood
@Peterincan
Followers
2K
Following
5K
Media
231
Statuses
857
Cartographer with @Esri I make maps, and sometimes videos, and occasionally pasta. All typos my own. https://t.co/Nzg67KsSxa
Joined April 2012
Part 2 of my tutorial series on plotting spatial data in #Blender3D using #geometrynodes. This time we're plotting points on a 3D globe.
1
1
36
For day 9 - Hexagons of the #30DayMapChallenge , surface temperature data + #Blender3D Geometry Nodes = a neat pinboard effect. #gis #maps #climate
5
73
510
Two months of Australian wildfire hotspot and aerosol data animated for day 16 of the #30DayMapChallenge. Link to 4K version in the replies.
11
76
341
@UrbanFoxxxx Specialized ships are the best. I love the absolute commitment to function over form.


4
36
284


@themadstone The fact that whales exist is my constant reminder of magic in the world 🐋 Like there are shockingly intelligent creatures the size of boats drifting through the oceans and singing to each other all the time. How magical is that!?.
6
13
161
For day 7 - Navigation of the #30DayMapChallenge , a Spilhaus-y animation of one of my favorite datasets: 18th century whaling logbooks from @mysticseaport. #maps #gis #datavis
4
24
203

Mapping weather data to elevation and colour on a 3D globe with interesting and slightly gooey results. #mapping #cartography #blender3d
3
36
168
@collin_doucet @GusRachels @hankgreen That's the part I feel worst about. The cast is giving 110%, the people doing the stunts, effects and production design are doing the best work of their lives. The music and directing is better than anything else on tv. But all of their insane work is being wasted on bad scripts.
0
2
128
Taking another pass at visualizing this summer's wildfires. This time with GEOS-FP black carbon mass composited over the MODIS hotspot data. Tried rendering out a couple of months' worth while I wait for the rest to download.
9
28
148
@AngieSparks29 @AdhdAngsty I love this explanation for it. It's such a good straightforward articulation of what's going on.
6
19
132


Embracing the stormy Maritime weather and experimenting with some of @John_M_Nelson 's tricks for creating antique looking maps. A little random noise and dashes goes a long way!


5
10
122
@solarrsystem We don't know the real word for bear. The word "bear" literally means "the brown one". It was used in ancient times because people believed that using the bear's true name would summon it. The taboo was so effective that the original name was lost and we were left with "bear".
3
2
128


9
27
115
I've been completely obsessed with the GEOS-FP relative humidity data for a while. For day 17 - Flow of the #30DayMapChallenge I decided to embrace the vibes and watch the planet breathe. #maps #gis #blender3D
3
23
143
One more animation (for now!) A bivariate map of surface temperature and humidity over one month. #blender3d #gis #dataviz #cartography #animation
1
9
130
Took another pass at today's map. This time, I tried sampling colours from photos of submerged rocks to try to get a more realistic light falloff in the water.

1
1
127
#30DayMapChallenge Elevation. More Blender experiments! A quick and dirty procedural contour generator.
1
6
102
For day 15 - Open Street Map of the #30DayMapChallenge , some of the layers making up Washington DC. #map #gis #cartography

1
11
102
@ziroth @hankgreen Significant growth in wind but primarily natural gas. Not perfect but around half the CO2 per kWh compared to coal so certainly a massive improvement.
1
0
80
I love how hypnotic this animation of atmospheric humidity turned out! This was also a fun chance to try a new visualization trick: While humidity drives the color ramp, the brightness is modulated based on windspeed, which seems to give the whole thing more structure.
3
11
95
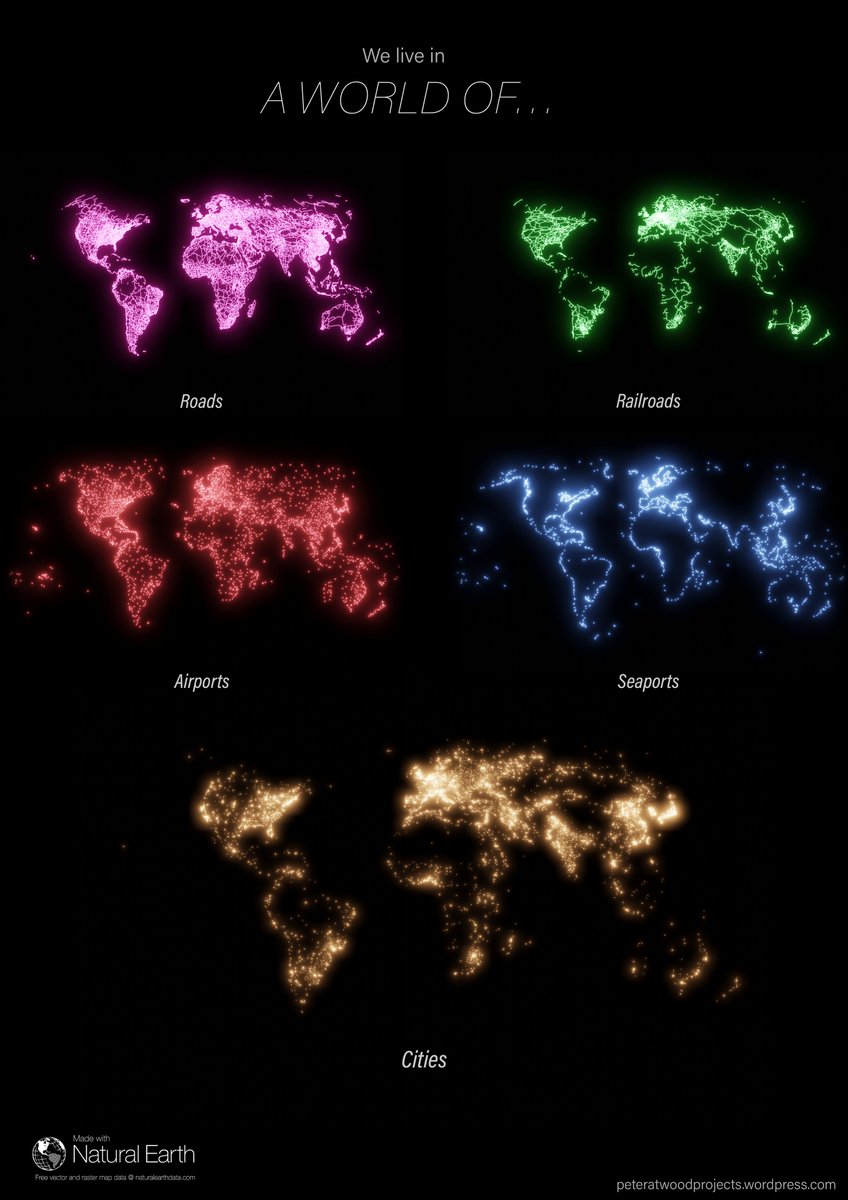
Finding more and more fun ways to use Blender as a cartographic tool. Emission material + bloom effect = a cool looking neon style! @blender_org #gischat
2
25
88
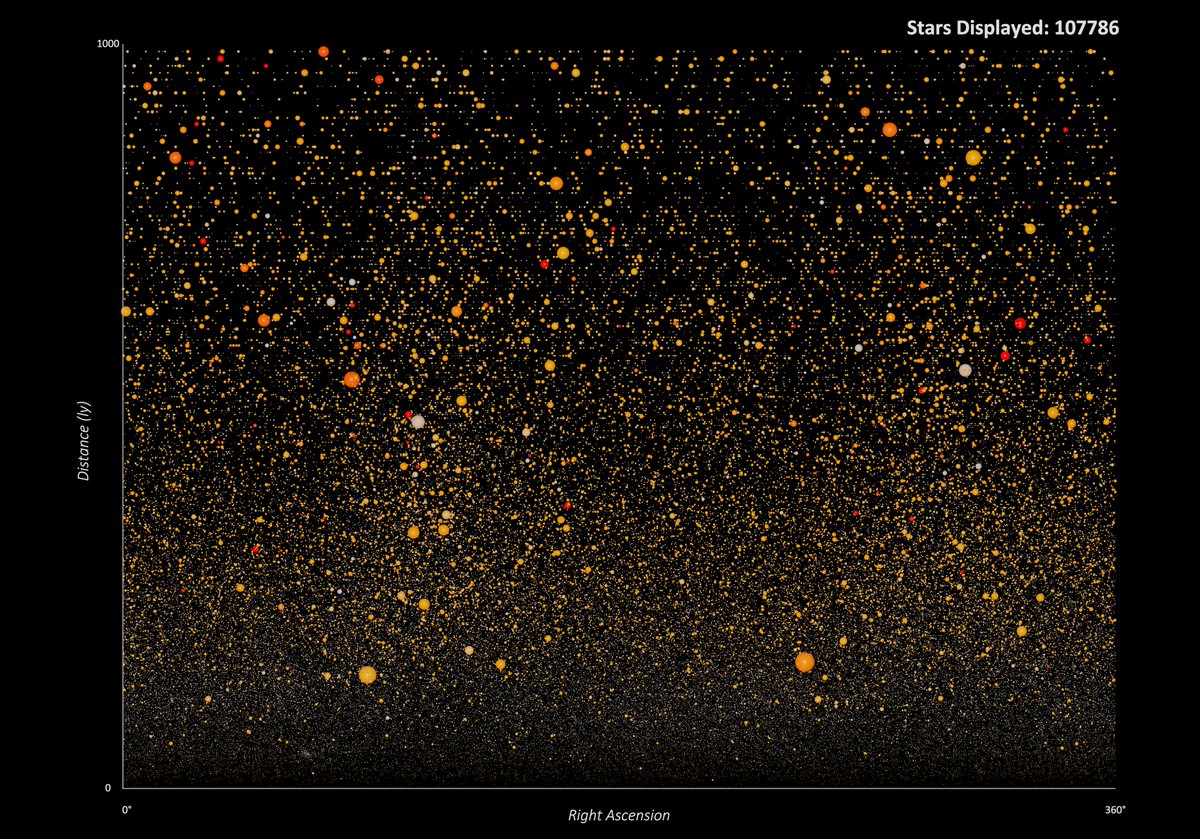
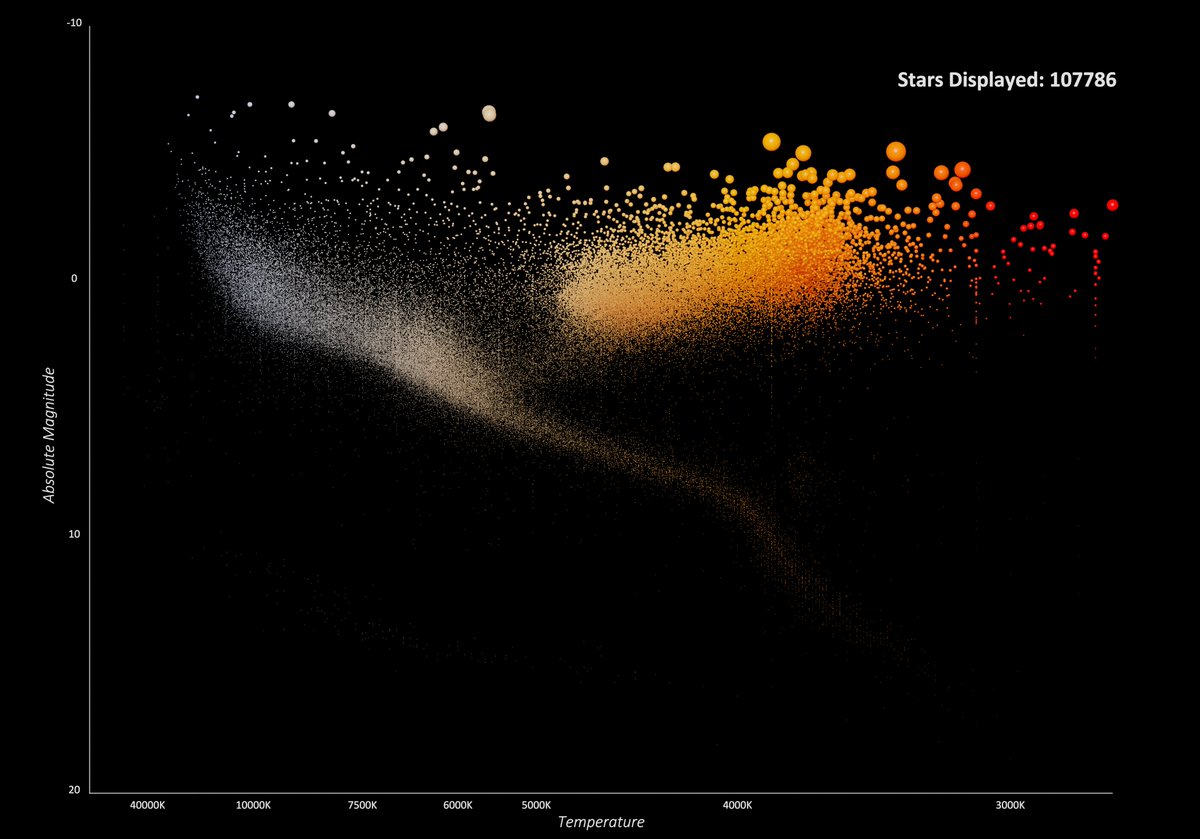
More experiments in data visualization in #Blender3d! Plotting 100k stars within 1000 light-years of the Sun. Thanks to @CgFigures tutorials for showing how to bring data into Blender. I love seeing the faint shape of the Milky Way emerge in the brighter more distant stars!
3
8
85
The #30daymapchallenge is always a fantastic opportunity to see what kind of data is out there. For day 2: Lines, GPS traces of Bobcats and Coyotes in Northern Washington state.

2
5
86
One of my favorite things about cartography is that every project gives me the opportunity to learn something new. For day 8 of #30DayMapChallenge - Africa, I decided to focus on a place that I knew very little about and explore a bit.

4
7
85
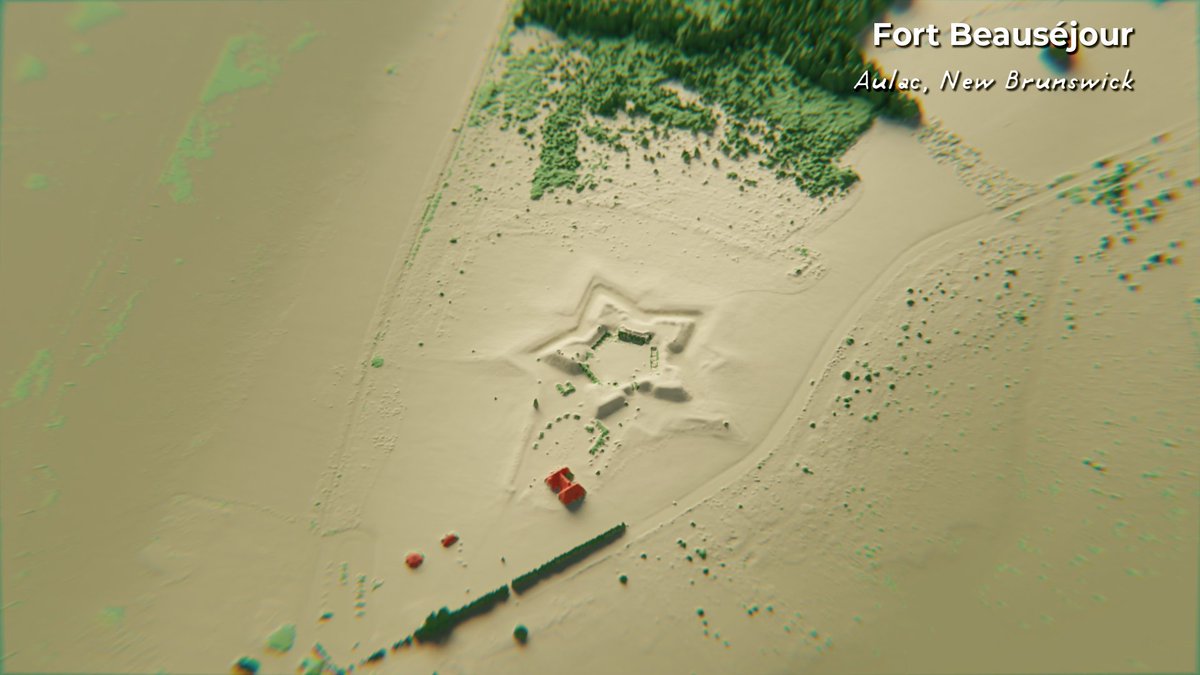
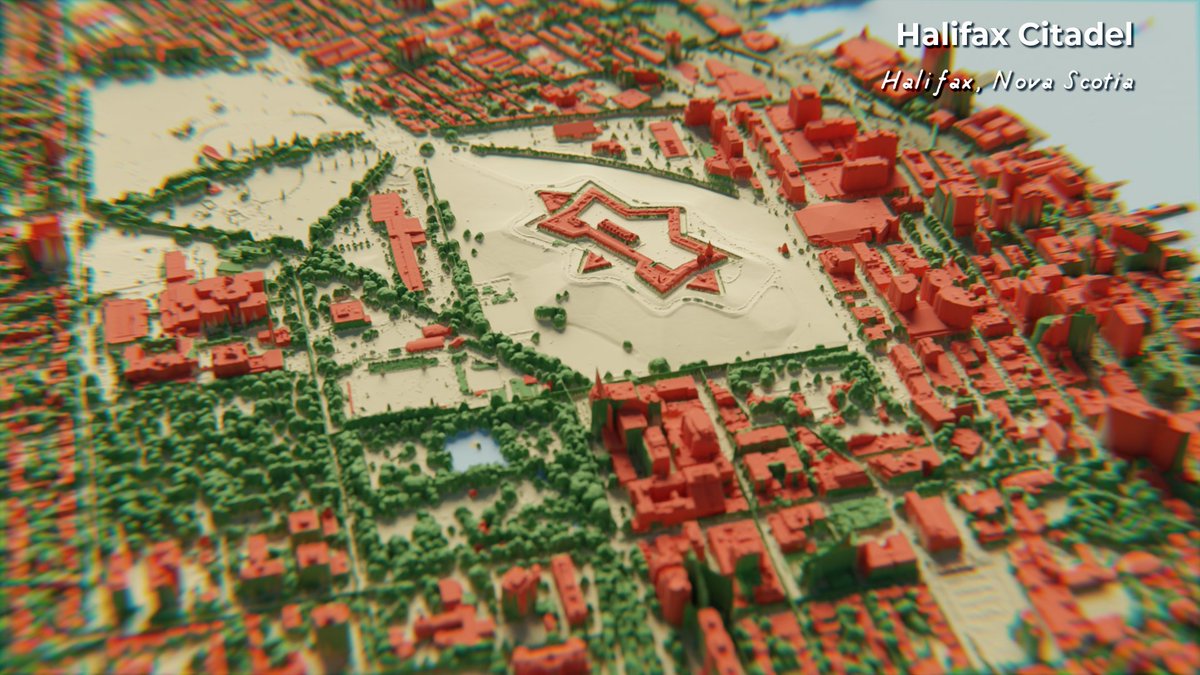
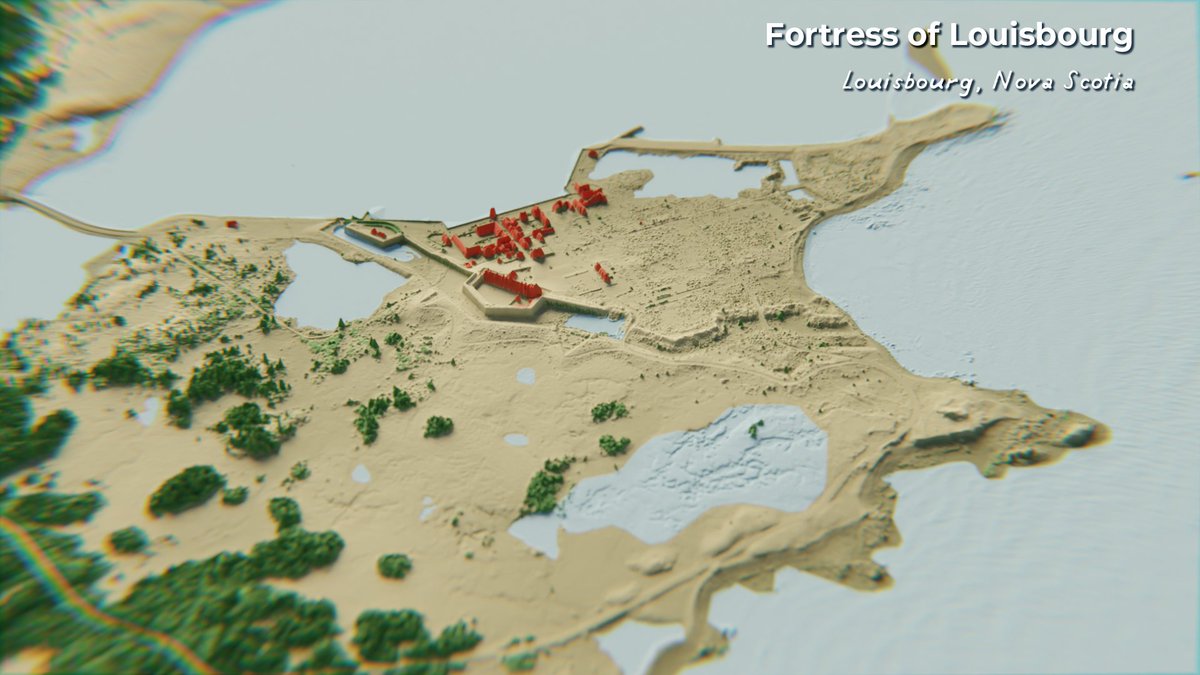
Wrapping up the #30DayMapChallenge with one of my favorite topics: local history, and one of my favorite datasets: @NSGeoNOVA LiDAR data. Fortifications around Nova Scotia and New Brunswick.

3
7
102
@PeterTiso @rachsyme I get that way about places. Like the city I used to live in kind of exists in two ways for me now. There’s the real, changing place that I don’t think about, and the place in my mind that’s frozen in the state it was in when I left.
2
2
78
New Blender cartography tutorial! Speeding up render times with the Eevee render engine. #b3d #creativecarto


1
17
77
Finally had some time to start exploring the temporal features in QGIS 3.14. 3 years of logbook entries from the whaling ship Charles Phelps.
5
10
72


One last animation (which always end up taking longer than I expect) for the #30DayMapChallenge. For day 18 - Atmosphere, the accumulated max wind speed during 2 months of the record-breaking 2020 Atlantic hurricane season.
0
9
65
@triops99 @philipjcowley My idea is that they should have qualifications as usual, and then reassign all the sports at random at the opening ceremonies. You placed first in qualifications for weightlifting? Now you're a rhythmic gymnast.
0
9
55
@JollyWangcore @hankgreen I spend way too long trying to figure out if “pissant” was a swear or not before I remembered “fucking” was.
0
0
49

For day 6 of the #30daymapchallenge - Asia, a quick render of Mount Everest and the surrounding landscape. #map #gis #blender3D

0
4
63
For day 20 of the #30DayMapChallenge - Outdoors, I got sucked into the incredible glacier-sculpted coastline of southern Nova Scotia, and had fun experimenting with blend modes from a tutorial by @pinakographos .

0
7
58
For day 4 of #30DayMapChallenge , perhaps not a bad map per se, but certainly a confusing one.

0
7
57
@hankgreen “I have the ability to impersonate every public figure on the planet. With that kind of power power, I could have. [tents fingers]. A HUNDRED THOUSAND DOLLARS! [evil laugh].”.
0
0
50

@fishinadish @tvoti It sounded like he heard it on a podcast once and decided it made him sound smarter.
0
0
38
For day 10 of the #30DayMapChallenge - North America, Marine Incident Reports from Transport Canada. Scaling the points by vessel tonnage makes the fishing grounds around Nova Scotia and Newfoundland stand out from the St. Lawrence shipping routes.

0
6
50
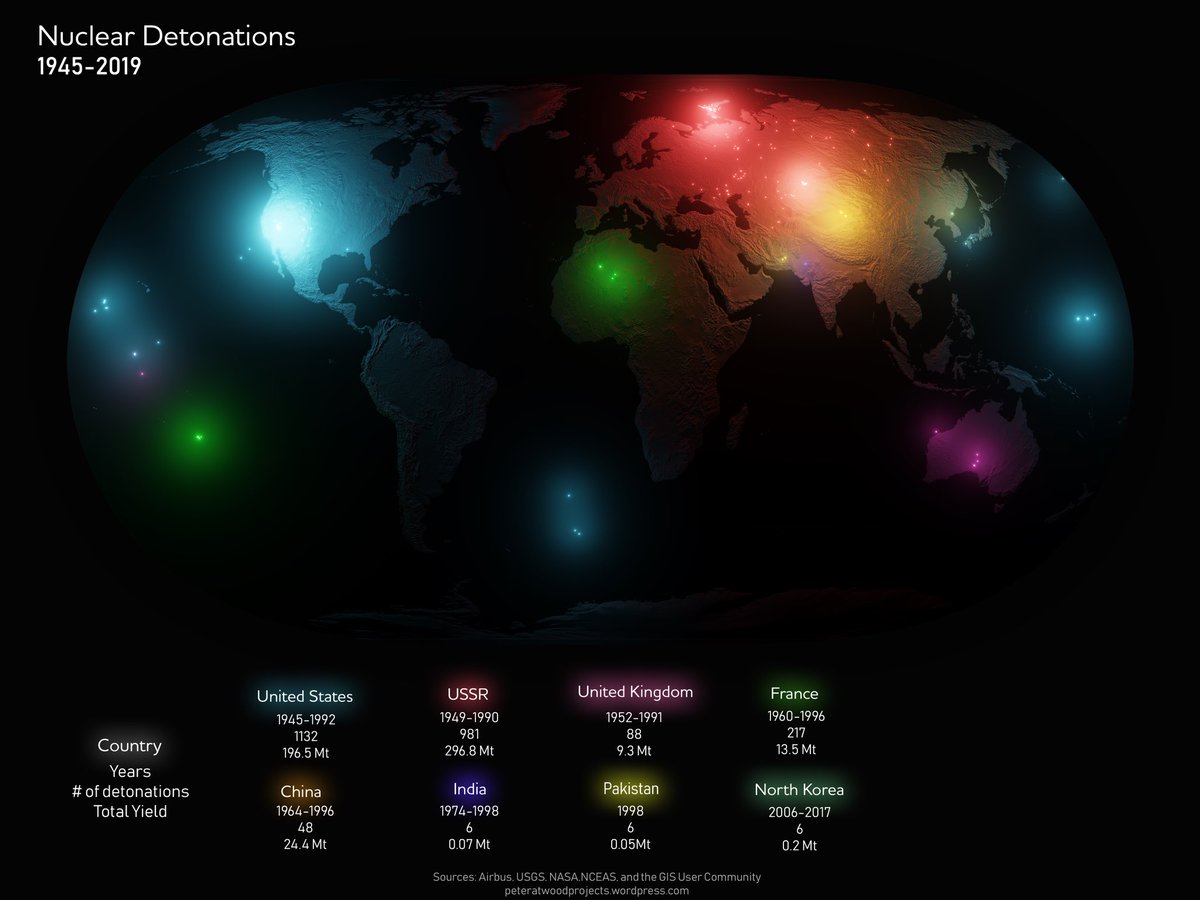
On July 16, 1945 the Trinity test became the first nuclear detonation in human history. It would be followed over the next 74 years by more than 2000 more.
4
33
47
First crack at geometry nodes. Using a landcover raster to scatter trees across a landscape. Still feels a bit like sorcery but making progress!

2
1
43
Using @pinakographos tutorial as a jumping off point, some tricks for cooking up procedural colour schemes for relief maps in Blender. #creativecarto #gischat #maps
0
5
44
@Alsadius @contrapolitical @wonderofscience The reason they don't take more frequent images is because the things they're measuring (global weather patterns) aren't (usually) subject to extremely rapid change. So they spend their data budget on resolution rather than frequency.
0
1
38
#30DayMapChallenge Cheating a bit today. Didn't have time to do something new but realized I haven't shared my lockdown project: landforms of Nova Scotia made by following @pinakographos blog post. A great learning experience!

2
5
35
0
1
37
Getting back to Blender for the first time in a while. The Cabot Trail winds along the right-hand side of the valley while the Skyline hiking runs along the opposite ridge.

5
0
32
Visualizing an unprecedented Canadian wildfire season, which has burned more than 17 million hectares of land over the past 6 months. #canada #wildfires #gis
2
8
34
A short animation mapping two of the record-breaking weather events that have hit Eastern Canada over the last few months. #animation #cartography #blender
1
1
34
Taking another crack at livestreaming this Friday. Creating a neat stacked relief effect with modifiers in Blender!


2
3
30


@jonathangreen @JPMajor @EllenDatlow @NASA The camera is exposing for the earth and the spacecraft which are much brighter than the stars. Same reason you can't see stars during the day.
1
0
28
@JessicaElisa93 @xkcd And it's weird that it gets reasonably close with the spelling too. You'd think that if it doesn't understand text at all it would spit out total gibberish, but it seems to get like 90% of the way there before it loses the plot.
0
0
25

Well, it took longer than I expected, but I'm very happy with the finished product. Heat and Smoke: the 2023 Canadian Wildfire Season.
1
5
21
8 months into my first "real" job and realizing I'm struggling to find time and energy to work on projects for myself, so I set a goal to make something for fun every week. Hoping to hit the ground running for #mapvember!
0
1
24
Taking inspiration from @jscarto, experimenting with animating GEOS-5 data. Charting the paths of hurricanes Fiona & Ian. Very interesting to see how Fiona interacted with another low pressure system before hitting Atlantic Canada.
1
3
27
For day 21 - raster of the #30DayMapChallenge , a REM of the surreal landscape of the Mackenzie River Delta.

0
0
25
Another weather animation, this time windspeed. Plus a bit of a mystery. Any ideas what the clusters of small circular pulses visible over the ocean are? Shockwaves from lightning strikes maybe?
1
2
21

@MapPornTweet Thanks for the shoutout! Here's a slightly updated version (removed a stray point in Australia, tweaked the lighting a bit and added total yields for each country)

2
7
21
@NotoriousNickyJ @uneek35 @FoldableHuman @JennyENicholson I honestly would have guessed those were a brand of margarine and an Overwatch hero, respectively.
0
0
15
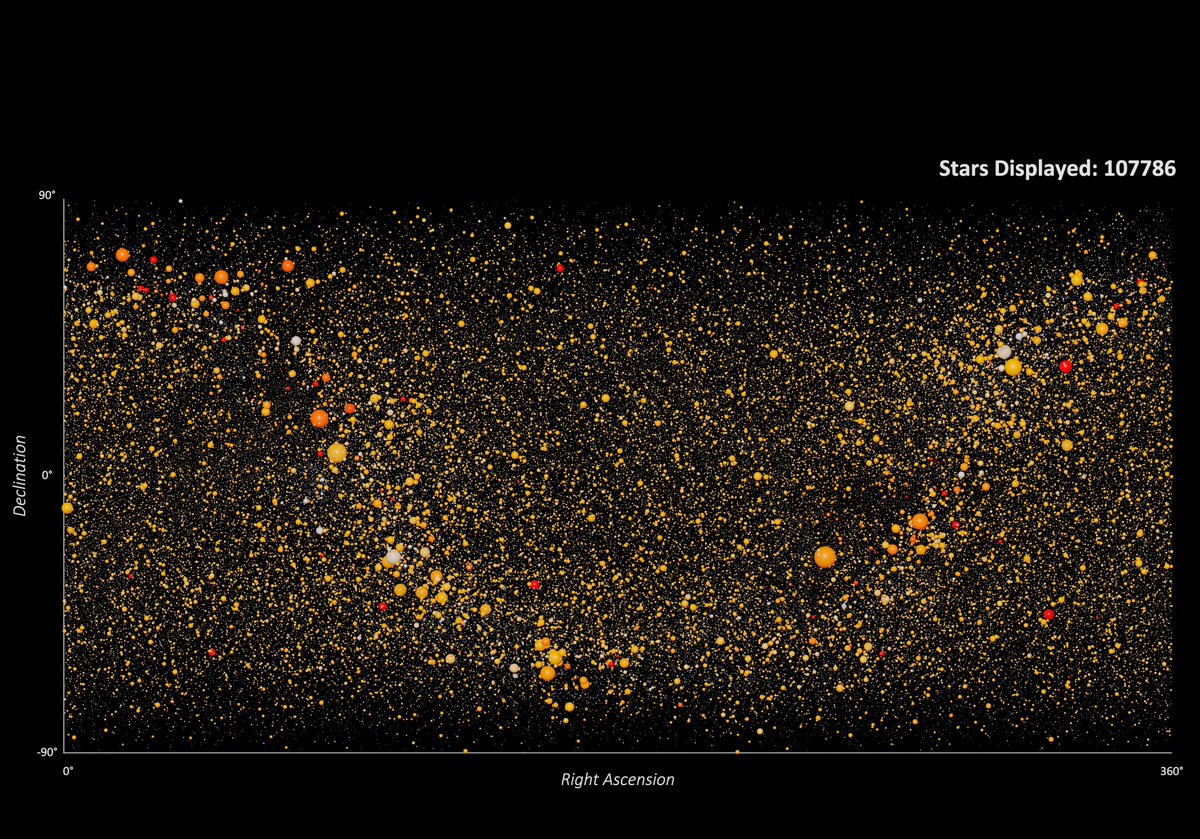
Another project from the archives for day 22 of the #30DayMapChallenge North is Not Up. The position in the sky of 100,000 catalogued stars. If you squint, you can see the shape of the Milky Way.

0
2
21
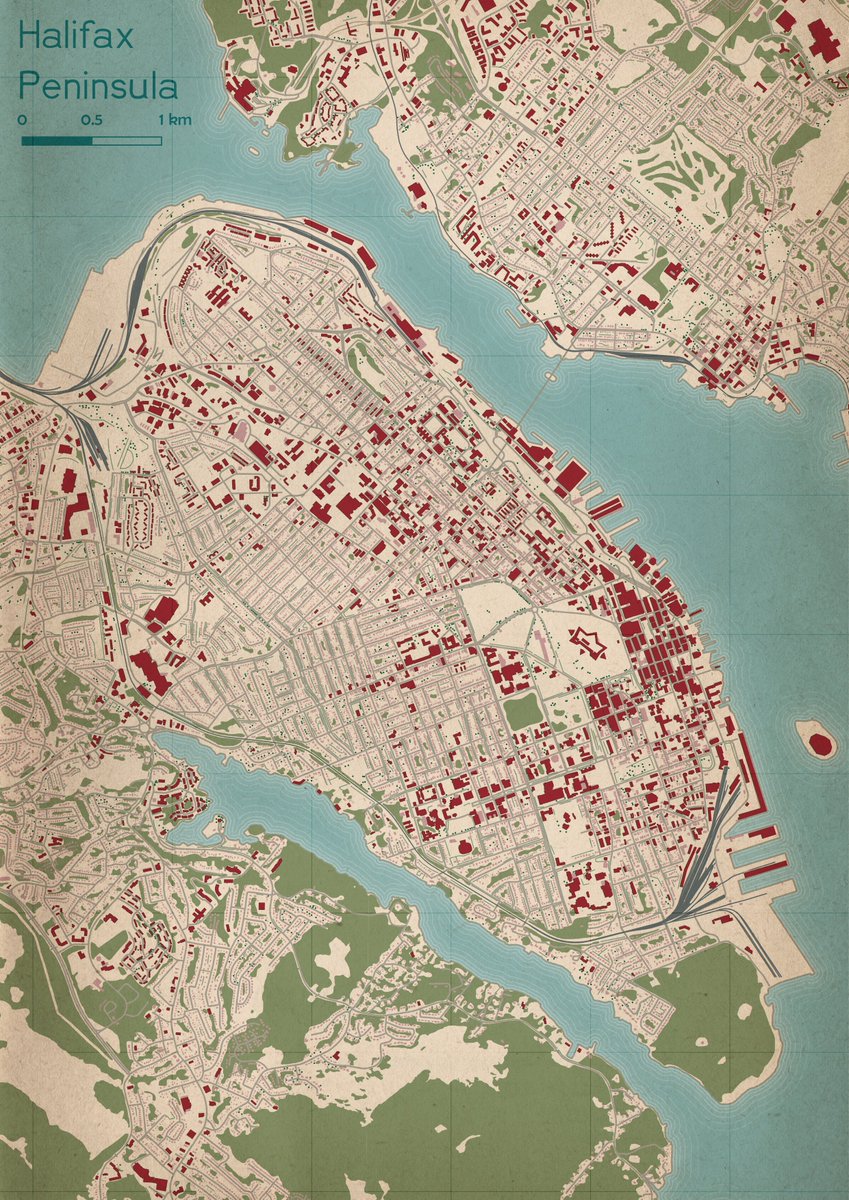
I didn't have a lot of time for day 3 - Polygons, but it seemed like a good time to dig up some previously unshared renders! Halifax City Parks. #30DayMapChallenge #Map #blender3D #b3d #dataviz

0
1
20
@Alsadius @contrapolitical @wonderofscience B and C aren't true in this case. The satellites that took these images are new (2014 and 2018 respectively) and are in geostationary orbits (they stay above the same point on Earth).
2
0
22

A slightly belated final #30DayMapChallenge . Having some fun with the shaders from a couple of days ago and the CLIWOC dataset.


1
1
16
@keni19941901 @PSFAERO That is 100% a picture of a Nimitz class carrier photoshopped in. Also not remotely to scale, that would be comically oversized fireball for a ~1 ton conventional warhead.
4
0
15
This was fun to put together. Animating 5 years of cyclone tracks.
0
3
19
@worstchann @MaximesHond @iHarshalWatts Season 3 🙂 it’s the one where Pierce’s dad shows up. Britta’s talking about his ivory toupee (I watched it yesterday, im not crazy, I promise).
1
0
13
#30DayMapChallenge Historical. Log entries from the CLIWOC database mentioning "death". The route of the transatlantic slave trade becomes apparent.

0
1
17
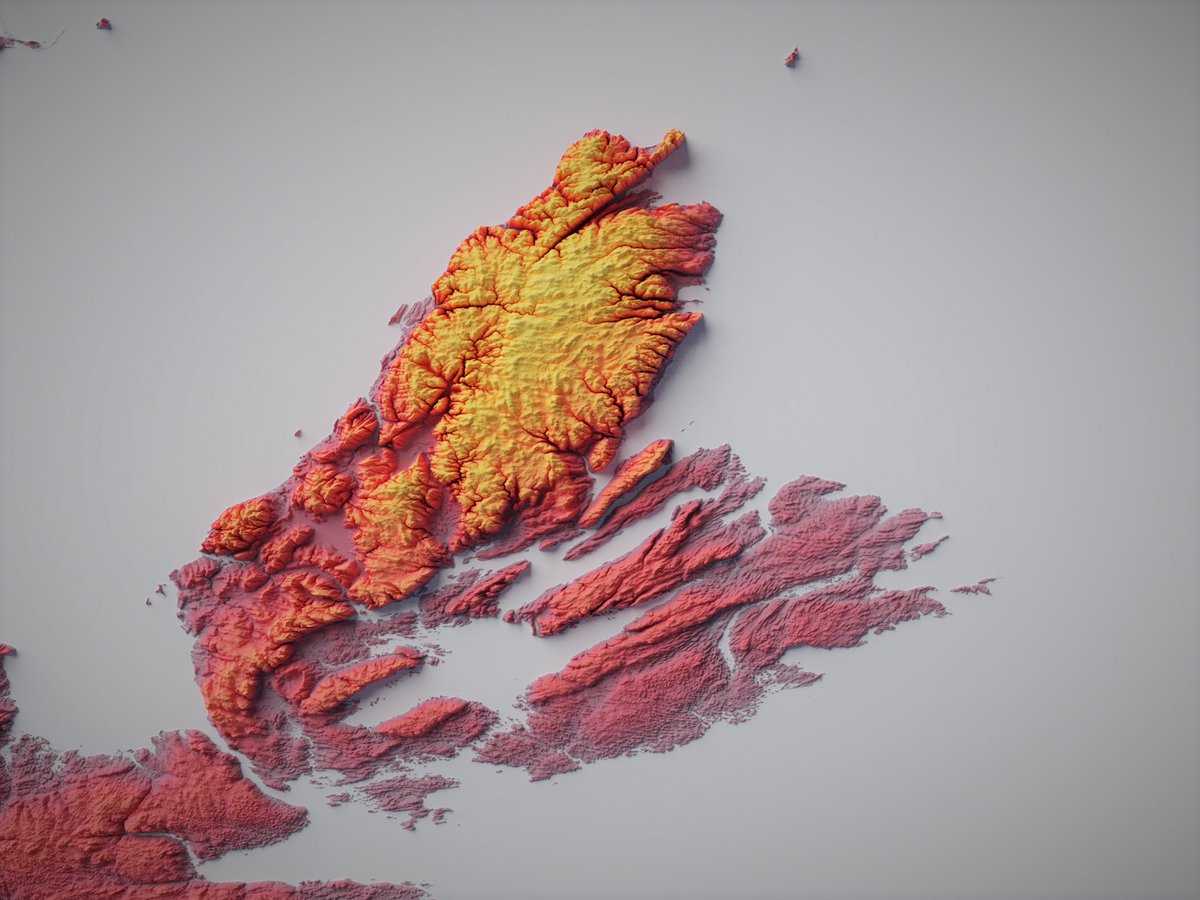
Catching up a bit in the #30DayMapChallenge. Using a neat trick from @Mrdodobird to hexify a map of Scotland I was working on earlier in the year.


1
1
18

This week's experiment in using geometry nodes in Blender for data visualization. Documented conflict fatalities since 1989.


0
2
16


Really excited to learn #howtodomapstuff today! And take my first crack at livestreaming later this afternoon!
4
1
15
@j_mcelroy Okay, now I’m going down a rabbit hole of political leader lifespan trivia. For the last year and a half of his presidency, Richard Nixon was the only living US president.
2
0
12


@fellawhomstdve That's about where I'm at. My two takeaways were A) huh, maybe Dune IS unadaptable but B) If that's true, this is the closest anyone's ever going to get.
0
1
12

For Day 13 of the #30DayMapChallenge - Choropleth. I think there's probably a reason why we don't see a lot of trivariate maps. Still fun to play with though!

0
1
11
@shitshowdotinfo @seungylee14 @Kazanir Timbuktu is a solid runner up. Also a big fan of Indianapolis.
1
0
20
Got sidetracked playing around with yesterday's data. 4 flavours of mars


0
0
12
Visualizing the global scale of American whaling 1790-1900 using 400,000 ship's log entries. Data from @whalingmuseum and @mysticseaport #dataviz #Map


0
7
8