

The Leuthold Group
@LeutholdGroup
Followers
16K
Following
142
Media
373
Statuses
913
Institutional Research & Investment Management Disclosure: https://t.co/jZZZtQNGaY Distributor: Quasar Distributors, LLC
Minneapolis, MN
Joined June 2009
We have been active asset allocators for about four decades. Our outlook is long term, yet we continually evaluate the market's underlying health and make changes as needed. $LCR Leuthold Core ETF.$LST Select Industries ETF.$LCORX Leuthold Core Fund.
1
0
7
The Philadelphia Fed Business Outlook Survey offers an early glimpse into the ISM Manufacturing Survey, and the latest figures are grim: New Orders have dipped into the contraction zone, while Prices Paid have surged to levels last seen in June 2022, when consumer inflation hit


0
2
3

Between April 1st and July 31st, the Cap-Weighted S&P 500 surged by +13.4%, notably exceeding the Equal-Weighted $SPX's +6.5%. This marks the third-best four-month period for Cap-Weighted upside relative to the EW index since the #Y2K tech boom. #Investing #MarketTrends

2
0
2
Through July, a conspicuous spike in $RIND (+7.3% YTD) is confirmed by 2 other commodity price gauges (in sharp contrast to CPI & PPI). This is worrisome as rising input costs could hinder CPI's progress to 2%

0
2
4
We recently noted the spike in CRB Raw Industrials ($RIND) and other commodity indices. For those looking to hedge against swiftly escalating input costs, diversified commodity ETFs present solid choices. Since the inflation trough in May 2020, such ETFs have substantially

3
0
3
CRB Raw Ind Index (RIND) tracks manufacturing input costs and can foretell inflation trends. By July-end, RIND's striking +7.3% YTD increase is mirrored by two other commodity price measures, contrasting with CPI & PPI. This is concerning, as rising input costs could hinder CPI's

6
4
11
The stock market has shrugged off these warnings, but it's getting more and more difficult to argue that the U.S. economy has done the same.
0
2
10
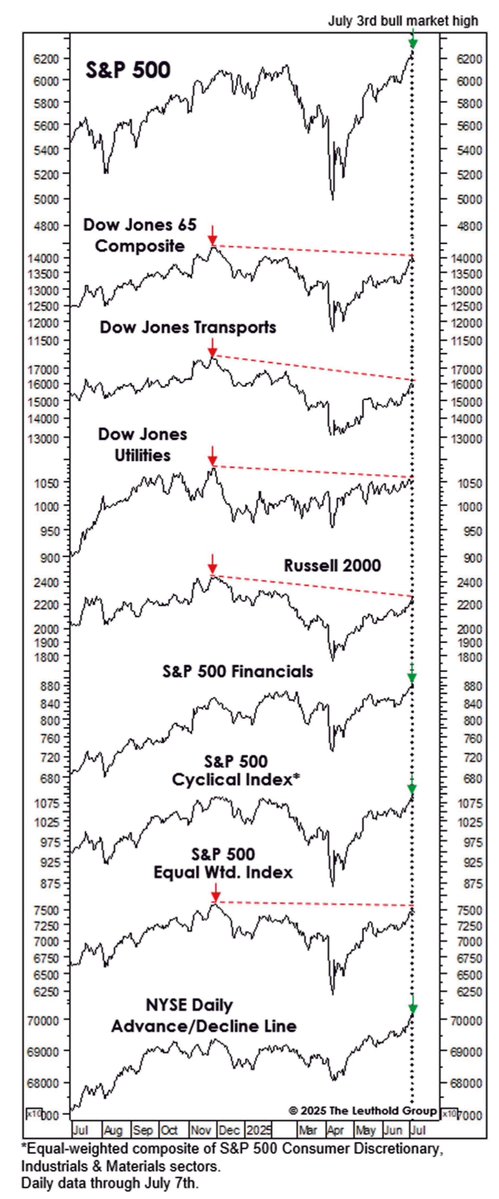
Most bellwether indexes verified the Jul-28th $SPX high, but there are divergences: DJ Transports still 12% below peak and Trucking nearly 36% lower. Vs $SPX, Baa bond spreads look as bad as the Truckers. Action of Baa's & Truckers is worse than the lead-up to '07 pre-GFC high.

2
4
19
NYSE Daily A/D Line, EW S&P 500, Financials, and our Cyclical Composite all reached new bull market highs in late July. At the February highs, those same indexes (and a few others) were laggards.
0
0
4
The stock market appears more promising in late summer than it did at its Feb. 19th peak. Although not cheap, it's no pricier than it was back then. S&P 500 Forward EPS, Normalized EPS, and Cash Flow have climbed alongside prices.Technically speaking, $SPX's late-July highs were

2
4
14
Leuthold Select Industries ETF (LST) employs an uncommon approach of investing through industry concentrations and equity themes using a broad multi-cap universe of stocks. LST has a 25-year track record of solid results. More at @XtolloInv is a

0
0
2
At Jul-31st, $SPX bull mkt gain was +79%--remarkable given 1) the bull began w/ U.S. economy @ full employment and 2) the prior bear-market low occurred w/ some of our LT valuation measure still in their TOP quintile. Recent highs put S&P 500 in same zip code as March-Y2K.


1
2
15
Leuthold PM Greg Swenson talks with William Hortz @strategicaccts about our tactical investment methodology and perspectives on asset allocation and equity group rotation amid volatile, uncertain, complex, and ambiguous market environments.
2
0
3
NVIDIA's impressive 13% rise accounted for nearly 1/2 of $SPX's 2.2% gain in July. $NVDA finished the month with an unprecedented (since 1990) 8.1% index share. Together, the weights of #NVIDIA and $MSFT match the combined weight of the S&P 500’s smallest 332 firms. #StockMarket.
1
2
8
RT @jamesjrogers: This is why meme stocks have ‘bubbled back to the surface,’ @LeutholdGroup fund manager says via….
marketwatch.com
Meme-stock behavior among some retail investors never really went away, a portfolio manager at Leuthold Group said.
0
5
0
With current debt and deficits escalating, the Fed will likely need to lower rates and allow inflation to run hot. Leuthold's Chun Wang cited by @NickLazzaro for @SPGMarketIntel #MonetaryPolicy #InterestRates #Inflation.
spglobal.com
Market stakeholders anticipate an injection of liquidity following pending interest rate cuts this year, but premature moves from the Fed could trigger consequences that offset this benefit.
5
1
3
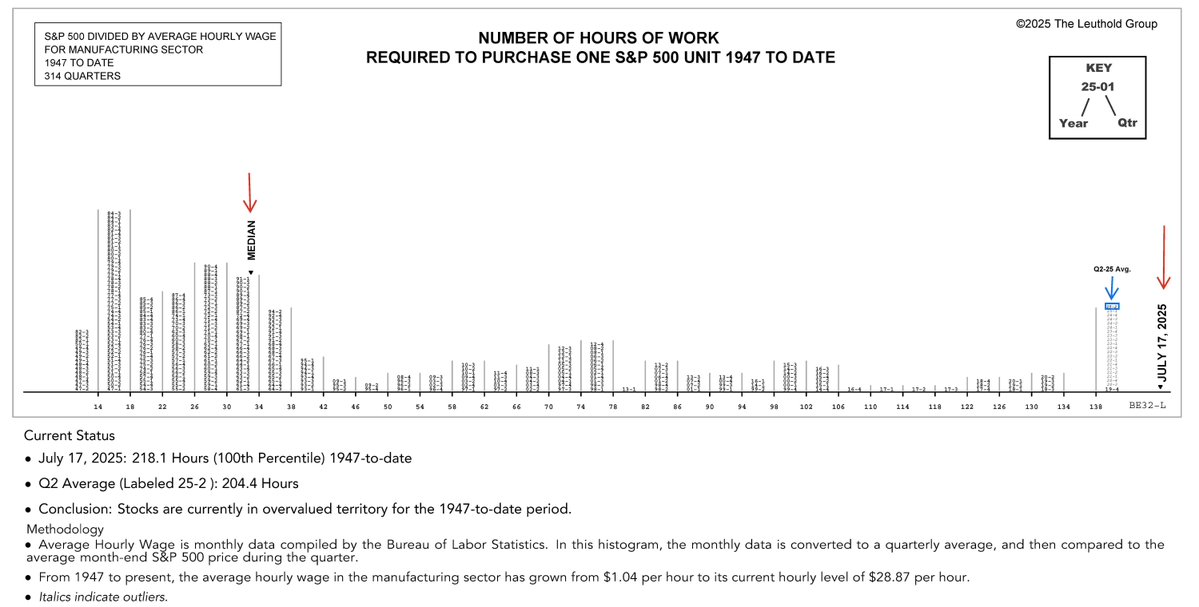
Since 1947, the standard of living in the U.S. has consistently improved, boosting workers' buying power. However, sky-high valuations have sharply reduced stock market purchasing power. It now takes over 218 work hours to afford one $SPX unit. #StockValuations #WorkerWages
2
4
13
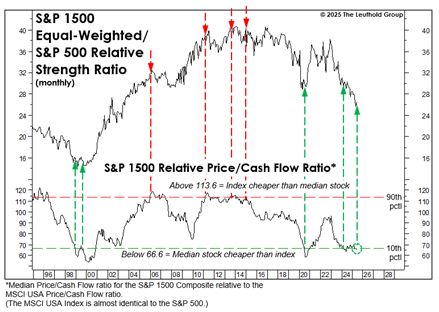
In June, S&P 1500's normalized P/E ratio fell below its median, implying potential returns for the average stock near the +10% LT norm. The relative Price/CF sank to the lowest decile, usually a trigger for a rebound in the avg stock vs $SPX. #StockMarket #Investing
3
3
23
We're choosing to wait a bit before deeming the straggling bellwethers as yellow flags.
0
1
4
Just 3 out of 8 leading indicators have confirmed the new $SPX bull market peak. Uneven recoveries are not unusual, though, considering the ~19% drop earlier this year. $RUT #Stocks #Investing
1
0
9