
Dr Caroline Holmes 🌊❄️
@CHolmesClimate
Followers
870
Following
111
Media
51
Statuses
998
Polar Climate Scientist researching Antarctic sea ice @BAS_news; mum of two. All views my own.
St Neots, England
Joined June 2010
For various reasons, September has been hard. Thanks to @XanderArmstrong @ClassicFM this morning for restoring my soul (Widor, Barber AND Tchaikovsky)
0
0
2
t's hard to wrte up analyss on Antarctc sea ce wthout an '' key...
0
0
6

Interviewed by @TimesRadio today on ocean warming and Antarctic sea ice. To be welcomed onto live radio as a person who stammers, and for stammering to not be the subject of the interview or indeed a big deal to anybody involved, feels pretty good indeed.

"If the ocean decides to release the heat to the atmosphere like this year, that leads to more rapid atmosphere warming," @kaitlinnaughten tells @alexisconran. She warns record sea ice loss in Antarctica has the potential to further warm our oceans. @TimesRadio | @BAS_News
4
8
77

Today is #EarthOvershootDay 🌍 Today marks the date when “humanity’s demand for ecological resources and services in a given year exceeds what Earth can regenerate in that year!” Basically we’ve used all of Earth resources for the year and now we depete it!😢
109
43
124

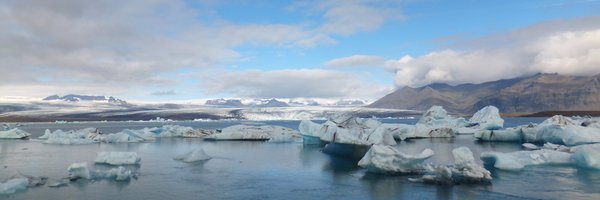
The current level of Antarctic sea ice is beyond anything in the last 120 years. #Antarctica #ClimateCrisis
16
126
231
#Antarctic #seaice : GREAT video disentangling the jargon and some of the issues around sigmas etc. (similar vibe to my 🧵 but easier to follow!) - I agree that '1 in ... million' is ✅v. helpful to conceptualize ⁉️ pushing what the data can tell us
0
0
0

#Antarctica is currently missing an area of ice bigger than Greenland. It's clear that we're seeing an extraordinary event unfolding. So, you've seen the graphs: what do they mean? Find out in our @ConversationUK article with @CHolmesClimate
https://t.co/HAowgzlB1b
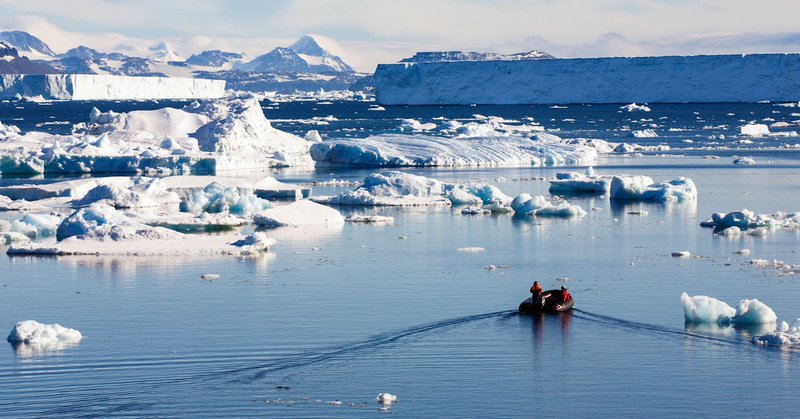
theconversation.com
Sea ice extent in July 2023 has been around 10% below last year’s record low for the month.
139
176
356

@ZLabe @micefearboggis @Dr_Gilbz @CHolmesClimate Here’s a really useful story on Antarctic sea ice from @readfearn to add to the thread of explainers
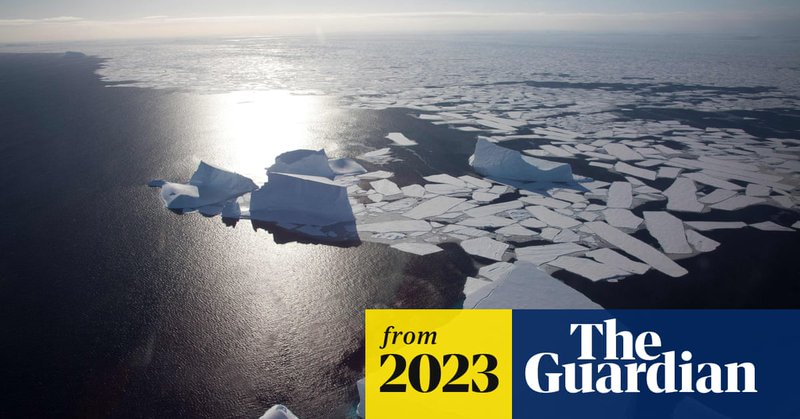
theguardian.com
Some scientists fear the ‘shocking’ shift is the beginning of a global heating-linked collapse of the ice that could have alarming knock-on effects
1
3
9
But (back to the top) the exact number isn't really important! (15/15)
1
0
19
Next, to go from '5-sigma' to '1 in 7.5 million years': we have to assume a "normal distribution"; i.e. that the probability of something (sea ice) having a certain value follows a certain set of rules. If sea ice doesn't, then '1 in 7.5 million' could be way off. (14/15)
2
0
16
Putting aside that that might not be a 'natural' period, 30 years is VERY short to estimate variability. We have good reason to think sea ice might have longer periods (naturally) where it's 'higher' or 'lower', increasing it's overall variability. (13/15)
1
0
15
"What does it mean?": To meaningfully say it's '5-sigma' assumes we know what 'sigma' is. In other words, it assumes we know our 1991-2020 sea ice record is a good estimate of how sea ice varies 'naturally'. (@kevpluck using 1981-2010 as baseline now has 7-sigma) (12/15)
1
0
16
Pause; the 'anomaly' has reduced (a bit) since early July but we've gone from '5-sigma' to '6-sigma'?! Why- because the sigma (=standard deviation) value decreases sharply in July (pic!): (i.e. sea ice seems to vary more year-to-year at the start of July than the end). (11/15)
1
0
15
The 5-sigma (previously; 6-sigma, now) value comes from dividing our anomaly by the standard deviation. It's a way of measuring how unusual something is (in this case, this year's sea ice) given how much we think it varies (in this case, from satellite data since 1979) (10/15)
1
2
14
Here's the anomaly this year (=this year's value minus the 'average' value); we've been below-average, and near-record, all year, but that 'difference from normal' grew from early April to early July, as sea ice froze much more slowly than normal. (9/15)
1
1
15
SO, there's very little Antarctic sea ice (in case you missed that)! It's far below previous record. Or, we're about a month 'behind' average annual sea ice freeze-up cycle. Sea ice is about 500km south of where we'd expect in many places (quick back-of-envelope!) (8/15)
1
2
18
I just show this year and my plots are embarrassingly Excel-in-a-hurry. See, again, gorgeous vis by Zach Labe, for other years and for aesthetics! (7/15)
1
0
11
nuts and bolts 2: standard deviation (=sigma) and mean are calculated from 1991-2020, consistent with @EliotJacobson but different from @kevpluck , @NSIDC and Zach Labe. Changes anomalies not-much, changes 'sigma value' quite a lot (more below!) (6/15)
1
0
12
nuts and bolts 1: I use 5-daily running-mean Sea Ice Extent ( https://t.co/mzhyOJMNps). 5-daily doesn't change the key numbers or conclusions, but is more physically meaningful, and the graphs are clearer. (5/15)
1
0
13
Also, because we *know* that human emissions are making a lot of the other extremes happening more likely, getting caught up in the exact numbers for Antarctic sea ice isn't the most important thing (doing something about those emissions is!). That said, diving in... (4/15)
1
1
17