
Zack Labe
@ZLabe
Followers
63K
Following
41K
Media
11K
Statuses
28K
Climate Scientist at @ClimateCentral | PhD | Views, thoughts, and opinions expressed are only my own ----- now posting on Bluesky -----
Harrisburg, PA
Joined July 2011
Looking for polar climate visualizations? Start here: 📈📉 + Arctic sea-ice extent: https://t.co/tBkW5GBgHF + Arctic sea-ice thickness/volume: https://t.co/qXpJKsA27B + Arctic temperatures: https://t.co/QEaNIX4gLG + Antarctic sea ice: https://t.co/V0Lt0w1sTi
99
504
940
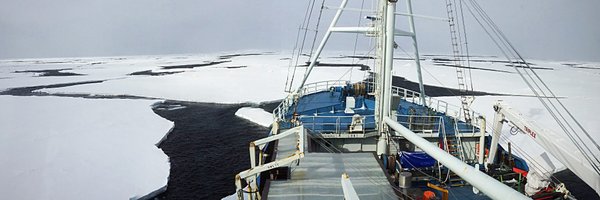
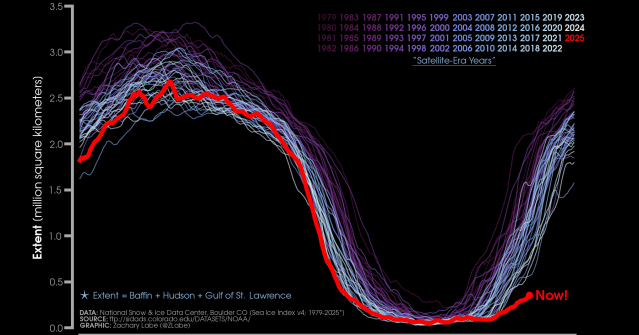
October 2025 was the warmest October on record for the #Arctic. Arctic sea-ice extent is currently the lowest on record for late November. My newest 'climate viz of the month' summarizes some of this latest data: https://t.co/4QzBhL1jQc
#SciComm #OpenScience #OpenData #DataViz
zacklabe.com
October 2025 Hi everyone! Instead of designing a new special feature visualization, this next ‘climate viz of the month’ blog will focus on briefly summarizing the recent extremes in th…
31
236
569
Occasional reminder where you can still find my daily weather/climate posts and data viz: #ClimateChange #SciComm + (primary, daily updates) https://t.co/QVzYx8FJQA + (website) https://t.co/56YHrvjfiW + https://t.co/AyjaPZ6jsk + https://t.co/vVl151ChfF + https://t.co/zsJU2527mW
1
10
27

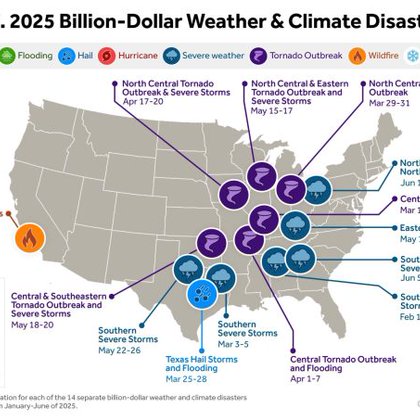
The U.S. Billion Dollar Disasters database is back and now run by a nonprofit, Climate Central. In just half of 2025, 14 disasters caused $101 billion in damages, with the Mississippi Basin among the hardest hit. Read from Desk reporter @hectoraarzate
vernonreporter.com
It shows that in 2025, approximately $40 billion in damage was caused by severestorms and tornadoes that struck states like Illinois, Missouri, Tennessee, and others. Oct. 28, 2025 Byline: Héctor...
0
3
6
My next monthly blog is out, which looks at a new graphic of local Arctic amplification rates in boreal fall compared to the average over the entire year: https://t.co/4QzBhL1jQc
#DataViz #SciComm #OpenScience #OpenData #ClimateChange
zacklabe.com
October 2025 Hi everyone! Instead of designing a new special feature visualization, this next ‘climate viz of the month’ blog will focus on briefly summarizing the recent extremes in th…
1
6
25

FIFA World Cup 2026™ Panini Stickers are now available!
0
39
534
📣 The "U.S. Billion-Dollar Weather and Climate Disasters" data is back today through @ClimateCentral! ➡️ Explore our new interactive website at https://t.co/B12FgV9IwH, which is now updated through the first half of 2025 & totaling over $101 billion from individual 14 events.
4
9
20

How one Earth system scientist mastered climate science communication How do you make complex climate science click with the public? For Zack Labe ’20 (Ph.D., Earth System Science, UC Irvine), the answer is simple: let the data speak. From tracking snowstorms as a kid in
3
5
32

🌡Every month, Climate Central breaks down the latest science on climate change in a free monthly newsletter delivering: ▶️Localized climate impact insights ▶️Science-backed updates ▶️User-friendly tools and visualizations Subscribe today! https://t.co/urNMNpJBi8
5
11
21
📣 Check it out! Explore the new data viz on our homepage: https://t.co/6fFpvmjmyO We just released a new tool to explore climate impacts in U.S. cities and states - making complex data easier to understand for your community. 🚨 What are Fall climate threats where you live?
3
11
33

NEW – Antarctic sea ice winter peak in 2025 is third smallest on record | @AyeshaTandon Svetlana Onye w/ comment from @ZLabe Read here: https://t.co/WS7qbhf7D1
2
11
18
➡️ Check out my new 'climate viz of the month' blog, which reviews sea ice conditions across the #Arctic Ocean from this past summer: https://t.co/4QzBhL1RFK
#DataViz #SciComm #OpenScience #OpenData #ClimateChange
1
10
26
We have a new book chapter out called "The future of sea ice" which I am excited to share: https://t.co/cf7IEUUFjz. It reviews both the #Arctic and #Antarctic. If you are interested, don't hesitate to reach out 🙂
1
5
28

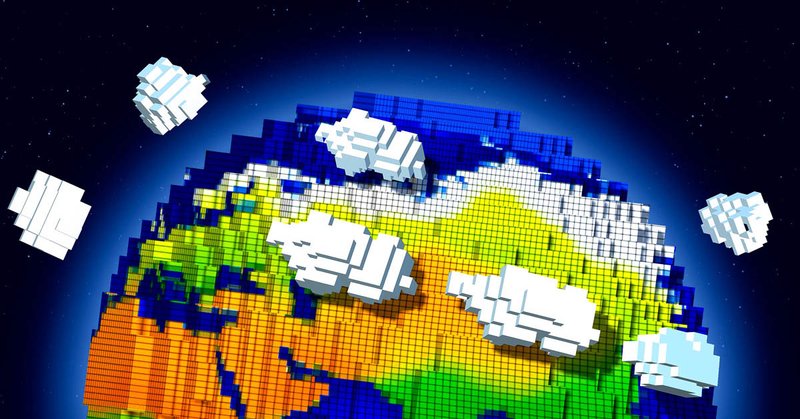
After centuries of effort, scientists have largely succeeded in digitally reconstructing the Earth in order to ask how its climate will change in the future. Now some people, not liking the answer, are reaching to unplug the machine. @savagitsky reports:
quantamagazine.org
Over the past 60 years, scientists have largely succeeded in building a computer model of Earth to see what the future holds. One of the most ambitious projects humankind has ever undertaken has now...
1
15
22
Visualizations with the latest Earth monitoring data (I encourage sharing them 😊): 📈 Global climate indicators: https://t.co/53ZaRhYYry 📉 Polar climate indicators: https://t.co/ysoGwwYtqb 📈 United States climate indicators: https://t.co/6tLExjBQaG
5
64
139
✅ We have a new study out this week, which projects changes in cloud-to-ground (CG) lightning days across the Western United States, along with the associated risk of lightning-ignited wildfires (LIW). + #OpenAccess: https://t.co/lW6TzrbLsL + Summary: https://t.co/1QoFjrHmqF
5
25
73

"Abrupt changes" threaten to send the continent past the point of no return, a new study finds.

grist.org
New research catalogs several “abrupt changes,” like a precipitous loss of sea ice, unfolding in Antarctica with dire implications for us all.
3
18
26
I have a new 'climate viz of the month' blog posted, which looks at the regional differences in days with open water across the #Arctic: https://t.co/4QzBhL1jQc
#SciComm #DataViz #OpenScience #OpenData #ClimateChange #SeaIce
4
12
34
"Summer is behaving very erratically as the country warms, with large changes in some regions, especially the West, and very muted ones in the central and southeast US." via @CNN:

cnn.com
Average temperatures elide a complex reality: The country’s experience of hotter summers — and thus one of the most visceral aspects of climate change itself — is fractured along geographic lines.
6
9
38
If you haven't seen these amazing climate data graphics, I suggest you check out the work of @ZLabe here

zacklabe.com
U.S. Climate Indicators By Topic… [click on headings] Temperature Trends Temperature Time Series Humidity Trends Sea Surface Temperature Trends Sea Surface Temperature Time Series Precipitati…
1
4
9
Just a quick update to highlight that I've been adding a number of different metrics on my climate indicators page for the United States, check it out at https://t.co/6tLExjBil8.
#ClimateChange #SciComm #DataViz #OpenScience #OpenData #ClimateScience
4
40
90