

Todd Jones 🦊
@toddrjones
Followers
14K
Following
8K
Media
949
Statuses
6K
Econ professor, @msstate, @CESifoNetwork, @iza_bonn | Applied micro, econ of ed, data viz, coding tips | Alum @USUAggies, @Cornell | Latter-day Saint | Dad x 3
Joined November 2010
Quick @Stata tip: I've added 43 new tips to my book, bringing the total to 140. You can download "Quick Stata Tips" and the accompanying .do file for free at
3
66
229
Tired of the election map? The yellow states in the map below are the states in which it is legal to own a RACCOON.

200
2K
9K

Tired of the election map? The yellow states in this map are where you can legally own an otter.

181
2K
8K
Tired of the election map? The yellow states in the map below are the states in which it is legal to own a RACCOON.

217
942
6K
The remarkable decline in child mortality, where each dot is a country.
77
2K
7K
I find it ironic that PhDs who take a tech job starting at $300,000 are considered by many in academia to not have done well on the job market.
73
130
4K
I #givethanks for the many ways the world has improved. Child mortality has fallen. Life expectancy has risen. Countries have gotten richer. Women have gotten more education. Basic water source usage has risen. Basic sanitation has risen. / Data from @Gapminder. Dots=countries.
21
534
2K
Falling fertility around the world, 100+ years. Credit to @countcarbon for the flags idea as well as general data visualization inspiration.
32
672
2K
This #Thanksgiving, I #givethanks for the many ways the world has improved. Child mortality has fallen. Life expectancy has risen. Countries have gotten richer. Women have gotten more education. Basic water source usage has risen. Basic sanitation has risen. Data from @Gapminder
15
360
1K
The remarkable decline in child mortality since 1800, where each dot is a country. #GoodNewsGraphs
17
417
1K
The steady increase in women's education across the world. #GoodNewsGraphs . Each dot is a country, and the y-axis is the average years of education for women aged 15-24.
15
439
929
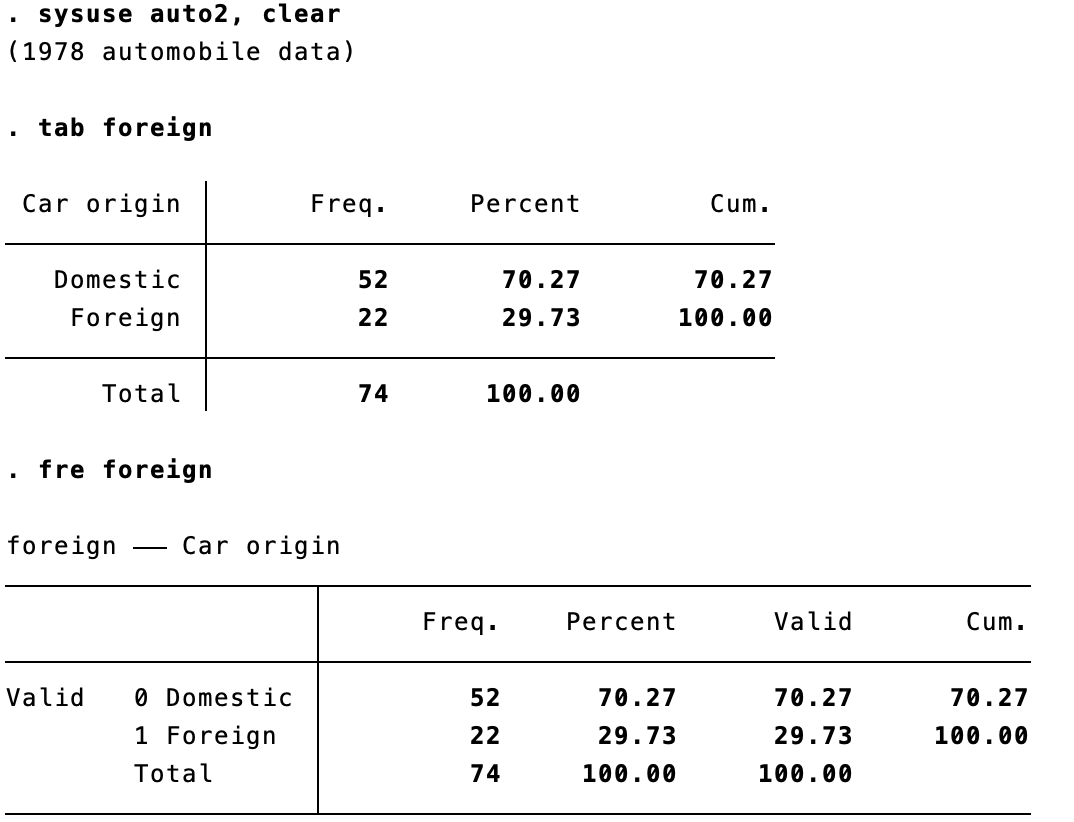
Quick @Stata tip: if you want to look at frequencies of a variable, "fre" displays both values and labels at the same time, while "tabulate" does not. To use "fre":. ssc install fre.fre variable_name
12
70
839
Quick @Stata tip: To quickly see how many observations of each variable are missing, use "mdesc":. ssc install mdesc.mdesc

6
73
838
Useful tip: @Stata supports multi cursor mode. In Mac, hold down Option and drag the cursor. In Windows, hold down Alt.
23
102
794
Quick @Stata tip:. keep if inlist(state, "AL", "AK", "AZ"). is the same as:. keep if state=="AL" | state=="AK" | state=="AZ". And:. keep if inrange(distance, 10, 91). is the same as:. keep if distance>=10 & distance<=91.
11
56
766
Quick @Stata tip: use "getcensus" to pull variables from the American Community Survey (ACS). ssc install getcensus.*replace XYZ w/ your key.global censuskey XYZ.*get population by county.getcensus B01003, year(2015) sample(5) geography(county) clear. (Code to graph below)

12
102
612
Quick @Stata tip: if you want to look at frequencies of a variable, "fre" displays both values and labels at the same time, while "tabulate" does not. To use "fre":. ssc install fre.fre variable_name

11
63
649

There are more cows than people in the states colored blue.

41
115
565
Percentage of county population (at least 25 years old) who have a Ph.D.

35
76
579

Women now get more education than men in most countries. The y-axis is the ratio of average years of schooling for 25-34 yr old for women vs. men. More than 100 indicates women get more education than men.
24
183
502

Quick @Stata tip (ICYMI): if you want to look at frequencies of a variable, "fre" displays both values and labels at the same time, while "tabulate" does not. To use "fre":. ssc install fre.fre variable_name

8
53
486
Quick @Stata tip: I've written a book that compiles 97 of my Stata tips. You can download "Quick Stata Tips" and the companion .do file for free at
18
130
499
There are more than 30,000 unclaimed first-round vaccination appointments across 19 sites in Mississippi. Everyone 16 and older is eligible. I am a bit baffled.
41
60
406

Quick @Stata tip: you can use ChatGPT within Stata with the "chatgpt" package (Windows users only).

6
99
479
Quick @Stata tip (ICYMI): To quickly see how many observations of each variable are missing, use "mdesc":. ssc install mdesc.sysuse lifeexp.mdesc

3
57
469
The remarkable rise in life expectancy, 1900-2016, split by continent. #GoodNewsGraphs #rstats
8
197
441
The remarkable decline in child mortality, 1900–2016, where each dot is a country. #GoodNewsGraphs
4
106
431
Quick @Stata tip (ICYMI): after a regression, you can use "r(table)" to directly get the 95% confidence interval, p-value, standard error, beta, etc. sysuse auto2, clear.reg trunk weight.matrix list r(table).local weight_lower_95ci = r(table)[5,1].di "`weight_lower_95ci'"

4
49
428


‘Unfilmable’ Books That Hollywood Should Try to Adapt After ‘Dune’
6
51
399
How has the world changed? This 🧵 compiles many of my plots on, eg., child mortality, fertility, GDP, women's education, and life expectancy. Thanks to @Gapminder for the data! #rstats . First, child mortality has dropped precipitously all over the world. #GoodNewsGraphs (1/N)
9
222
399
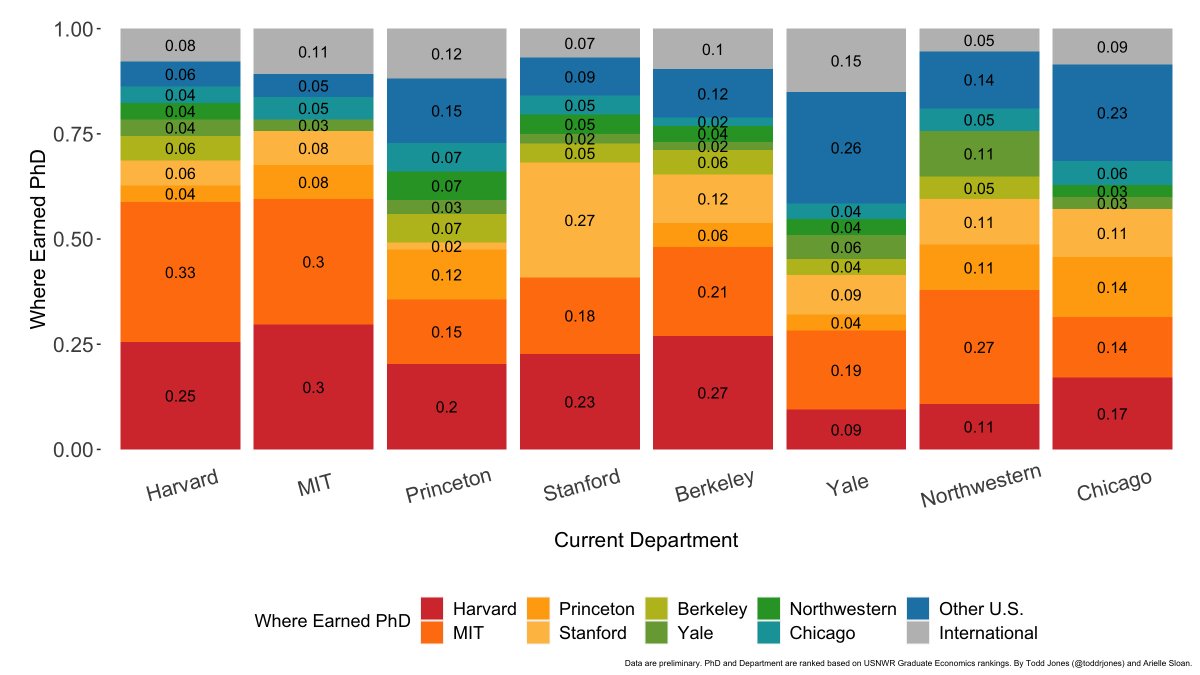
Where did the faculty of top economics departments get their Ph.D.s?

23
74
399
Quick @Stata tip: use "ereplace" to replace when using "egen" commands:. *typical way:.sysuse auto2, clear.*doesn't work:.replace mpg = max(mpg).*instead:.egen mpg2 = max(mpg).drop mpg.rename mpg2 mpg. *better way:.ssc install ereplace.sysuse auto2, clear.ereplace mpg = max(mpg).
12
42
388
Quick @Stata tip: It's very easy to simultaneously use multiple cursors. On a Mac, hold down Command (⌘) and click everywhere you want to place your cursors. On Windows, hold down Control and click. (h/t @PSullivanT.)
8
40
382
Quick @Stata tip (ICYMI):. keep if inlist(state, "AL", "AK", "AZ"). is the same as:. keep if state=="AL" | state=="AK" | state=="AZ". And:. keep if inrange(distance, 10, 91). is the same as:. keep if distance>=10 & distance<=91.
10
29
370
Need a break from the election map? The yellow states are where you can legally own a fox 🦊.

24
151
369
Where did the faculty of top economics departments get their Ph.D.s?
13
61
367
My paper’s been rejected seven times in a row. At what point do you just give up (on the paper)?.
88
19
351
Quick @Stata tip: you can add opacity to your graph by adding "%X" after the color, where 0≤X≤100:. sysuse sp500, clear.replace high = high+80.twoway (hist high, width(20) color(blue%50)) (hist low, width(20) color(red%50)), scheme(s1mono) legend(order(1 "Blue" 2 "Red"))

3
32
363
Quick @Stata tip (ICYMI): To quickly see how many observations of each variable are missing, use "mdesc":. ssc install mdesc.sysuse lifeexp.mdesc

5
37
351
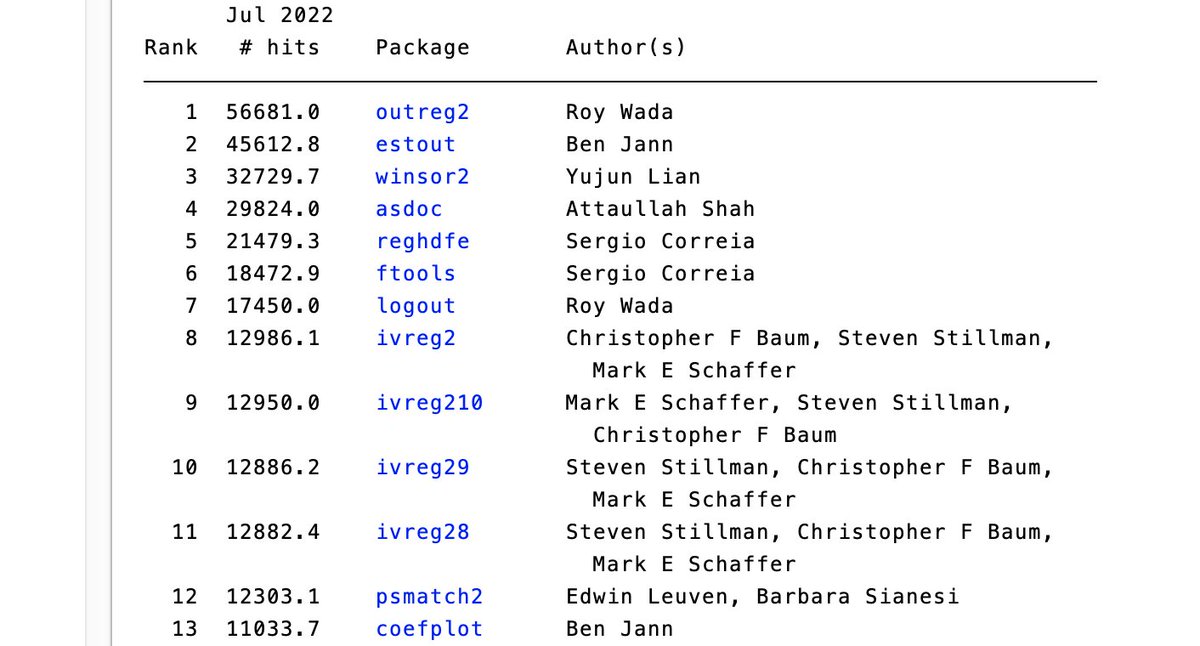
Quick @Stata tip: use "ssc hot" to see the most popular user-contributed SSC Stata packages:. ssc hot, n(100)
0
47
336
Quick @Stata tip (ICYMI): use "getcensus" to pull variables from the American Community Survey (ACS). ssc install getcensus.*replace XYZ w/ your key.global censuskey XYZ.*get population by county.getcensus B01003, year(2015) sample(5) geography(county) clear. (Graph code below)

7
53
311
The fascinating relationship between child mortality and fertility, were each dot is a country.
13
161
307
Quick @Stata tip: you can show variation over time and space using an animated map (1/2):. ssc inst maptile.ssc inst spmap.maptile_install using ".sysuse census, clear.ren (state state2) (q state).g year = _n+1900.fillin state year
3
36
310
Quick @Stata tip: to make an animated graph:. sysuse uslifeexp, clear.forv i = 1900/1999 {.sc le_m le_f if year==`i', ti(`i') sch(s1mono) ysc(r(35 80)) xsc(r(40 80)) yla(40(10)80) xla(40(10)80).gr export `i'.png, replace.}. [Mac] Terminal - cd to dir, then:. convert *.png a.gif
7
29
309


Quick @Stata tip: To quickly see how many observations of each variable are missing, use "mdesc":. ssc install mdesc.sysuse lifeexp, clear.mdesc

3
43
316
Where did the faculty (right) of the top 96 USNWR-ranked economics departments get their PhDs (middle) and Bachelor's (left)?

9
33
303
Quick @Stata tip: To quickly see how many observations of each variable are missing, use "mdesc":. ssc install mdesc.mdesc

6
34
313
Every single day I wish Economics papers were longer. I mean, why settle for 80 pages when you can go for 120?.
20
11
291
I am thrilled to announce that I will be joining Mississippi State University (@msstate) as an Assistant Professor of Economics! . Huge thanks to @Cornell/@CornellEcon for my PhD and @GeorgiaStateU/@aysps/@GAPolicyLabs for my Postdoc!.
37
8
288
When the professor lets you bring a paper to the exam, you bring this.

19
21
303
Quick @Stata tip: To quickly see how many observations of each variable are missing, use "mdesc":. ssc install mdesc.sysuse lifeexp, clear.mdesc

2
41
284
Quick @Stata tip: use "statastates" for a crosswalk between two-digit US state abbreviation, state name, and state FIPS code. capture ssc install statastates.sysuse census, clear.keep state2.statastates, abbreviation(state2) nogen.replace state_name = strproper(state_name)

6
27
257

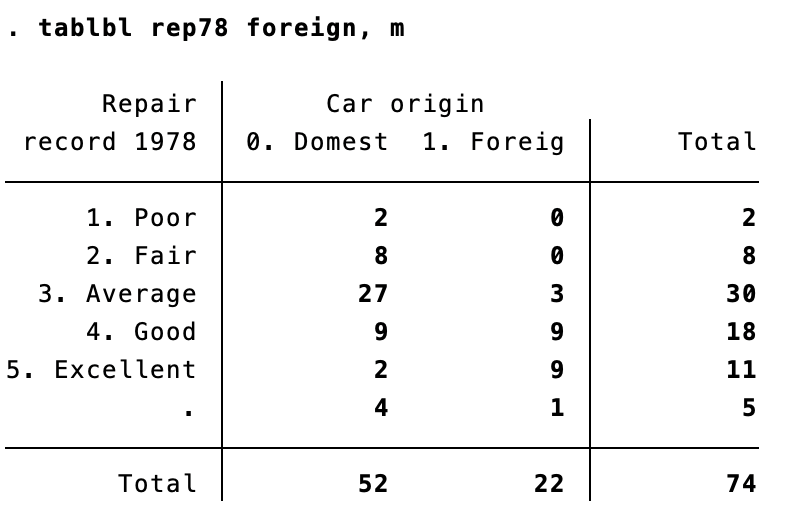
Quick @Stata tip: "tablbl" displays both values and value labels for one-way and two-way frequency tables, while "tabulate" does not. h/t @thomasgoldring. net install tablbl, from(.sysuse auto2, clear.tablbl rep78 foreign, m
6
35
273
Quick @Stata tip: here's how to create a flexible regression table with panels using "texdoc":


3
32
271
Quick @Stata tip (ICYMI):. keep if inlist(state, "AL", "AK", "AZ"). is the same as:. keep if state=="AL" | state=="AK" | state=="AZ". And:. keep if inrange(distance, 10, 91). is the same as:. keep if distance>=10 & distance<=91.
7
33
265

Quick @Stata tip: to make an animated graph:. sysuse uslifeexp, clear.forv i = 1900/1999 {.sc le_m le_f if year==`i', ti(`i') sch(s1mono) ysc(r(35 80)) xsc(r(40 80)) yla(40(10)80) xla(40(10)80).gr export `i'.png, replace.}. [Mac] Terminal - cd to dir, then:. convert *.png a.gif
5
33
248
Quick @Stata tip: To quickly compare two variables to see how often the values of the first are higher, lower, and equal to the second, you can do:. compare var1 var2.
2
8
241
Quick @Stata tip: To check if a variable is constant within group, you can do:. bys group (var): gen a = var[1]==var[_N].tab a. If all values of a are 1, the variable is constant within group.
9
23
231
What kind of starting salary (and stock options) do PhD economists get at places like Facebook and Amazon?.
22
22
230
Quick @Stata tip (ICYMI): if you want to look at frequencies of a variable, "fre" displays both values and labels at the same time, while "tabulate" does not. To use "fre":. ssc install fre.fre variable_name

6
25
224
The breathtaking decline in child mortality across the world, 1900-2016. Maybe things aren't as bad as we think they are! #Factfulness @Gapminder #GoodNewsGraphs
5
106
207
Quick @Stata tip: to have the ability to scroll up as far as possible in your Results window: . set scrollbufsize 2048000.
4
15
217
Quick @Stata tip: . keep if inlist(state, "AL", "AK", "AZ") . is the same as: . keep if state=="AL" | state=="AK" | state=="AZ" . And: . keep if inrange(distance, 10, 91) . is the same as: . keep if distance>=10 & distance<=91.
2
16
210
Quick @Stata tip: use "binscatterhist" to show a binned scatterplot along with histograms of the variables. h/t @matteopins. ssc install binscatterhist.sysuse auto2, clear.binscatterhist weight length, hist(weight length) ymin(1100) xhistbarheight(30) yhistbarheight(13)

2
29
202
Quick @Stata tip: you can make Sankey plots in Stata:. ssc install sankey.use ", clear.sankey value, from(source) to(destination) by(layer) noval showtot palette(CET C6) laba(0) labpos(3) labg(-1) offset(10). See h/t @AsjadNaqvi!

1
33
201

Quick @Stata tip: when using bysort, say you have a variable you want to sort with, but *not* group by. Put this variable in parentheses:. sysuse census, clear.*keep least-populous state within each region, so sort by pop within each region:.bys region (pop): keep if _n==1.
2
16
200
Quick @Stata tip: here's how to create a flexible regression table with panels using "texdoc":


3
36
205
Quick @Stata tip: Stata supports multi cursor mode. On a Mac, hold down Option and drag the cursor. On Windows, hold down Alt. You can also place multiple cursors. On a Mac, hold down Command (⌘) and click. On Windows, hold down Control and click.
7
21
195
Quick @Stata tip: To test if observations of a variable are unique (i.e., no value repeats), use "isid". No output means it's unique. sysuse auto2, clear.keep if _n<15.isid make.isid gear_ratio.isid turn.*test if observations are unique within a group.isid gear_ratio turn.
5
26
195
Quick @Stata tip: use "getcensus" to pull variables from the American Community Survey (ACS). ssc install getcensus.*replace XYZ w/ your key.global censuskey XYZ.*get population by county.getcensus B01003, year(2015) sample(5) geography(county) clear. (Code to graph below)

5
24
186

Quick @Stata tip: after a regression, you can use "r(table)" to directly get the 95% confidence interval, p-value, beta, standard error, etc. sysuse auto2, clear.reg trunk weight.matrix list r(table).local weight_lower_95ci = r(table)[5,1].di "`weight_lower_95ci'"

2
32
195
Quick @Stata tip: use "mscatter" to create scatter plots with color gradients. (h/t @friosavila). cap ssc inst mscatter.cap ssc inst palettes.sysuse sp500, clear.mscatter change close if inrange(change, -30, 30), msymbol(O) msize(7) sch(s1mono) over(change) colorpalette(viridis)

7
20
194
When the teacher lets you bring a page to the exam, you bring this.

15
4
195
Here are some useful, publicly-available datasets:. 1. NIBRS - individual-level crime data covering ~50% of US.2. ATUS - 24 hour time use diaries linked to the CPS.3. US natality data via NBER.4. 1850-1940 full count US censuses via IPUMS.5. FARS - US traffic fatality data.(1/2).
2
22
190
In most countries, women get more years of education than men. Y-axis is difference in avg. years of ed for 15-24 yr old women vs. men -> a positive # means women get more ed than men. Falling dots do not nec. mean women's ed is falling; likely just increasing slower than men's.
8
78
183
Quick @Stata tip: you can make alluvial plots in Stata: . ssc install alluvial.sysuse nlsw88.dta, clear.alluvial race married collgrad smsa union. See h/t @AsjadNaqvi

3
19
189
Where did the faculty of top economics departments get their Ph.D.s? . To find out, I gathered data on the faculty of Berkeley, Chicago, Harvard, MIT, Northwestern, Princeton, Stanford, and Yale. #EconTwitter (1/2)

12
57
180