
Stats Beerz
@statsbeerz
Followers
195
Following
55
Media
3
Statuses
153
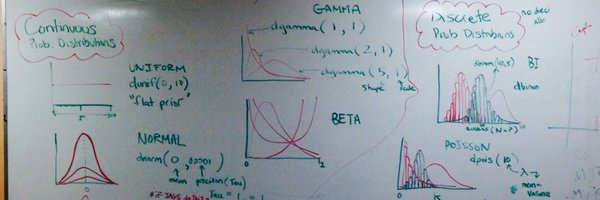
This is an informal get-together of SFU ecologists and statisticians to bounce around ideas on graphing, coding and statistics; from ANOVAs to Z-scores.
Vancouver, Canada
Joined September 2013


Making beautiful figures? Struggling with colour choice? Look no further:
To find the most beautiful palette of colors to use in your R figures, use Cindy Brewer's website https://t.co/BVtMjKcUSX and then set the colors to the hex values, e.g. col=c("#8dd3c7", "#FFFFB3", "#BEBADA", "#FB8072", "#80B1D3","#FDB462") #Rstats
2
6
11

0
2
3

Are you curious to learn what #rstats & #tidyverse can do for you and how they work? Yes, then this 8 page “Getting Started in R” guide is for you. It uses realistic examples and a real life dataset to wrangle, visualise and summarise data. Try it now at https://t.co/EjA3bAsaps
0
1
7

I was recently asked to give a stats talk in my department on how to analyse zero-inflated count data, which is a common problem in ecology (and especially behavioural ecology). I came up with this flowchart and thought I'd share it in case it's useful for any of you #rstats
29
522
1K

In effort to standardize data, add ecological context to specimens, & bring consistency across projects, @botanic made custom field books for 2018 season. Complete w/ pages for ecological site descriptions, all terms are defined in partnering #metadata dictionary @SpnhcTdwgNZ
5
20
61

What's key to a successful technical team for a project that synthesizes and analyzes loads of environmental #data w/ #openscience tools? Our own @juliesquid of @OHIscience shares her insight & experience w/@OceanHealthIndx
https://t.co/qod6y2jfhm
#rstats @RLadiesGlobal
0
4
6

How to start contributing to #rstats packages? Here’s a great write-up of why and how @dobbleobble worked with maintainer @ma_salmon to add functionality to monkeylearn.

[blog] Monkeying around with Code and Paying it Forward, by @dobbleobble
https://t.co/1I03ntb3jq
#rstats @monkeylearn
0
12
32

0
1
1

Do you want your #Research to last longer and have a broader reach? Make it easier to include in a #MetaAnalysis! @GerstnerK explains how to do just that: https://t.co/hK1rz7rmHf This article was shortlisted for the 2017 #RobertMayPrize
0
20
25

Finally got around to writing up a tutorial for my new #rstats 3d network #Datavisualization & layout library: network3d. Uses #javascript to display and calculate layouts for large networks interactively. The only dependency is htmlwidgets. Try it out! https://t.co/PjKkwe84EO
1
48
133
Stumbled on this great monthly column on stats targeted at biologists. Looks good for teaching too! https://t.co/LmhgazAw86
#rstats
0
7
9
What are the key classic papers of science that grad students of many fields should read? To start off, how about: Hurlbert (1984) Pseudoreplication Hardin (1968) Tragedy of commons Chamberlin (1965) multiple working hypotheses
23
31
136
📉🎞 head-to-head, w/ code: "gganimate vs. plotly - Which is better at animation?" by @BManalyst
https://t.co/UIlCaNQfOD
#rstats #dataviz #tweenr
1
19
50

Upcoming webinar by @WestGrid / @ComputeCanada 🇨🇦 "3d Scientific visualization with Plotly & Python" Wed, 28 March https://t.co/o6t5hQFzwj
0
3
7
Want to improve your data viz skills? Check out this awesome series of one pagers on best practices to get effectively tell a story with your data https://t.co/9Mwbz5WjAM thanks for the awesome workshop @MKrzywinski
0
1
4

Good to realize / keep in mind during study design:
Be careful out there, folks: "Based on some reasonable assumptions regarding main effects and interactions, you need 16 times the sample size to estimate an interaction than to estimate a main effect"
1
1
1

Care your ink/data ratio, Do not abuse the rainbow! 🌈, and forget pies @TrevorABranch graphics workshop @SFUBiology @SFU_GradStudies @statsbeerz
0
2
6
Great discussion wit lots of interesting insights!

0
0
1