

R for Political Science
@stats_map
Followers
4K
Following
199
Media
27
Statuses
590
I post mainly about R packages and data sources for political science analysis.
Joined June 2020
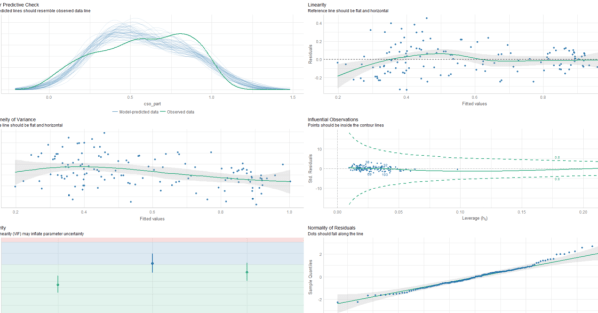
Check model assumptions with easystats package in #Rstats. Code: #econTwitter #phdchat #phdtwitter #datascience #Datavisualization.
rforpoliticalscience.com
Packages we will need: install.packages(“easystats”, repos = “ library(easystats) easystats::install_suggested() Easystats is a collection of R packages, which aims to provide a f…
0
30
176
RT @JoachimSchork: Creating publication-ready plots in R is easier than ever with ggpubr. This extension for ggplot2 simplifies the process….
0
61
0

Blazing-fast image creation – using just your voice. Try Grok Imagine.
284
557
3K
RT @JoachimSchork: The ggalign package in R brings flexibility to your visualizations by helping align multiple plots and incorporate compl….
0
59
0
RT @R_Graph_Gallery: It's now incredibly easy to build calendar heatmaps!. Thanks @joseph_barbier for your dayplot library!. Documentation:….
0
44
0
RT @JoachimSchork: Adding statistical metrics to your plots can transform your visualizations from basic to highly informative. With ggplot….
0
65
0

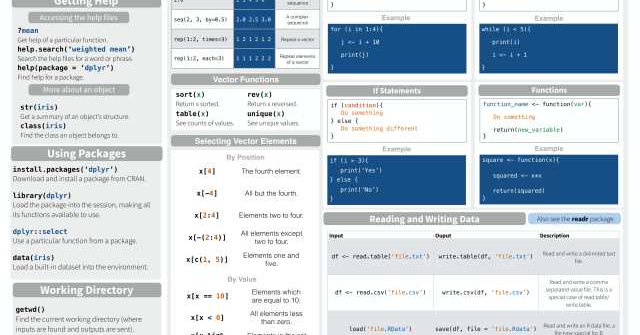
🚀 Working on collecting these awesome #rstats cheat sheets in one place!
rforpoliticalscience.com
Click to download Base R Page 1Download Click to download Base R Page 2Download Click to download Time Series Cheat SheetDownload Click to download Purr function cheatsheetDownload Click to downloa…
0
1
18
RT @stats_map: How to download and graph interactive country maps in #Rstats with the leaflet package #map.
rforpoliticalscience.com
Packages we will be using: library(tidyverse) library(geojsonio) library(sf) In this blog, we will make maps! Mapppsss!!! Go to this website and find the country GeoJSON you want to download: We ca…
0
9
0
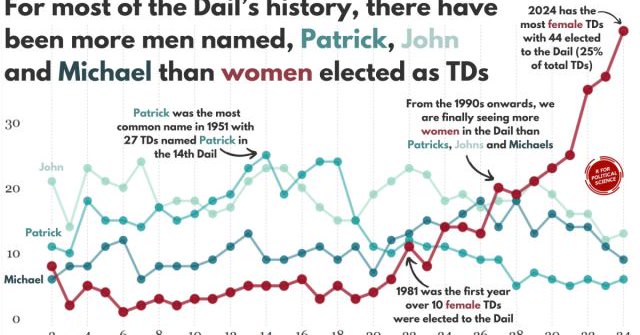
RT @stats_map: Examining women in the Irish Parliament PART 1: Scraping and cleaning data with the gender package.
rforpoliticalscience.com
Packages we will be using: library(gender) library(tidyverse) library(stringi) library(toOrdinal) library(rvest) library(janitor) library(magrittr) I heard a statistic a while ago that there are mo…
0
1
0
RT @R_Graph_Gallery: 😍 Just discovered the #dataviz work of Colas Droin. He's a researcher transitioning to data visualization, and just re….
0
19
0
RT @x2DBupXUKmtf4dc: Kenneth Waltz's approach to reading classic political theory and why it matters | International Theory | Cambridge Cor….
cambridge.org
Kenneth Waltz's approach to reading classic political theory and why it matters - Volume 14 Issue 2
0
3
0
RT @R_Graph_Gallery: 🍔 Stacking is dangerous in #dataviz. Is the green group increasing or decreasing? 🤔. It's so hard to tell (answer her….
0
3
0
Examining women in the Irish Parliament PART 1: Scraping and cleaning data with the gender package.
rforpoliticalscience.com
Packages we will be using: library(gender) library(tidyverse) library(stringi) library(toOrdinal) library(rvest) library(janitor) library(magrittr) I heard a statistic a while ago that there are mo…
0
1
7
RT @koryodynasty: President Yoon testified that he never ordered troops to drag out lawmakers from parliament. Now, his former defence min….
0
25
0
⭐How to scrape and graph #IrishElection results with #RStats from the web! 📊. Step-by-step how to find online data, clean it, and create semi-circle parliament graphs using ggparliament. 🎨.#DataVisualization.
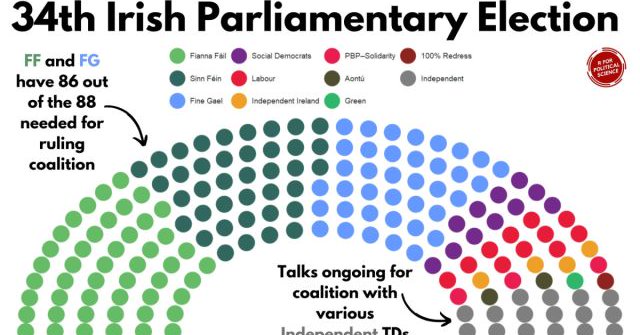
rforpoliticalscience.com
Packages we will use: library(tidyverse) library(rvest) library(janitor) library(magrittr) library(ggparliament) library(ggbump) library(bbplot) I am an Irish person living abroad. I did NOT follow…
0
0
8
RT @R_Graph_Gallery: 🎁 New tutorial on the R Graph Gallery!. A bump chart by @matschnetzer. The key to clarity in this #dataviz is highligh….
0
35
0
Regional Economic Communities on the African Continent PART ONE: Scraping datasset with rvest in #rvest .
rforpoliticalscience.com
Click here for part two on the REC dataset. Packages we will need: library(tidyverse) library(rvest) library(janitor) library(ggflags) library(countrycode) The Economic Community of West African St…
0
1
1
RT @JoachimSchork: Compare multiple statistical models effortlessly with ggstats, a versatile extension package for ggplot2 that simplifies….
0
50
0