terence
@researchremora
Followers
40K
Following
29K
Media
2K
Statuses
8K
smitten with #rstats · the #rayverse's number one fan
the rayverse
Joined November 2012

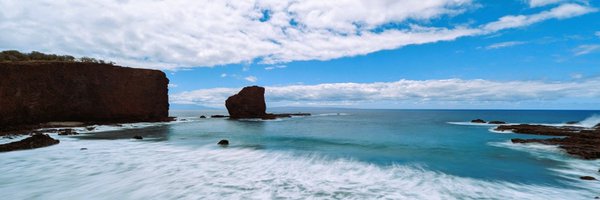
Day 6 of the #30DayMapChallenge - Dimensions. A thread of a few maps that cross into the three dimensional world. Here is a 3D representation of the topography and bathymetry around Gibralta.
2
29
166
0
3
35

💮 Collection de souvenirs #30DayMapChallenge - J4 : Mes données J’ai voulu mettre en carte qq souvenirs, et surtout le plus beau qui arrive dans quelques semaines 🍼 🌍 Projection LCC (France), projection Mercator (Taipei), réalisée avec QGIS et Illustrator 🕰️ 4h #map
3
5
42

Tree canopy height of Paris, France. Have given up on #30DayMapChallenge. #rayshader adventures, an #rstats tale
1
13
132

Global tropical-cyclone tracks, 1980 to Oct 2025. Experiement for #30DayMapChallenge - Day 2: Lines by year; brighter = more recent. Climate-risk adaptation, early warning, and resilient planning saves lives! Source: Data IBTrACS v4 (NOAA NCEI/WMO). Made in Blender
2
21
126

Hello/Hola/Olá - My South America Physical Map is now available. You can get it here (for free): https://t.co/QSvNCBxcUD
11
42
253
Day three of the #30DayMapChallenge - Polygons. This map shows the earths tectonic plates. I have overlayed all of the earthquakes with a magnitude greater than 4.0 over the last 20 years, coloured according to their magnitude (blue (smallest) - red (largest).
2
35
260

#30DayMapChallenge 🗺️, jour 3 : Polygones. Les préfectures de France 🇫🇷, représentation fière et massive du pouvoir central "dans les territoires". Hôtel classique du XIXe siècle, folie typique des années 1960, geste expérimental du XXIe siècle... Que de formes variées !
6
30
184

#30daymapchallenge day 2: points A joy / ridge plot of the City of London, made with QGIS, R, Adobe Illustrator & @EnvAgency data 🇬🇧
2
17
162
Forgot to share this extra one for #30DayMapChallenge · Day 2 · Lines last night. Population density ridgelines. #ggplot2 adventures, an #rstats tale
0
4
36
#30DayMapChallenge · Day 2 · Lines. Bathymetry of the Atlantic Ocean as illuminated contours. #rayshader adventures, an #rstats tale
2
9
81
Forest canopy height of Grand Teton National Park, Wyoming. #rayshader adventures, an #rstats tale
0
2
32
Tree height map of Montréal. See the blank space without any trees in the middle? If you aren't from Montréal, what do you think that is? :) #rayshader adventures, an #rstats tale
2
8
49
Debated whether I should participate this year—a crisis of confidence and purpose and all that—but here I am again. #30DayMapChallenge · Day 1 · Points: Threats to global shipping as measured by anti-shipping activity messages. #rayshader adventures, an #rstats tale
2
1
52


🗺️ Premier jour du #30DayMapChallenge - Point 🔴 Point par point, les violences contre les populations civiles Une carte (non exhaustive) des violences commises contre les civils, par des armées, des groupes armés rebelles, des terroristes, des membres de cartels (données HDX)
1
8
48

0
0
7