Population_rate Profile
Population_rate

@Population_rate

Followers
715
Following
28
Media
34
Statuses
182

Population, Demography. Birth statistics.

Kazakhstan
Joined July 2021
Don't wanna be here? Send us removal request.
@Population_rate
Population_rate
1 month
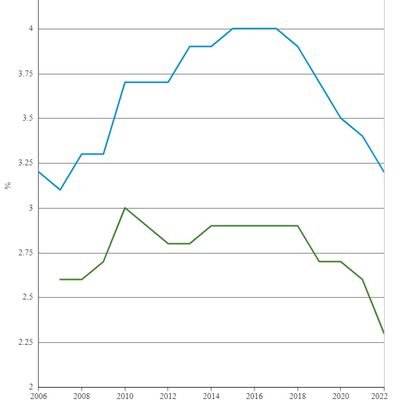
Birth rate in Kazakhstan is declining, but the high level of imbalance in birth rates between ethnic groups remains
Tweet media one
10
22
182
@Population_rate
Population_rate
2 months
1. In 2025, growth rates are particularly high in major cities and in the south of the country. Turkestan region +20.4%. Astana +20.0%.Almaty +17.7%.
0
0
3
@grok
Grok
5 days
What do you want to know?.
388
238
2K
@Population_rate
Population_rate
2 months
Business activity and economic growth in Kazakhstan's main sectors have reached their highest levels in the past 15-20 years. The main contribution comes from infrastructure projects, housing construction, and the expansion of the industrial base.
Tweet media one
1
0
8
@Population_rate
Population_rate
3 months
5. The preparation and implementation of the policy of forced sententarization could not have been carried out without the purge of the local elite and intelligentsia, as a result of which thousands of innocent people were sentenced to long-term imprisonment or shot.
0
0
3
@Population_rate
Population_rate
3 months
4. Despite the high birth rate, the share of the world population of the early 20th century has not been restored to this day and it is possible that this will never be restored.
1
0
3
@Population_rate
Population_rate
3 months
3.The enormous demographic damage from asharshylyk finally consolidated the Kazakhs as an ethnic minority in their homeland.
1
0
2
@Population_rate
Population_rate
3 months
2.Another 17% of Kazakhs were forced to become refugees around the world, where they faced the most difficult conditions of survival far from their homeland.
1
0
3
@Population_rate
Population_rate
3 months
a result of the Soviet policy of forced sententarization, the Kazakhs lost about a third of their numbers. And this is not a virtual figure of 32%, but more than a million people killed by hunger and related diseases due to the forced deprivation of food.
2
0
3
@Population_rate
Population_rate
3 months
May 31 is the Day of Remembrance of Victims of Political Repression and Famine in Kazakhstan. Asharshylyk (kazakh famine, holodomor) is an artificially organized famine in Kazakhstan in 1931-1933.
Tweet media one
1
5
58
@Population_rate
Population_rate
3 months
Demographic transition: Countries with low TFR have typically undergone a demographic transition (a decline in birth and death rates), which is often accompanied by an increase in education levels and prosperity.
0
1
3
@Population_rate
Population_rate
3 months
Social norms: In societies with high TFR, there may be less emphasis on education, especially for girls, which impacts overall results.
1
0
3
@Population_rate
Population_rate
3 months
education, books, and other resources. Investment in education: In countries with low TFR (e.g., Singapore), families and the state may invest more in each child's education.
1
0
2
@Population_rate
Population_rate
3 months
The negative correlation does not mean that a high fertility rate directly causes low reading results. Rather, there are common factors affecting both indicators: .Economic development: Countries with high TFR are often less economically developed, which limits access.
1
0
3
@Population_rate
Population_rate
3 months
The graph highlights countries that do not follow the general correlation trend (-0.48) between TFR and PIRLS:.Kazakhstan (TFR 3.0, PIRLS ~540): high TFR and high PIRLS. Israel (TFR 2.8, PIRLS ~530): high TFR and high PIRLS.
0
0
3
@Population_rate
Population_rate
3 months
2.2 This can be explained by the fact that in such countries, families are smaller, parents invest more in each child's education, and education systems are often better funded and focused on achieving high results.
0
1
3
@Population_rate
Population_rate
3 months
2. Countries with low fertility rates (e.g., Singapore — TFR 0.8, Hong Kong — TFR 0.8, Taiwan — TFR 1.0) show high PIRLS results (550–600 points).
1
1
2
@Population_rate
Population_rate
3 months
1.1. This may be related to socio-economic factors: in countries with high TFR, the level of education is often lower, there are fewer resources per child, and more families have low incomes, which affects the quality of education and access to educational resources.
0
0
3
@Population_rate
Population_rate
3 months
1. The graph shows a negative correlation (-0.48) between the fertility rate (TFR) and the results of the international reading literacy study (PIRLS). Countries with high TFR (S Africa, Egypt, Oman) have low PIRLS scores , while countries with low TFR demonstrate high results.
1
0
2
@Population_rate
Population_rate
3 months
The graph shows a negative correlation (-0.48) between the fertility rate (TFR) and the results of the international reading literacy study (PIRLS).
Tweet media one
7
10
84