

PolicyViz
@PolicyViz
Followers
3K
Following
2
Media
344
Statuses
605
Helping you do a better job processing, analyzing, sharing, and presenting your data. Active Twitter account: @jschwabish
Washington, DC
Joined February 2013
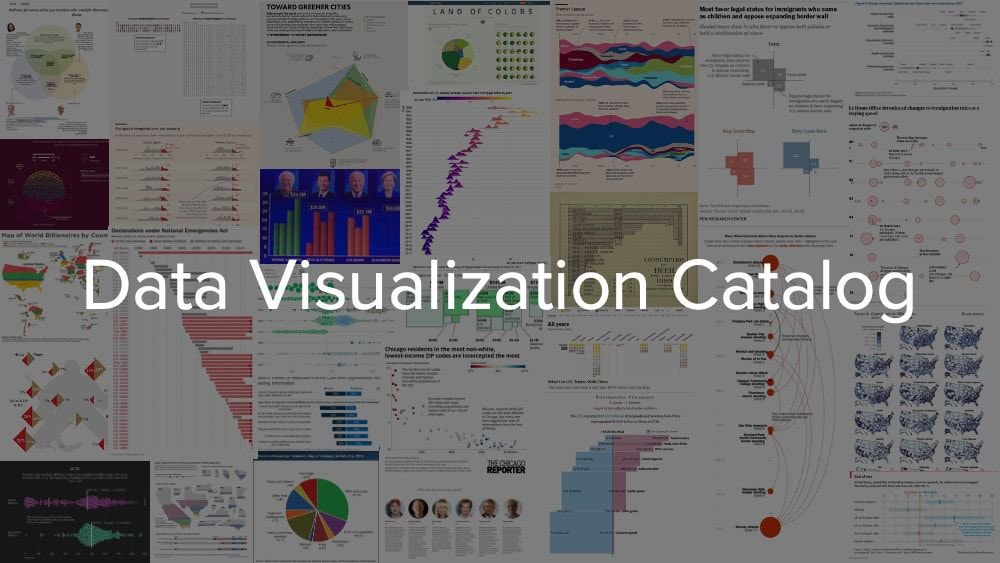
I have updated the @policyviz Data Visualization Catalog to >750MB and >1200 graphs, charts, and diagrams. Sort, filter, and explore, or download the whole thing in a zip file (all for free!). Explore it here: .Download it here:
2
7
28
Take an interesting approach to defining the data elements in your chart by using clever legends. |
0
2
5
I'm super duper excited to talk with my friend @ChristiansenJen on this week's episode of the @PolicyViz Podcast. We talk about her fabulous new book and ways to bring people together to create amazing data visualizations. |
0
0
2
Incredibly grateful to @SParsonsDataViz for his "Super Advanced Tableau Tables" dashboard and instructional video. In this blog post, you'll find my shorthand list of the steps for each @tableau visualization in Sam's tutorial. |
0
0
3
The @PolicyViz site will be down for a bit and here’s why.

So, in case you've been wondering what's going on with me and why you are seeing the following image on my PolicyViz website, I thought I'd tell you a little story. 🧵

0
0
0
Download more than 500 color palettes from @edithwyoung's book, Color Scheme, in CMYK, RGB, and HEX codes. Then, listen to the podcast episode!
0
2
1
I was curious, so I updated the famous NYT Yield Curve in @msexcel (using quarterly data). Here's how I did it and why--with a downloadable Excel file to boot! |
0
0
4
How do you get people to get away from the same old graphs time and time again? Maybe show them different alternatives! |
0
0
1
I built a color contrast checker in @msexcel. It's a multi-step process and enables you to do color accessibility checks for multiple color pairs quickly. See how I built it and download it for yourself. |
0
0
0
Some thoughts about creating data visualizations with outliers. |
0
0
0
Dual axis charts are confusing, hard to read, and can be easily manipulated to suggest correlations when none exist. Here are some things to consider. |
0
0
1
Back to school this week? Are you a K-12 teacher or instructor? Read this post and fill out the linked Google Form for your chance to win five FREE Match It data visualization card games! |
0
0
0
My @UWMadison (& @IRP_UW) mentor and friend Robert (Bob) Haveman passed away last week. Bob was a major influence in my life and I'll miss him. I've written a short memorial to him on my site. |
0
0
0
What are Senators Saying About the Uvalde, Texas School Shooting? A new analysis using Twitter data. |
0
0
1
Need even more hockey data? Here's a behind-the-scenes look at how I collected, analyzed, and visualized data on @NHL goalie height and weight (plus other stuff). |
0
0
1
🏒🏒I had a lot of fun with this post on @NHL data that looks at goalie height & weight during Wayne Gretzky's and @ovi8's careers. Hopefully, I did @JoeBpXp, @Laughlin18, @JunksRadio, & @granthpaulsen proud. |
0
0
0
Do data visualization awards separate the data from the design? New blog post on some reservations about #dataviz awards. |
0
0
0
What (free!) #dataviz blogs, newsletters, places to practice, examples, and tools do I use? Check out this annotated list. (with s/o to @AnnKEmery, @flowingdata, @pbump, @storywithdata, @_cingraham, and many more). |
0
4
6
Do you like to use diverging color palettes in your #dataviz? Make sure you're using them correctly and are labeling the midpoint. Some thoughts in a much too long post. |
0
1
1