Cai Lab
@LongCai_Lab
Followers
5K
Following
266
Media
27
Statuses
186
The Cai Lab at Caltech. We developed sequential FISH (seqFISH), seqFISH+, MEMOIR, and RNA SPOTs, apply them to study various biological questions.
Pasadena, CA
Joined October 2017
Our new preprint with S.Yoshida and B.Simons! Led by @ChakraArun, we leverage spatial information to resolve temporal dynamics in spermatogenesis! https://t.co/S5hhzqMi3g Also check out a complementary preprint by S.Y. and B.S using live imaging! https://t.co/rrbxyFYylk (1/10)
2
7
27

Using gene regulatory network inference we also identified a network of transcription factors with a cyclic topology and identify germ cell signals that interact with this network, illuminating how Sertoli cells can coordinate with germ-cell development. (9/10)
1
0
0
Among possible mechanisms underlying the cyclic transcriptional profile we identified an innate retinoic acid cycle. (8/10)
1
0
0
But are the Sertoli cells just frozen in time? By analyzing Sertoli cells near remnant elongated spermatids, we found their transcriptional profiles are independent of spermatids, suggesting they cycle even without differentiating germ cells. (7/10)
1
0
0
Using busulfan to ablate differentiating germ cells, we found that Sertoli cells maintain their cyclic transcriptional profile independent of germ cells. (6/10)
1
0
0
Our analysis also revealed new insights into blood-testis-barrier dynamics, identifying temporally coordinated expression of key polarity complexes that regulate barrier remodeling. (5/10)
1
0
0
Among somatic cell types, only Sertoli cells displayed synchronization with germ cell development. This synchronization proved remarkably precise and continuous throughout the cycle, expanding on lines of observations of stage-specific expression. (4/10)
1
0
0
At the tubule level, we observed a striking circular topology in PC space. We demonstrated that this cyclic transcriptional profile precisely matches the seminiferous epithelial cycle—the periodic pattern of germ cell development. (3/10)
1
0
0
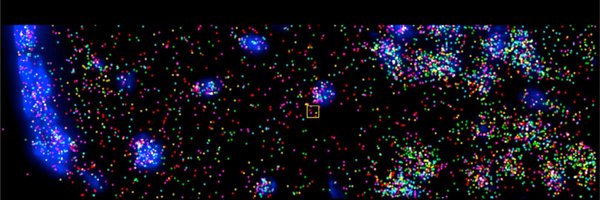
Using RNA seqFISH+, we imaged 2638 genes, encompassing TFs and signaling genes, across 216,090 cells in mouse testis while preserving their native architecture, capturing the different stages of the seminiferous epithelial cycle within each tubule cross-section. (2/10)
1
1
1
Just posted a preprint on our new spatial genomic recording system, baseMEMOIR. https://t.co/3j69c42dT0 Motivation: Cells divide, differentiate, and migrate to form exquisitely organized tissues. Reconstructing the dynamic histories of individual cells, including their lineage
4
159
675

Check out Giotto Suite — our latest tool for spatial multiomics analysis. This is a complete overhaul of the original Giotto package, a result from years of making. Great collaboration with @RnDries team. Kudos to @jiaji_g_chen @josschavezf1 and the entire Giotto team!

Our dedicated Giotto team, led by the amazing @jiaji_g_chen & @josschavezf1 from the @RnDries and @gc_yuan labs, created a modular suite of R packages that can represent and analyze virtually any dataset.
1
6
45
Spatial data needs to be taken into account to discover certain functionally distinct cellular states, as dimension reduction of gene expression data alone will not project on all functionally distinct cell types. We will have more examples of this in different systems.
1
0
1
This ME holds more CD4 T cells and Tregs. Thus, we believe our analysis captures early forming TLSs which have been hypothesized to contribute to disease progression in chronic kidney disease (CKD) and have been linked to worse prognosis in autoimmune disease.
1
0
0
Finally we found one ME - ME16 showed characteristics of Tertiary Lymphoid Structure (TLS). This ME holds mainly T cells, DCs and Macrophages, and has no specific cortical or medullary preference. Macrophages within this ME have a more M1 pro-inflammatory phenotype
1
0
1
Again, these MEs cut across different gene expression clusters and can be found only in the spatial-aware neighborhood analysis.
1
0
0
We find the other fibroblasts-containing MEs match gene expression from different time points after injury as measured in a time course data set from Kirita et al. 2020 and the @HumphreysLab, suggesting that different stages of injury occur in different parts of the kidney.
1
0
0
We propose a more robust process by first clustering gene expression to obtain 20-30 major cell types, and then use local neighborhood composition to generate MEs that serves as a proxy for function.
1
2
7
We have all had to tune parameters in clustering single cell data to have it “make sense” with respect to known biology.
1
0
1