
Jeff Allen @[email protected]
@JeffAllenMaps
Followers
454
Following
74
Media
26
Statuses
43
Cartographer | Urban Data Scientist | @UofTCities
Joined July 2022

Are low-income residents disproportionately moving away from transit? New paper by @JeffAllenMaps with @FarberSteven, Dan Silver, and I uses a panel dataset of tax filers (1988 to 2018) in Toronto and finds “Yes, but…”
1
25
60
In a new City Beats blog, @geo_uoft's @jasonhackworth9 & our Data Viz Lead @JeffAllenMaps examine the factors causing housing lots to be abandoned in American rust belt cities: deindustrialization, taxation & the pressures on Black-majority neighbourhoods:
schoolofcities.utoronto.ca
Jason Hackworth & Data Viz Lead Jeff Allen examine the factors causing housing lots to be abandoned in American rust belt cities: deindustrialization, taxation & the pressures on Black-majority...
1
5
7

map of immigration and transit accessibility in toronto and sydney (made this a couple years ago, looking at it again now for a tutorial on bivariate maps :)
0
15
65
Interested in mapping Canadian census data but not sure where to start? @JeffAllenMaps wrote a brief tutorial on understanding census data, where to download it, and making simple maps using CensusMapper and QGIS. Learn more at https://t.co/84di0LACt4
#Mapping #CensusData #Canada
0
9
16
stacked bar chart of number of rental units in apartment buildings in toronto by year of construction
6
36
131
quick map of knowledge of French in Ontario
1
4
21
side project from a few weeks ago --- a vintage-ish-style map of a slice of toronto
1
2
30
Curious to see where and how many secondary and backyard suites are in #Toronto? @JeffAllenMaps and @ajalmusa mapped permit data to track the uptake (or lack thereof) over the past 10 years. Check out our story here:
schoolofcities.github.io
Visualizing a decade (2013 to 2023) of Secondary Suite and Laneway / Garden Suite building permits in Toronto
0
9
6
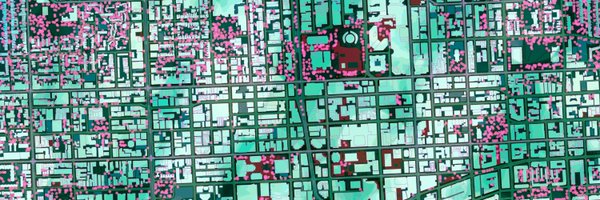
Interested in the past and present of #Toronto's landscape? Our Data Viz Lead @JeffAllenMaps has updated our web app for viewing and comparing historical aerial photographs with air photos from 1947 (sourced from @MDL_UofT). Check out more here: https://t.co/wDcROE7To0
0
5
14
Interested in Toronto history? @JeffAllenMaps made a simple website for viewing and comparing historical aerial photographs in #Toronto. Check it out here! https://t.co/wDcROE7To0
4
23
63
quickly mapped results of Toronto's 2022 mayoral election by ward
4
11
28
As a bonus, the School of Cities' Data Viz Lead (@JeffAllenMaps) created an interactive map of The #Scarborough Greenway Network. Explore: https://t.co/gm5foShlMG

A new report by School of Cities' faculty affiliate, @AndreBSorensen! 💡 Setting out a vision for a connected network in #Scarborough that reaches every corner of the #City. Read it here: https://t.co/ZK6hkjypAX
#bikeTO #walkTO
0
2
4
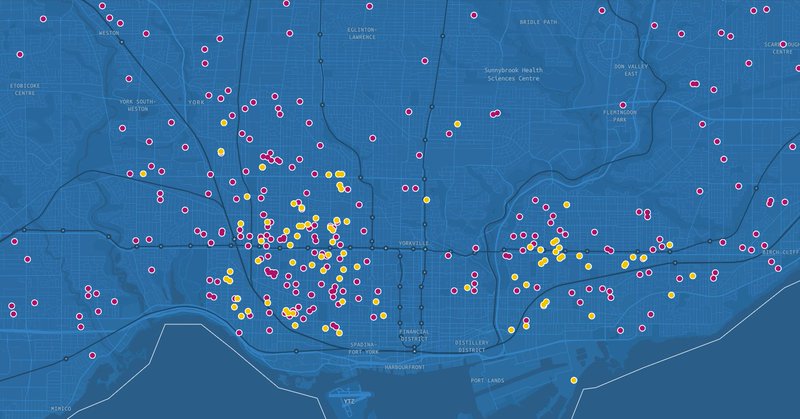
map of Senior Safety Zones in the City of Toronto (locations were sourced from the City’s vision zero mapping tool)
0
2
6