
Index
@IndexBI
Followers
792
Following
183
Media
33
Statuses
126
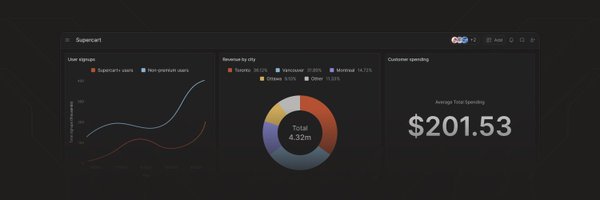
The modern workspace for business analytics. Crafted by hand ‒ powered by data.
Above a DB
Joined February 2021
Today we're excited to introduce Index — a modern tool for data analytics. We've been working hard to create something that's both powerful and delightful to use and today we get to share it with you!🧵
9
12
912

No pressure.


2
0
3
Something is brewing. ☕.
In the office working on the latest version of @IndexBI and it's unbelievable how powerful it is. Incredibly biased but it gives me the same feeling as the first time I got my @v0 project to work or @raycastapp AI chat to summarize a long YT video.

0
0
2
Were back with AI Engineer v3 🥳 You might really want to sign up for this one!! It will lock you in for the biggest update to Index to date! 👀.

Today we're launching the AI Engineer Pack Volume 3 — ready for our Worldwide Hackathon this weekend. Build and test your AI applications with @NotionHQ , @intercom , @MistralAI, @FAL, @huggingface and more. With new credits from @stackblitz, @ExaAILabs, and @DeepReel_AI and

0
0
3
Non-stop flights to Dataland™🫡.
9:51pm - last call of the day. Talked to a customer in the UAE 🇦🇪 that's building dashboards for his Italian 🇮🇹 and Serbian🇷🇸 customers using @IndexBI to make more $$$. Nothing beats seeing people using what you've built in the wild but this comes pretty close!.
0
0
1

Experimenting in public, let us know what you think!.


0
0
0
RT @xavierpladevall: @tableau @FlerlageKev The best tools don’t just automate, they empower users. We took that lesson to heart when buil….
0
1
0
We're on it🫡.
BI tool red flags you need to know 🚩. "You’ll get actionable insights." → You'll get 20+ charts no one on your team understands or knows how to act on. "It’s completely self-service." → Your analysts will still need SQL to make it work. "Everyone will get value from it." →.
0
0
3
RT @xavierpladevall: Data Questions might just be my favorite feature yet. Try it out yourself @IndexBI - connect your data and start aski….
0
2
0
Our most requested features are on the way:. 🚨 Alerts - Get notified instantly about key updates.📊 Embedded analytics - For easier sharing and accessibility. Both are coming this year! We're setting the bar high—especially for Alerts. The goal is to deliver a Zapier-style

0
0
5
👋 We are in the arena for data analytics & visualization.
Who’s building the next category winner in tech?. I’ve seen this pattern before—working at Facebook, I watched Slack, Figma, and Notion emerge and completely own their categories. They didn't just win, they made the competition irrelevant. But to do that, you need to build from

0
0
3
Our demo is now on YouTube! . Watch the full walkthrough of Index by our co-founder, @xavierpladevall through the link in the comments👇
1
0
4
RT @xavierpladevall: Shoutout to @elevenlabsio - our recent collab on the AI Engineer Pack brought 300+ new subscriptions (and counting!) t….
0
1
0
The easiest way to explore your data without writing SQL👇.
2. Add details and context . The more context you provide—timeframes, product categories, regions—the better your results. @IndexBI’s AI feature helps here. You can ask in plain English: “Which product in North America had the highest profit margin in Q3?” and get a clear answer.
0
0
4
Get ready for all the new features coming in 2025 👀 . 🚨 Set up recurring alerts for your team (coming soon!)
0
0
2