

Jeffrey Heer
@jeffrey_heer
Followers
12K
Following
4K
Media
38
Statuses
1K
UW Computer Science Professor. Data, visualization & interaction. he/him. @uwdata @uwdub @vega_vis ex-@trifacta
Seattle
Joined February 2011
Excited to share our #datavis notebook curriculum for learning visualization! Visual encoding, data transformation, interaction, maps, & more!. Into Python? Here's Altair + Jupyter: Prefer JavaScript? See Vega-Lite + @observablehq:

observablehq.com
A data visualization curriculum of interactive notebooks, using Vega-Lite.
13
475
2K
RT @uwdata: With DracoGPT, Will Wang shows how to extract and model visualization design preferences from generative AI systems — enabling….
idl.uw.edu
0
3
0
Congrats Dominik!.

Congratulations to IDL alum @domoritz for winning a VGTC Significant New Researcher award!! A premier honor for early career researchers in visualization!.
0
0
21
RT @edublancas: Mosaic is the future of data visualization. 10M cross-filtered rows with client-side processing. Powered by @duckdb https:….
0
12
0
RT @domoritz: I'm super happy that @_hex_tech donated VegaFusion to the Vega org to bring it together with Altair which is also now under t….
0
5
0
RT @michelle123lam: Frustrated with topic models? Wish emergent concepts were interpretable, steerable, and able to classify new data? Chec….
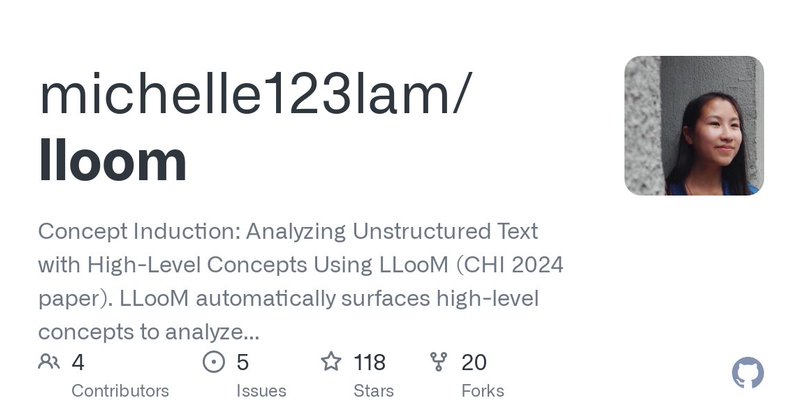
github.com
Concept Induction: Analyzing Unstructured Text with High-Level Concepts Using LLooM (CHI 2024 paper). LLooM automatically surfaces high-level concepts to analyze unstructured text. - michelle123lam...
0
12
0
RT @MadeleineGrunde: Chaining LLM calls can improve output quality, but navigating the massive space of task decompositions is challenging.….
0
12
0
Excited to analyze text at the level of *interpretable concepts*, addressing many weaknesses of topic models we’ve found in the past - and with more control & revision by analysts. Also a fun collaboration between @uwdata and @StanfordHCI, led by the impressive @michelle123lam!.

“Can we get a new text analysis tool?”.“No—we have Topic Model at home”. Topic Model at home: outputs vague keywords; needs constant parameter fiddling🫠. Is there a better way? We introduce LLooM, a concept induction tool to explore text data in terms of interpretable concepts🧵
2
4
27
RT @michelle123lam: “Can we get a new text analysis tool?”.“No—we have Topic Model at home”. Topic Model at home: outputs vague keywords; n….
0
39
0
RT @vega_vis: The Vega Project is happy to announce the release of version 5.3.0 of the Vega-Altair Python visualization library. This rele….
0
17
0
RT @domoritz: I've always been excited about the hybrid client/server execution model in @motherduck but seeing how well the WebAssembly cl….
0
15
0
RT @mbostock: If you’re excited about Observable Framework’s new SQL cells, wait till you see our Mosaic integration! The code:.---.sql:….
0
8
0
@duckdb . and you can easily deploy Mosaic-powered dashboards using Observable Framework:
I've had fun playing with @observablehq Framework to deploy dashboards and web apps. Here's an example site integrating @uwdata Mosaic and @DuckDB for scalable visualization:
0
1
18
I've had fun playing with @observablehq Framework to deploy dashboards and web apps. Here's an example site integrating @uwdata Mosaic and @DuckDB for scalable visualization:
3
22
116
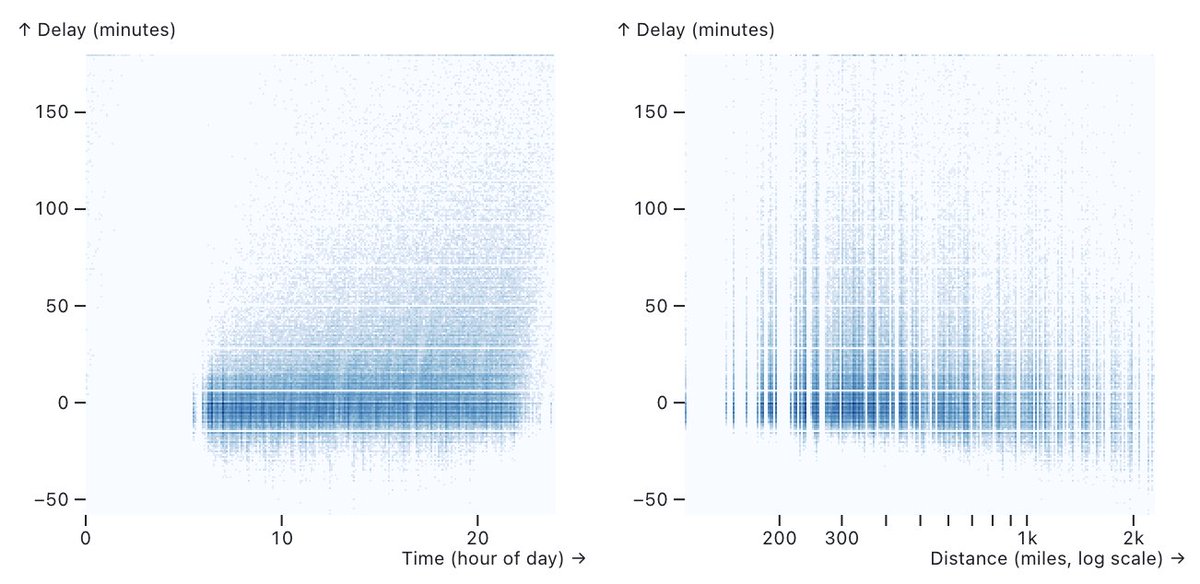
Mosaic uses @DuckDB - in-browser, on-server, or in a Jupyter kernel - and optimizes queries for fast, scalable visualization.
1
6
26
Interact with millions of data points in real-time with Mosaic, now with support for geospatial data. Exploring 1M taxi pickups and dropoffs in NYC:
6
41
348