Explore tweets tagged as #scatterplots

Whether you're into pie charts, scatterplots, or even custom plots, you can now build Custom Dashboards, tailoring your data views exactly how you want thanks to #FiftyOne 0.25!. 👉 Check it out here: . #ComputerVision #OpenSource #AI
0
0
2

Since people are talking weird PGS scatterplots, here's one I saw someone make a while back:. In a sample of Black and White Americans, the schizophrenia PGS is strongly related to African ancestry.

8
7
209

The description of this orientation X gender identity scatterplot among FTMs reminds me of one of Blanchard's scatterplots of androphilia X cross-gender fetishism. While the axes aren't directly comparable, the similarity is interesting.


0
0
3

- Scatterplots, Slope, and Data…OH MY!.- Although we still have so much to cover in 7th grade Accelerated Mathematics, my students are having a BLAST 💥.- My kiddos will be fully-equipped for Algebra I next year. @SuttonCougars @SuttonPTA @MerriweatherEDU @fhenderson1908


1
2
6

Visualize your strategy using heatmaps or scatterplots in tradingview platform. Coming soon.


0
0
1

1/🧶 Another preprint ! Ever wondered how we quickly interpret scatterplots and graphs? 🧠📊 Our new study with @StanDehaene reveals that our brains might recycle neural systems originally built for other purposes—just like reading and math!

2
14
36

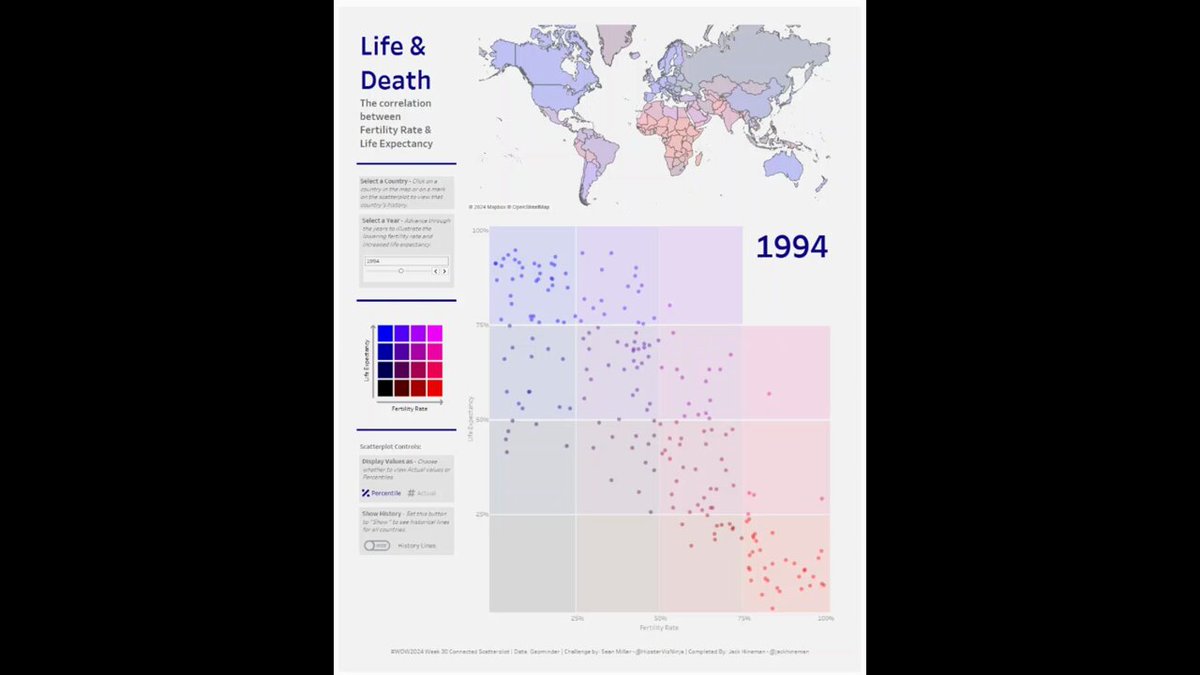
#WOW2024 Week 30 - Connected Scatterplots from @HipsterVizNinja. I deviated from Sean's original, but really loved this challenge.

0
0
23

“LAI from GEDI LiDAR got a serious upgrade: r = –0.55 → 0.81, RMSE = 3.94 → 1.43. DEM helped separate canopy vs. ground returns!”🌲 📸 Suggest: scatterplots with new vs. old correlation #ForestEcology #LiDAR #DEM #Geoscience #USA.🛰️Link:
0
3
17

Thanks to a request from @SinclairEuan we added a few new scatterplots to the Pairs tool in (Plus a zoom functionality in the charts)
1
3
42

Glad to contribute to #WOW2024 challenge on working with high density scatterplots in #PowerBI. As a bonus challenge, try the same thing in a notebook and publish it to Org Apps #MicrosoftFabric.

2
3
19

Might fuck around and zoom in on scatterplots with no context.

7
1
21

Need to explore relationships between variables while showing statistical insights? The ggscatterstats() function from the ggstatsplot package is your go-to tool. It combines scatterplots with marginal distributions, giving a comprehensive view of your data along with key

0
43
253

Wind Wednesday 🪁. New: Temperature & Windspeed histograms; all histograms aligned with scatterplots to make relationships easier to see.

0
1
5

M8 Ss @FJHChargers spent today investigating lines of best fit. What does it do? How useful is it? Which scatterplots would the line of best fit be more helpful for? @desmosclassroom brought the lesson to life and added a little friendly competition to check their mastery
0
4
11

Auf @abseitsat könnt ihr jetzt mit dem neuen Scouting-Tool innerhalb von wenigen Sekunden Scatterplots erstellen - für unzählige Ligen mit verschiedenen Metriken. Kein PowerBi oder Tableau notwendig. Ich hab mich aber kurz erschrocken, weil ich Salah zunächst nicht gefunden habe.

0
1
13

For the curious on SOXX & NVDA (2nd chart) daily return scatterplots. Broadness of the selloff is IMO more notable than NVDA action.


0
0
5

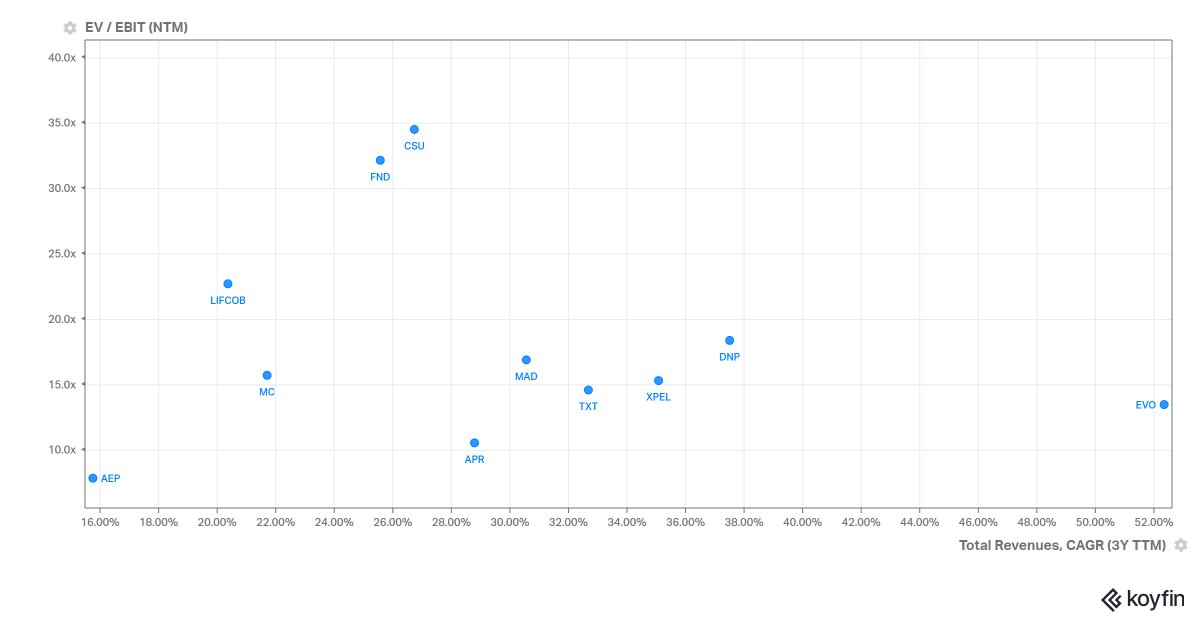
Loving this functionality from @KoyfinCharts to build tracking tools for the Portfolio / Watchlist. Can build out great Scatterplots and Graph Summaries to find outlier valuation multiples within my process!. $FND $CSU $EVO $LIFCO.B $XPEL $DNP.WA
4
2
17

It's like a new Anscombe's quartet: 3 scatterplots that have the same results from principal components analysis. From

0
10
34

I greatly enjoyed @o_withington's speech at GDC2025 on visualizing output of generative systems. I was inspired to vibe code some scatterplots and heat maps for Fluctlight while I was sitting in the audience. 😅

6
3
20