Explore tweets tagged as #plotly

Why python is insane for algorithmic trading:. 1. Visualization: Plotly ($0).2. Data analysis: Pandas ($0).3. Market Data: OpenBB ($0).4. Technical indicators: TA-lib ($0).5. Machine Learning: Scikit Learn ($0). Total cost: $0

9
78
685


Top Python packages every Data Scientist should know:. Data Manipulation:.•Pandas.•NumPy. Data Modeling:.•Statsmodels.•Scikit-Learn. Data Visualization:.•Plotly.•Bokeh. #Python #DataScience #MachineLearning #AI #Coding #100DaysOfCode

0
0
5

اليوم أنهيت ولله الحمد الدورة الثامنة من شهادة IBM Data Science. كانت عن الData Visualization بإستخدام Matplotlib و Seaborn ثم إستخدام مكتبات متطورة أكثر مثل Plotly و Folium وحتى إستضافتها كموقع بDash. متبقي إن شاء الله دورة ومشروعين فقط , من Data Analyst إلى Data Scientist.


7
18
511

Want to go beyond static charts in Python?. Plotly lets you build interactive, browser-based visualizations. Perfect for dashboards, reports, or exploring large datasets. Gain hands-on experience with a real-world project. Start now 🔗
0
1
6

"Always use plotly", thats one of the key prompts for our setup from now on. It handles so many things out of the box, that are needed for any data visualization (filtering, pan, zoom, image downloads etc). Shout out to my previous employer, they are experts in data vis.
0
0
5

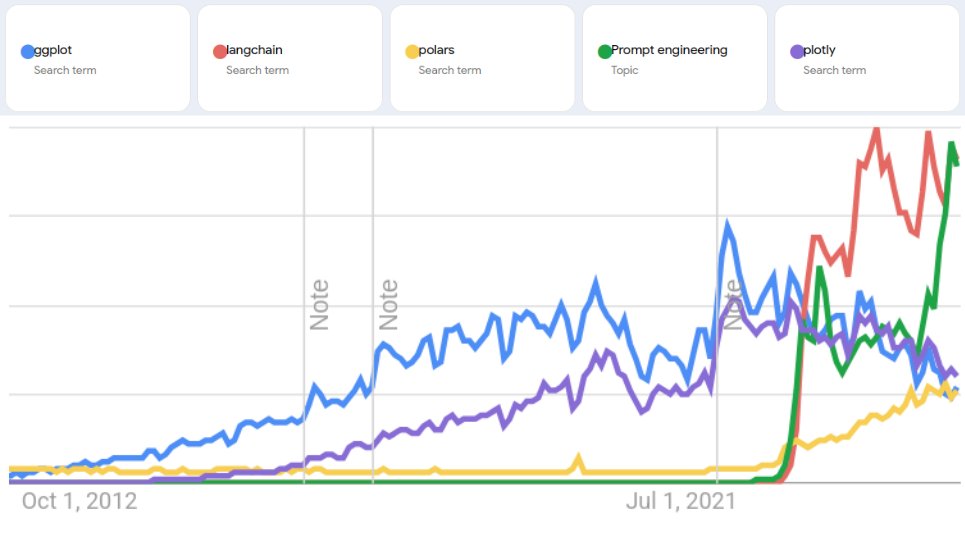
is it a coincidence that as prompt engineering and langchain spike, plotly and ggplot starts declining?
1
0
1

Matplotlib and plotly stand out as two of the most popular data visualization libraries in Python. Each offers unique features and advantages, catering to different needs and preferences. Let's delve into what makes each of them special and help you decide which one suits your

1
6
50

We finished up an amazing week at #SciPy2025! This was Plotly's Martha Cryan's third time at SciPy, and she loved seeing so many familiar faces and spending time with this amazing community. Check out some of her highlights! . 🎤 Keynotes & Talks.• Kathryn Huff reminded


0
0
1

🚀 Curso gratuito: Ciência de Dados. Você vai explorar todo o ciclo de análise: da coleta à visualização, usando SQL, Python, Pandas e Plotly com dados do governo. 🔗 Link: #studytech #cursosgratuitos #bolhadev.
0
20
272

【2024年最新版:Pythonデータ解析ライブラリ】.以下の優秀な最新データ分析ライブラリを知っていますか?. ・Polars.・Vaex.・Plotly Express.・Altair.・PyCaret.・SHAP. どんどん便利なライブラリが開発されていますね。.今後のトレンドにも注目です!

0
3
14

Introducing Babbl, a Python library that turns your Markdown files into beautiful .html. - Easily render functions and classes live from the codebase.- Embed .html (e.g. interactive plotly graphs).- The .md files live inside your git repository and are version controlled.-
1
0
4

بعد ثريد عمالقة تحليل البيانات! (Pandas vs Numpy).االيوم بيكون الثريد عن عمالقة تصور البيانات (Data visualization) .Matplotlib vs Seaborn vs Plotly.سنتعرف على مميزات كل منها ومتى نستخدمها. #علم_البيانات #بايثون #تحليل_البيانات

عمالقة تحليل البيانات! (Pandas vs Numpy). كعلماء ومحللي بيانات، غالبًا ما نجد أنفسنا نختار بينهما. بعطيكم ملخص الفروقات الرئيسية لمساعدتك في اتخاذ القرار الصحيح لمشروعك!

1
17
196

I'm sad to announce that plotly's `fig.add_annotation` is such a pain in the ass that even AI can't cope with it!!. Updating x and y position doesn't work. Using xshift and yshift doesn't work. I'm just stuck with a silly looking annotations in the wrong place!

0
0
1
New Dash Component Alert! 🛠️✨. Looking to add calendar-style timelines to your Dash apps? Check out 𝗱𝗮𝘀𝗵-𝗰𝗮𝗹𝗲𝗻𝗱𝗮𝗿-𝘁𝗶𝗺𝗲𝗹𝗶𝗻𝗲, a community-built component for visualizing and interacting with scheduled events. It’s perfect for project planning, resource

0
0
5


四大少年誌のデータを活用した無料データ可視化学習サイト✨. 📚 四大少年誌47年分データ.👁️ Plotlyでインタラクティブ可視化.👩🎓 Docker + Jupyter Labで環境構築. データ可視化学習では「興味」が鍵となり、マンガという身近な題材で分析基礎が学べます!. #データ分析


0
1
4


