Explore tweets tagged as #VisualizingData

Play your #charts right: #VisualizingData.by @activewizards. #BigData #ArtificialIntelligence #ML #DataScience #Analytics #Tech #Technology #Data #DataAnalytics #Analysis #Infographic #DataScientist #IT. Cc: @kirkdborne @rick345 @davemcclure

1
12
20

(Open Access) Geographic Data Science with R: Look for "Read and Download Links" section to download. Follow/Connect me if you like this post. #GeographicData #DataScience #VisualizingData #GeographicAnalysis #SpatialAnalysis #SpatialData

0
0
0
(Open Access) Geocomputation with R: Look for "Read and Download Links" section to download. Follow/Connect me if you like this post. #Geocomputation #GeographicData #DataScience #VisualizingData #GeographicAnalysis #SpatialAnalysis #SpatialData

0
0
0
R Graphics Cookbook: Practical Recipes for Visualizing Data - Provides more than 150 recipes to help professionalss generate high-quality graphs quickly. #rprogramming #DataVisualization #VisualizingData #dataanalysts #DataScience #MachineLearning

0
0
0

some great part 2s (on #visualizingdata and not destroying the world w/ #smartcontracts) by @gaurav_bio and facebook's Omer Goldberg on the homepage today

1
0
1

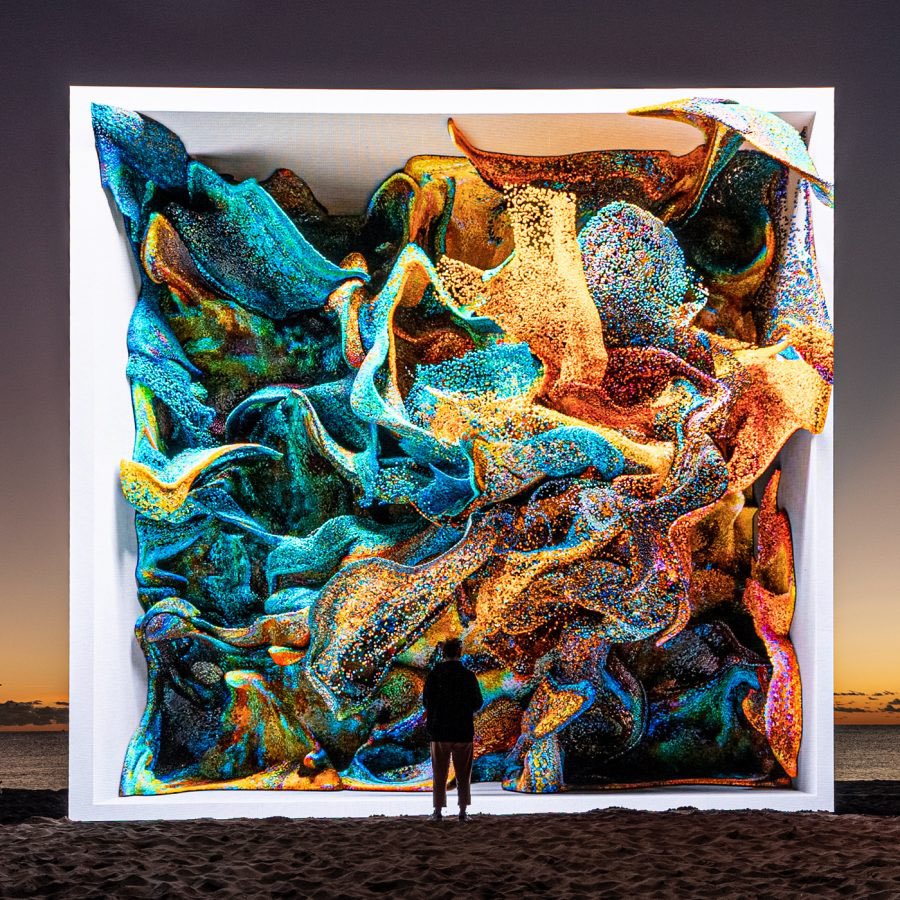
Refik Anadol: Blurring the Boundaries of Art, Data, and AI.@refikanadol #DataArt #AIinArt #DigitalInstallations #MachineLearningArt #ArtTechFusion #QuantumArt #VisualizingData #FutureOfArt #TechEthicsInArt
1
3
32

How to Choose Charts For Your Data. Source: @Python_Dv. #BigData #Analytics #DataScience #AI #MachineLearning #IoT #IIoT #Python #deeplearning #artificialintelligence #DataStorytelling #ML #data #dataanalytics #BusinessIntelligence #DataVisualization #DataViz #VisualizingData

0
1
1

Play your #charts right: #VisualizingData.by activewizards. #BigData #ArtificialIntelligence #ML #DataScience #Analytics #Tech #Technology #Data #DataAnalytics #Analysis #Infographic #DataScientist #IT. Cc: kirkdborne rick345 davemcclure #digitaltransfor….
0
0
0


0
0
0

Pass Analyzing and Visualizing Data with Power BI Exam on First Try Using @CertMagic Study Material. Visit @https://www.certmagic.com/exam/70-778-exams ✔️.#Microsoft #VisualizingData #Analyzing. #Dumps #Learningmaterial #Practicetets #PDF #Professionals #Skills

0
1
0


RT Ronald_vanLoon "Play your #charts right: #VisualizingData.by activewizards. #BigData #ArtificialIntelligence #ML #DataScience #Analytics #Tech #Technology #Data #DataAnalytics #Analysis #Infographic #DataScientist #IT. Cc: kirkdborne rick345 davem… .
0
0
0

Transforming raw data into compelling narratives with the power of Python and Bokeh. 📊💡 Excited to share my latest data visualization project. Dive into the beauty of data storytelling! #DataVizMagic #PythonProject #BokehBrilliance #InsightsInColor #VisualizingData #CodeInColor


0
0
1

Whether you're planning a project, researching a topic, or just curious about your community, the Redwood City Open Data Portal makes it easy to dive into how Redwood City works. Check it out at . #ExploreDiscoverLearn #VisualizingData #DataInAction.
0
0
1

Current distraction/focus on illustrating research.📝. 🌈Both exploratory, in process, and explanatory visuals. Current obsession is the brilliant @MonaChalabi 🦚. Wondering who else to follow? #visualizingdata #datajournalism #visualthinking

1
0
5

Unlocking the Power of Data Visualization: Key Insights for Business Growth.#DataVisualization #BusinessGrowth #ActionableInsights #DataReports #RevenueAnalysis #Budgeting #DecisionMaking #VisualizingData #BusinessGoals #DataDriven
0
0
3

Top 10 Python Packages Most Downloaded by Developers.#Top10 #PythonPackages #Python #ML #VisualizingData #AI #AINews #AnalyticsInsight #AnalyticsInsightMagazine

0
0
1
Best Statistics Courses. Source:@tut_ml .#dataengineer #datastructure #BusinessIntelligence #DataVisualization #DataViz #VisualizingData #BigData #Analytics #DataScience #AI #MachineLearning #IoT #IIoT #Python #deeplearning #artificialintelligence #ml

0
0
1
Commonly used Tools In Data Visualisation.Source:@Python_Dv.#BigData #DataScience #AI #MachineLearning #IoT #Python #deeplearning #artificialintelligence #DataScientist #dataanalytics #datamanagement #datamining #BusinessIntelligence #DataVisualization #DataViz #VisualizingData

0
1
1