
GannTrader
@gann_trader
Followers
7,709
Following
87
Media
421
Statuses
966
Optuma's new generation of #Gann -based trading software with advanced #astrofinance tools. Formerly known as Market Analyst.
Australia
Joined October 2016
Don't wanna be here?
Send us removal request.
Explore trending content on Musk Viewer
Claudia Sheinbaum
• 567752 Tweets
Fauci
• 397924 Tweets
River
• 130693 Tweets
चुनाव आयोग
• 121802 Tweets
#FixTF2
• 120573 Tweets
Farage
• 117916 Tweets
Venom
• 101847 Tweets
Monica
• 67507 Tweets
Jadue
• 65851 Tweets
Enzo Maresca
• 61434 Tweets
#すとぷり8周年
• 57505 Tweets
First Take
• 53857 Tweets
Bolivar
• 36059 Tweets
Botafogo
• 33783 Tweets
Clacton
• 27629 Tweets
Barriga
• 26138 Tweets
Reform UK
• 25785 Tweets
Başın
• 25218 Tweets
The Strongest
• 23481 Tweets
Colo Colo
• 23118 Tweets
Justin Jefferson
• 22968 Tweets
Stephen A
• 21848 Tweets
ヴェノム
• 21226 Tweets
Talleres
• 18264 Tweets
SHORT N
• 17446 Tweets
Berkshire Hathaway
• 17083 Tweets
산소호흡기
• 16757 Tweets
Djokovic
• 16404 Tweets
Larry Allen
• 14072 Tweets
gracie
• 13240 Tweets
NYSE
• 12852 Tweets
ISABELLE MEDALHA RUY ARAUJO
• 11771 Tweets
RESPIRATOR OUT NOW
• 11198 Tweets
Real ID
• 11185 Tweets
Sri Lanka
• 10979 Tweets
Ducati
• 10654 Tweets


Pinned Tweet

If you are interested in registering for a free trial of our advanced
#Gann
and
#astrofinance
software you can request a demo here:
13
10
56
The dynamic
#Gann
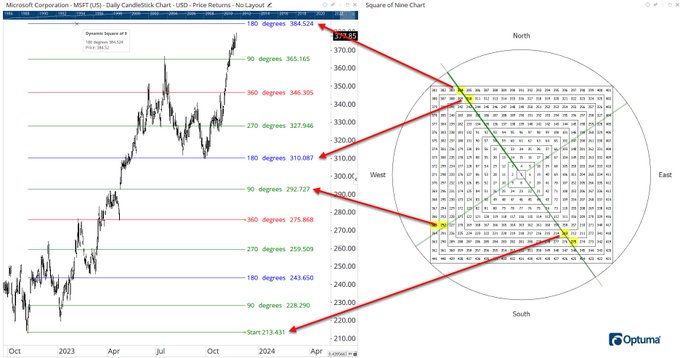
Square of 9 tool draws potential support / resistance levels based on the wheel's square root calculator. $MSFT example starting at low of $213.43:
1
12
65
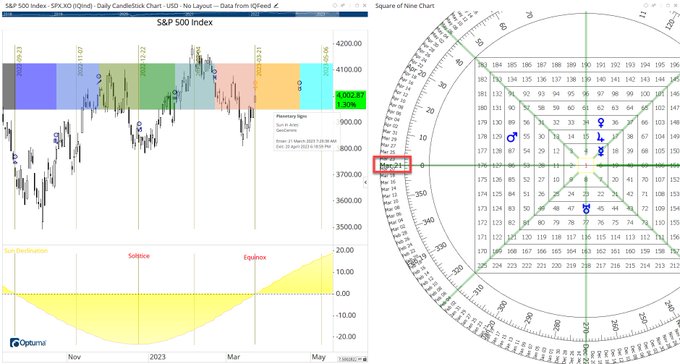
Today is minor
#Gann
Seasonal date - half way between the March equinox and June's solstice. This can be seen at the semi-square on the Square of 9 wheel (planetary longitudes are also shown on the wheel - Uranus is currently at 45°).

5
3
42
From today until the end of the year Mercury, Jupiter, & Uranus are all in retrograde motion:

1
3
31
We have access to solar data from 1800s (via Solar Influences Data Analysis Center). Here's today's spike:


Today, Earth-orbiting satellites detected the biggest solar flare in more than 3 years.
Major Solar Flare:
In time with the
#LunarEclipse
Watch weather patterns. Fires, floods, hurricanes, earthquakes, electrical storms and power outages....

6
27
112
4
7
30
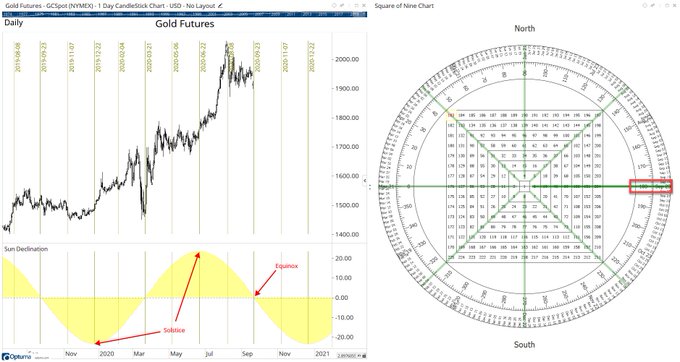
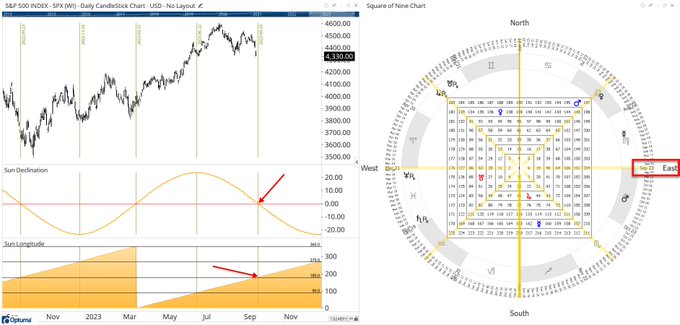
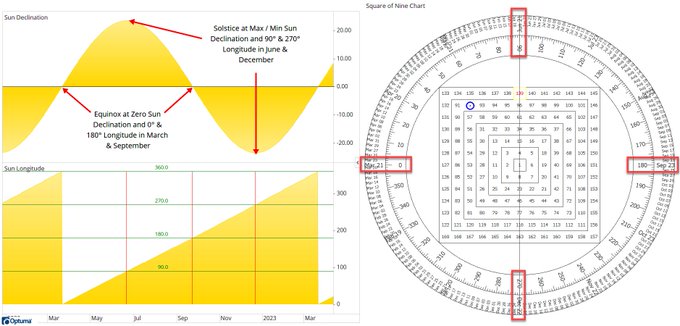
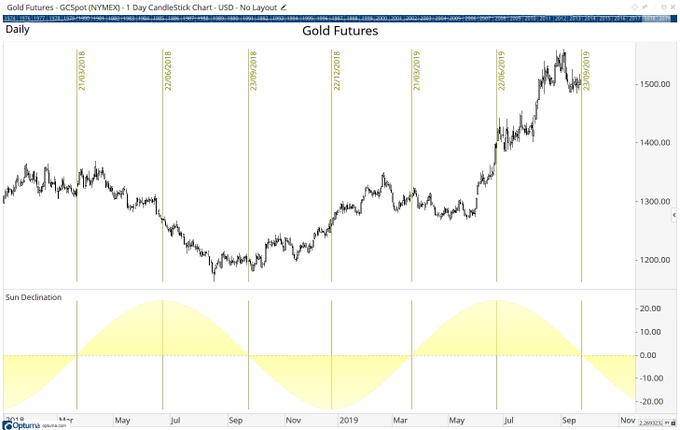
September 23rd is the equinox - an important
#Gann
seasonal date as seen on the Wheel of 9. This is when the sun's declination is 0 and longitude is 0° or 180°

0
10
28
There hasn't been a planet in
#retrograde
since the end of January, but that changes with
#Mercury
today! Next is Pluto followed by Saturn. By the end of Aug six planets are in retro motion:

3
5
27
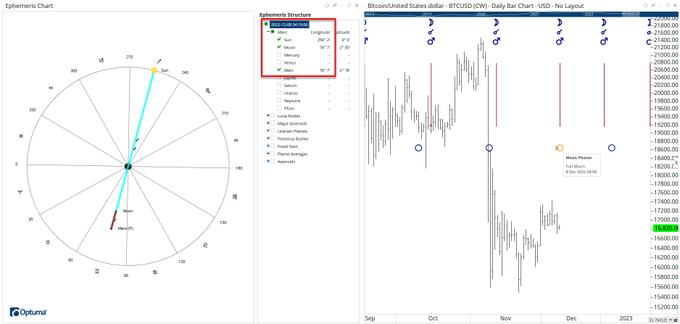
The 2 previous times Venus was conjunct Uranus was not great for $BTC... easy to plot with our Planetary Aspects tool
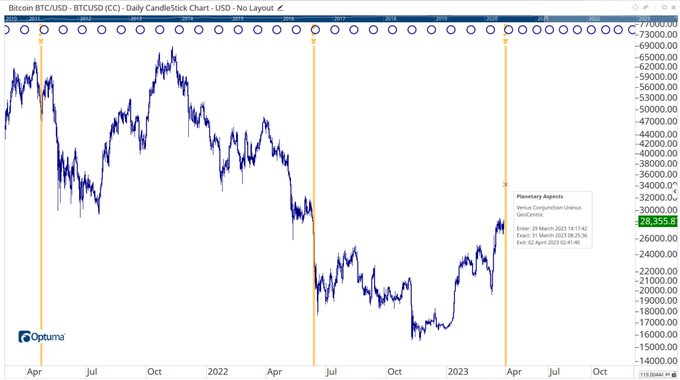

Geocosmics to watch today and tomorrow: Venus/Uranus conjunction today and lunar sign tomorrow are both reversal signals going into Mon-Tues next week. Could be sharp but fast corrective pullback in stocks and BTC. If not, it is just another sign that this is a new young bull.
1
9
49
0
5
27
Gann Sqr from 2017 Top. Pi Factor on Time. End of Squares is always interesting. $BTC

2
2
22
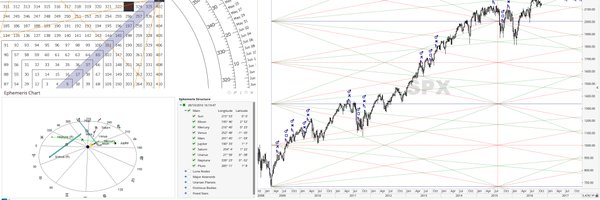
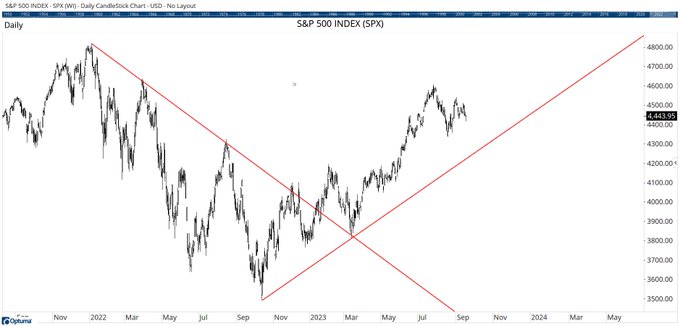
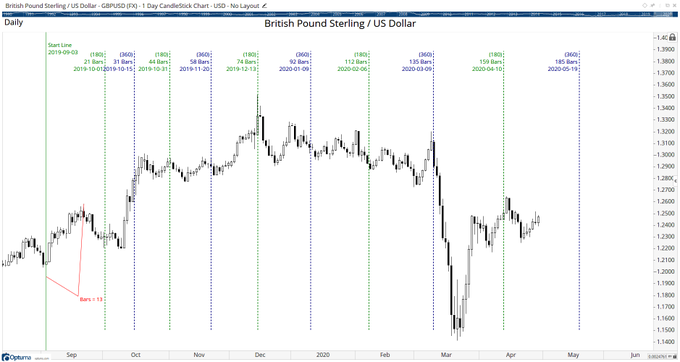
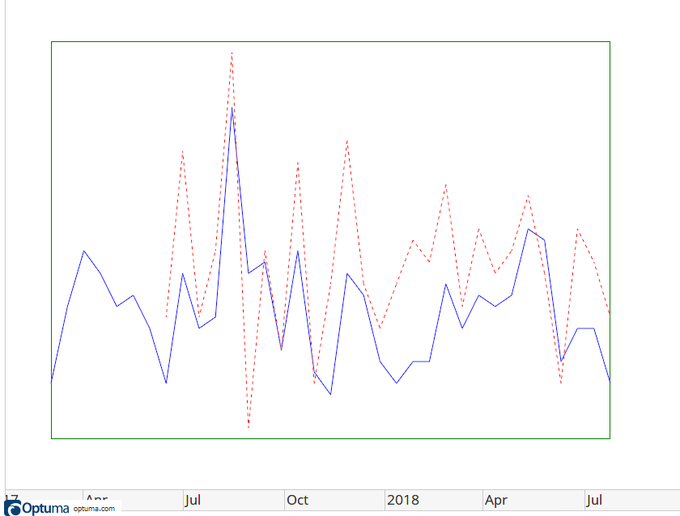
Update on the $SPX Jenkins True Trend Lines (automatically drawn on the chart based on
#Gann
Square of 9 time & price calculations):
The Jenkins True Trend Line is one of the proprietary tools by Michael Jenkins in our add-on module. It's based on
#Gann
's Square of 9 to automatically draw the line automatically from a major high or low, as in this example of $SPX:
0
1
18
1
3
20
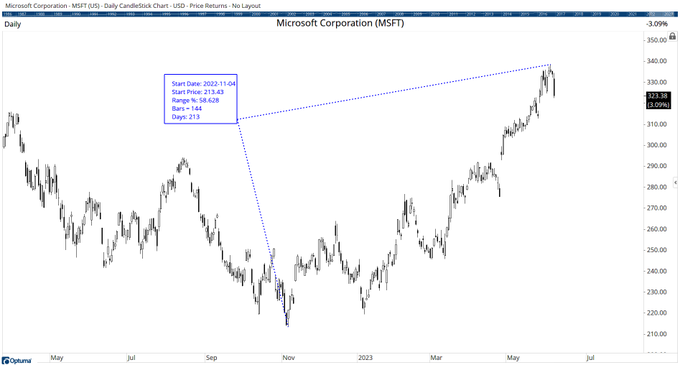
Monday's high in $MSFT was 213 calendar days (144 trading days... one of
#Gann
's favourite time counts) from the low of $213.
1
3
20
This week sees the midpoint of Uranus
#retrograde
motion. Simple script to show on a chart based on planetary speed:

2
1
20
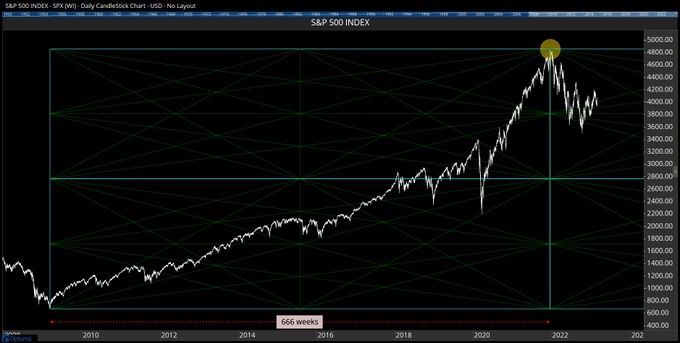
Today was the 14th anniversary of the 666 low in $SPX. This
#Gann
Square set to 666 weeks from that low with a Price Factor of 𝝅 marked the Dec 2021 high:
5
4
20
The
#Gann
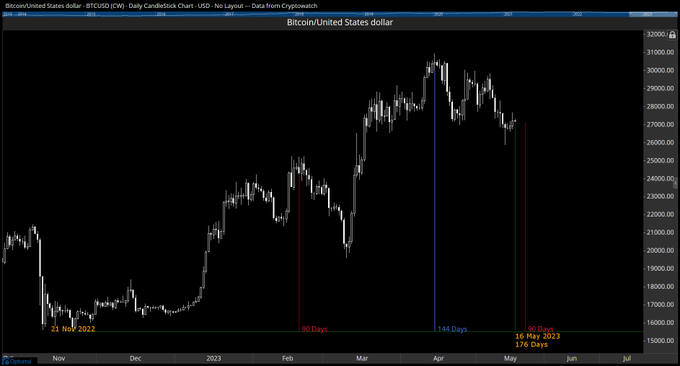
Day Count tool has been designed to count calendar days / bars / weeks / planetary degrees from a user-defined point. Here's $BTCUSD from the Nov 21st low showing every 90 day & 144 day count. Currently at 176 days:
1
4
20
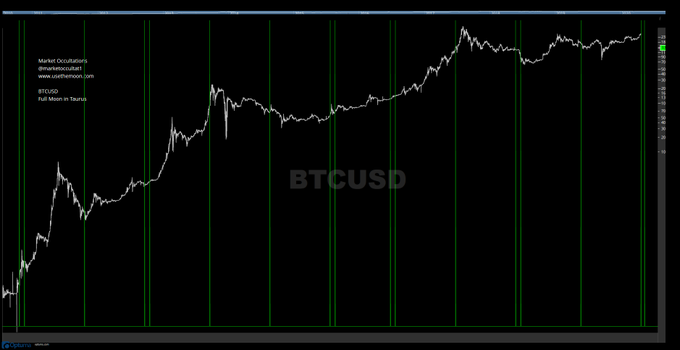
Today is the 23rd time that the
#moon
has been in Taurus for a
#LunarEclipse
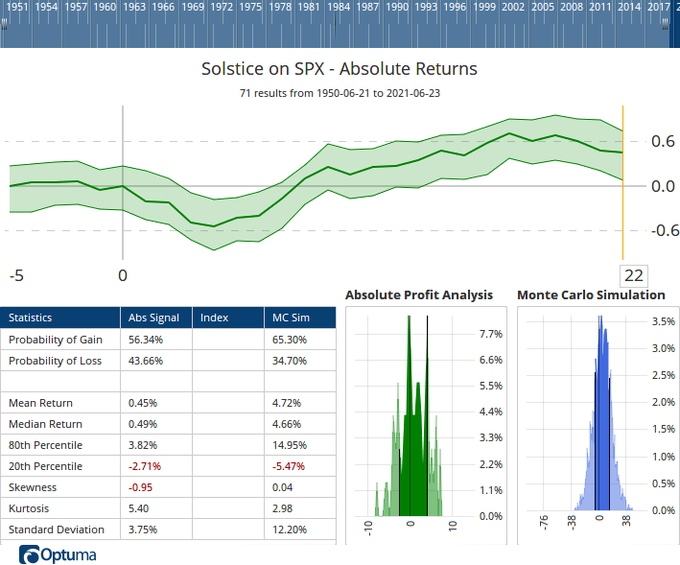
. In the previous 22 occasions the $SPX was on average up on the day, but down 0.57% 5 days after. Easy to script and test in
@Optuma
:

3
2
18
Mercury turns direct today - no other planet will be in
#retrograde
motion until Pluto at end of April. Clients can download retrograde workbook here:

1
2
18
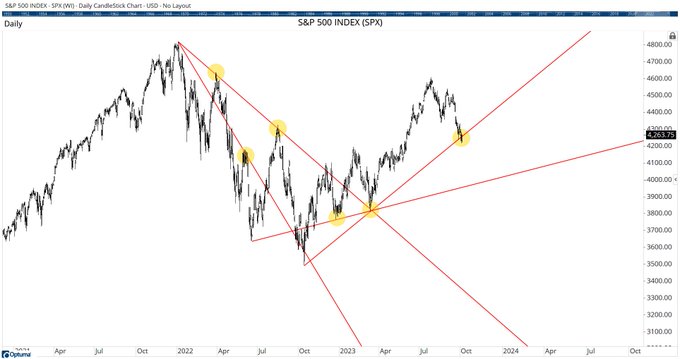
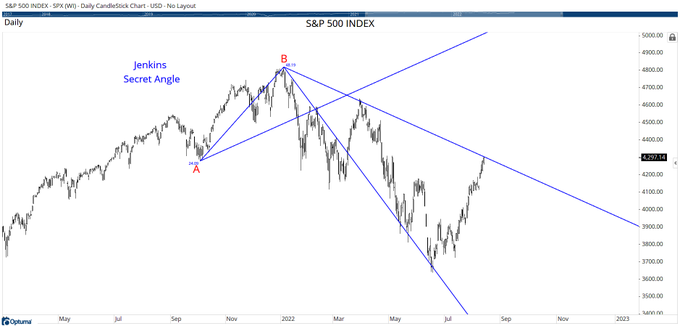
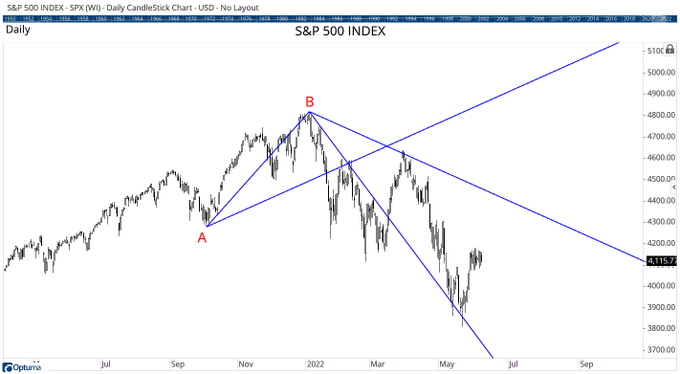
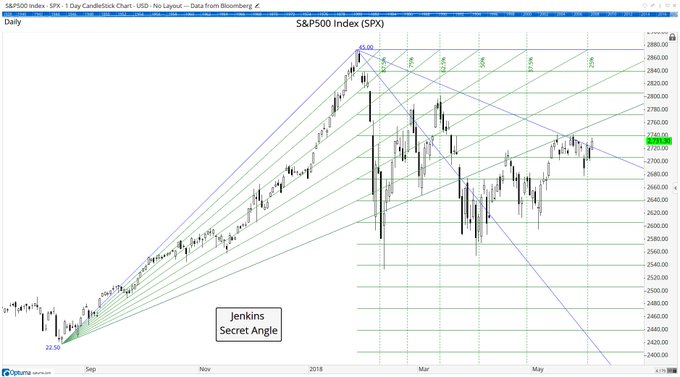
Students of Michael Jenkins may be familiar with his Secret Angle method. Here's a chart of $SPX showing the angles calculated from the move from A to B. This is one of 9 tools we have available in the Jenkins module:
1
3
18
Using geometry in your analysis? Use the Time/Price ratio setting to lock the scaling on your chart:

3
4
19
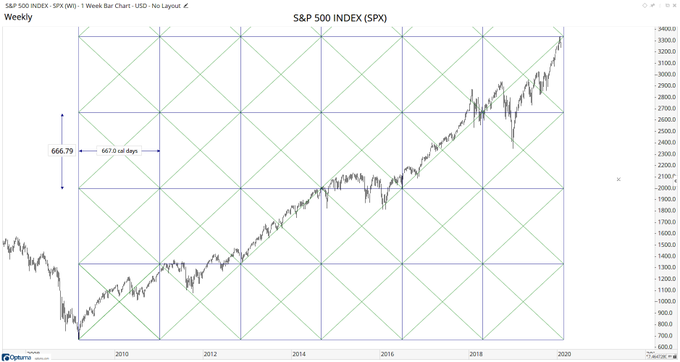
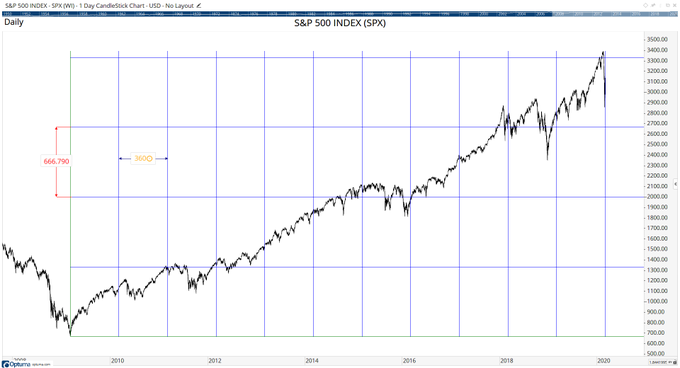
The
#Gann
Square Top/Bottom tool calculates the squares using the value of where it is applied to the chart. Here's the $SPX low of 666.79 currently squaring out (6 x 667 calendar days and 4 x 667 points from that low).
1
4
19
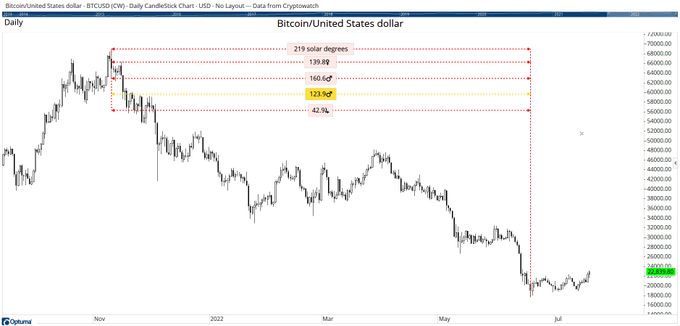
Did you know you can measure any time period by planetary degrees to help find cycles? Here's the distance between the high & low of $BTCUSD for various planets eg Mars travelled 160.6° from geocentric view, or 123.9° (close to trine) heliocentric.
#Gann
#astrofinance
3
0
19
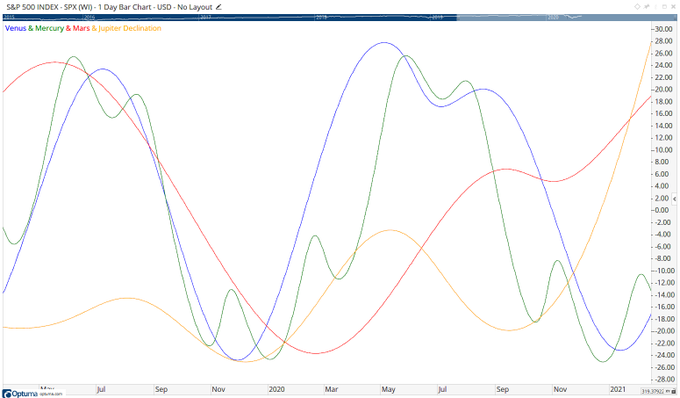
This Sun/Earth Opposition
#Gann
Planetary Line has provided important support / resistance for $SPX since 2016, incl previous ATHs:
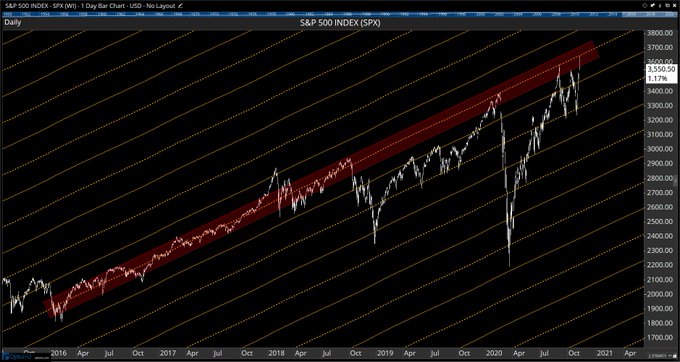

S&P500 INDEX Daily 3rd top on same Gann Planetary Line, 180° Harmonic Sun/Earth, the swan song is arrived.

1
0
5
1
4
16
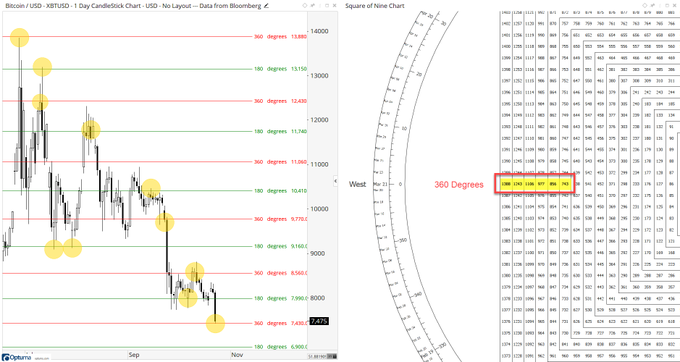
Using a price unit of 10 with the
#Gann
Square of 9 tool, Bitcoin $BTCUSD $XBTUSD often finds support / resistance at 180° and 360° eg today's low of 7430 and June's high of 13880:
2
7
17
The
#Gann
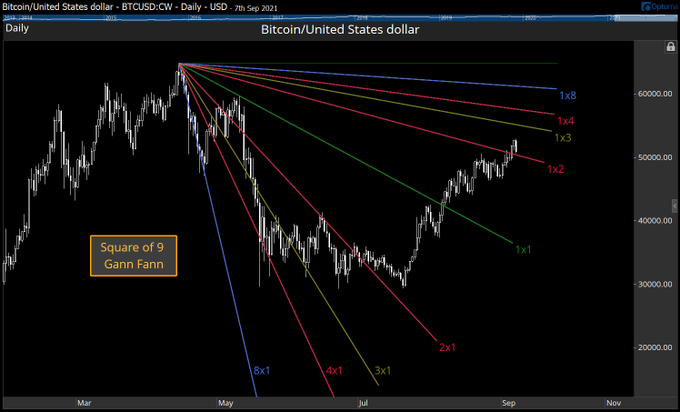
Planetary Fan is calculated the same way as the traditional Gann Fan but the time is measured in planetary degrees. Here's the Mars fan (geocentric) for $BTC from the March 2023 low:

2
1
16
The Jenkins True Trend Line is one of the proprietary tools by Michael Jenkins in our add-on module. It's based on
#Gann
's Square of 9 to automatically draw the line automatically from a major high or low, as in this example of $SPX:
0
1
18
We have many
#Gann
Square tools to help identify potential levels & turning points. Here's the Gann Square Range which takes the Time / Price range from A to B in $NIFTY to create the squares:

2
2
16
This weekend's equinox is a
#Gann
Seasonal date to be aware of, when the Sun's declination crosses below 0 and it's longitude is 180° (East on the Square of 9):
0
1
15
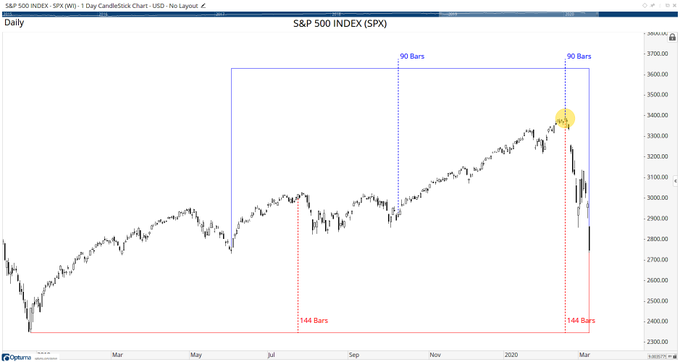
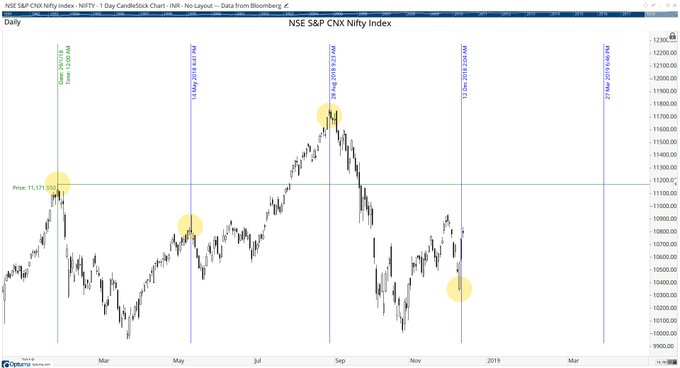
Feb 2020 $SPX high was 2 x 144 trading days from Dec 2018 low, and 2 x 90 from June 2019 low, as highlighted by the dynamic
#Gann
Day Count tool:
1
3
14
Great
#Gann
Planetary Line work! Here's how to plot the GPLs and show the signals using our astro scripting tools (the formula is in the comments):


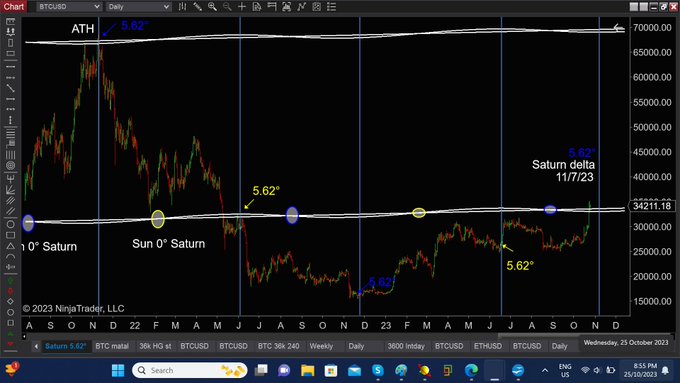
BTC - The Saturn delta. The angle between helio & geo positions.
On 11/7/23 the Saturn delta will be 5.62°.
5.62° was the Saturn delta at the BTC ATH.
DMOR
2
2
14
3
2
15
The
#Gann
Square Top/Bottom tool takes the value of where it has been applied to automatically calculate the squares. So from the $94 low in $MSFT the squares are 94 days wide and $9.40 high:

2
0
14
Long term weekly chart of $SPX with the Secret Angle tool from Michael Jenkins showing resistance at declining angle.

0
2
14
Our
#Gann
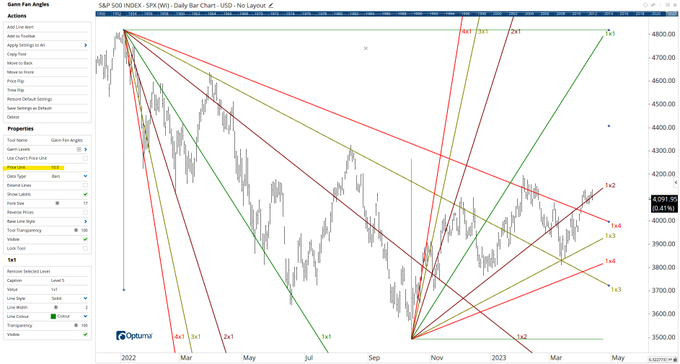
time & price tools eg Gann Fan, Squares, etc use a Price Unit in their calculation for scaling. Here's 2 fans on $SPX using 10 points per day (ie the 1x1 line moves 50 points in 5 days). More on Price Units & Factors here:
2
3
14
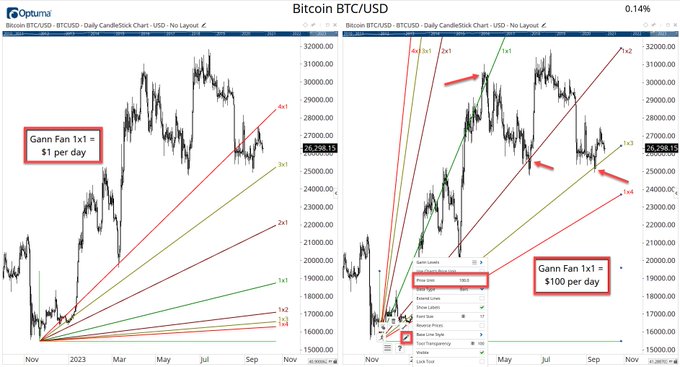
The Price Unit concept of our
#Gann
tools is crucial when applying them to different charts & timeframes, eg a 1x1 Gann Fan of $1 per day on $BTC won't work because it's too small for a $26,000 chart (left). Changing the Price Unit to $100 per day is a much better fit (right):
1
2
15
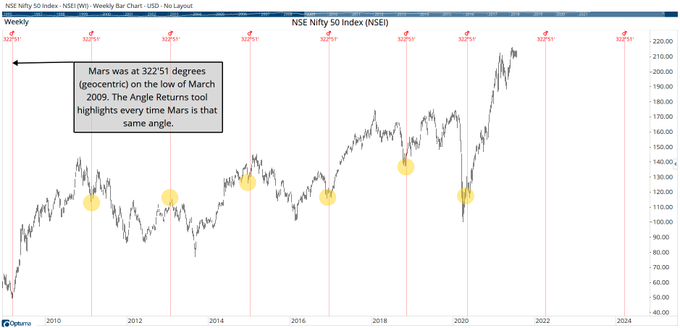
When Mars hits 322'51° the $NIFTY reacts... will it happen again in early April 2022? More on the Angle Returns tool here:
1
2
14
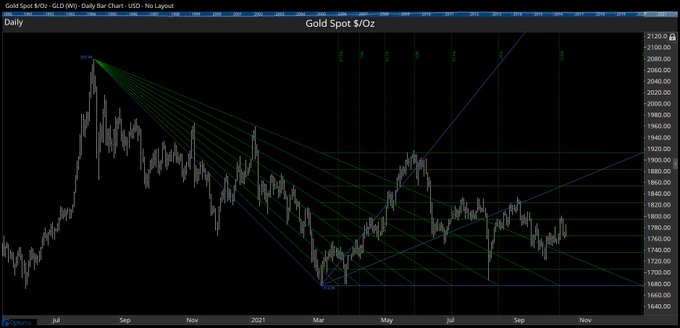
#Gann
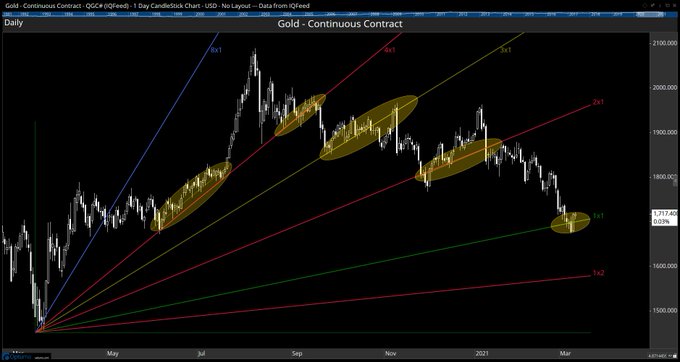
Fan from March 2020 low in $GLD $GC_F at $1 per trading day. Currently finding support at the 1x1 line:
3
3
14
As well as advanced
#Gann
&
#astrofinance
tools, we also have powerful geometrical tools, including those developed by Michael Jenkins. His Secret Angle Method draws the lines based on the move from A to B for potential support / resistance levels:
4
1
13
The Angles Return tool is used to show when planets are at the same longitude as significant highs or lows, as in this $NIFTY example:

1
4
13
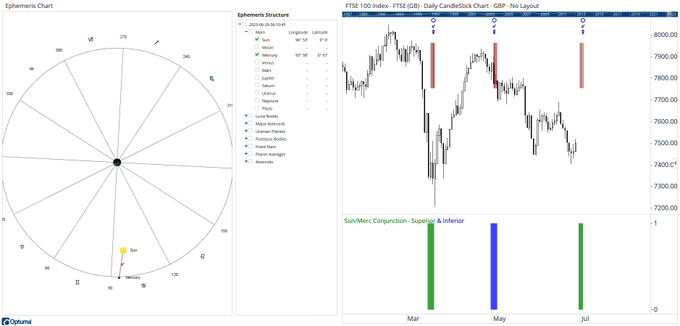
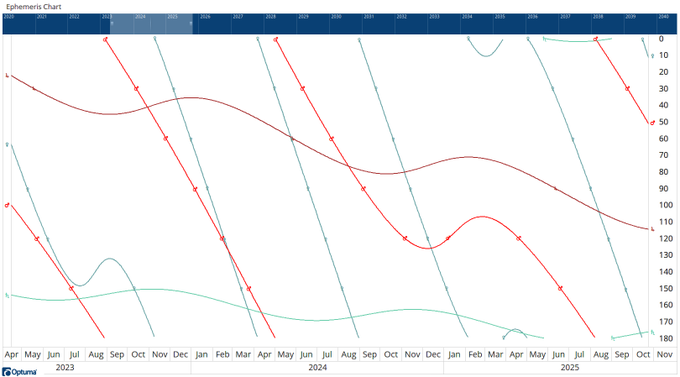
Today sees a 'superior' conjunction between Mercury & the Sun (ie Mercury is behind the Sun from Earth, as seen in our ephemeris chart).
0
1
14
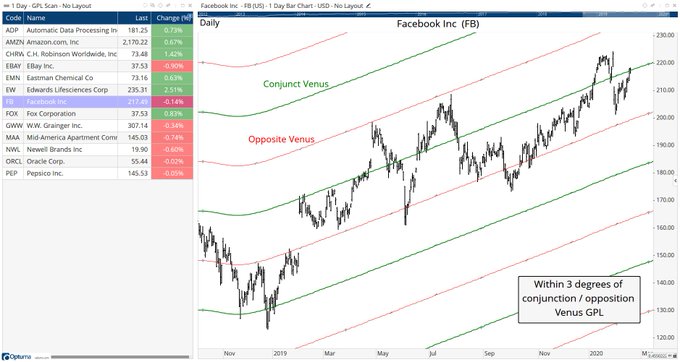
Did you know you can scan markets for price close to a
#Gann
Planetary Line? Here are the $SPX stocks currently conjunct or opposite Venus, incl $AMZN, $FB, $EBAY, $ORCL

#MercuryRetrograde
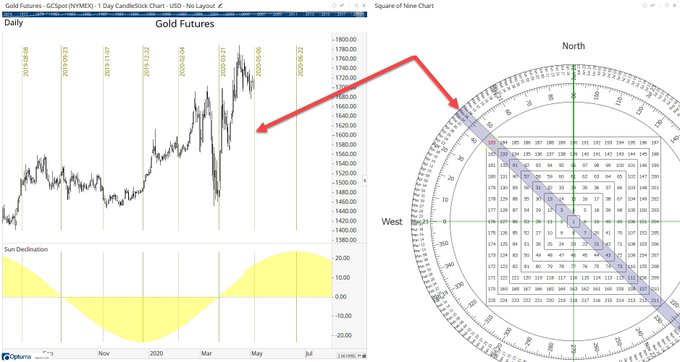
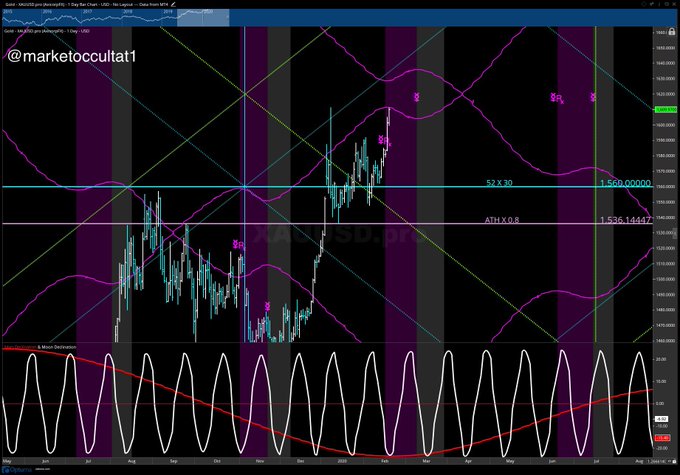
has $XAUUSD jumping to the Mercury
#Gann
Planetary Line. Mercury likes to play & to think it’s always a short is unwise, though opportunities often arise. Now at a good spot for a reversal but always waiting for technical confirmation.
@gann_trader
0
2
7
1
4
12
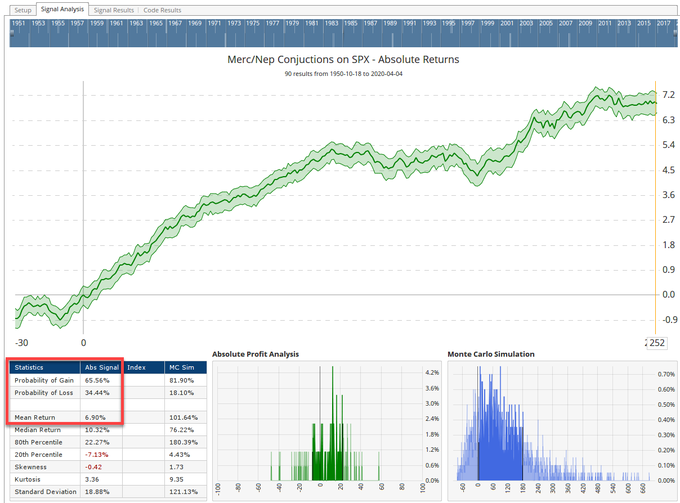
Mercury is currently conjunct Neptune which has happened 90 times since 1950. On average the $SPX is higher 1 year after each event 66% of the time, with an average gain of 6.9%. Any event or market easy to test using Optuma's Signal Testing &
#astrofinance
modules.
1
1
13
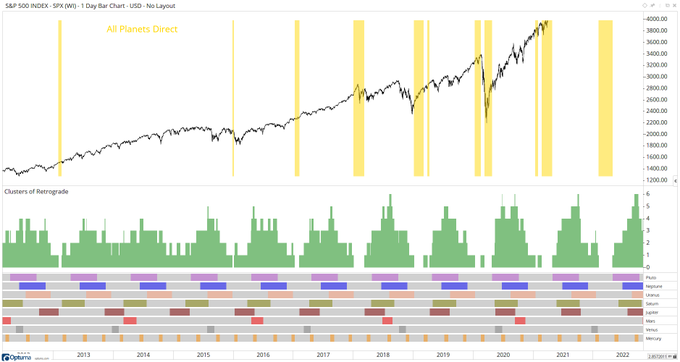
With
#Mercury
turning
#retrograde
today there are now six planets in retrograde motion (only 4th time since 1998). To show clusters in Optuma see here:

2
1
12
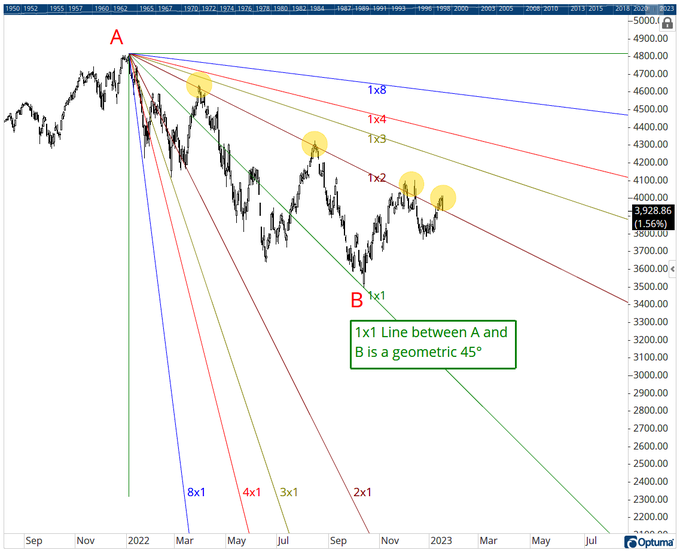
The 1x1 from A to B in this chart of $SPX is a geometric 45°. Strong resistance found along the 1x2 line.
To learn how to easily scale your charts using our tools see here:
3
4
13
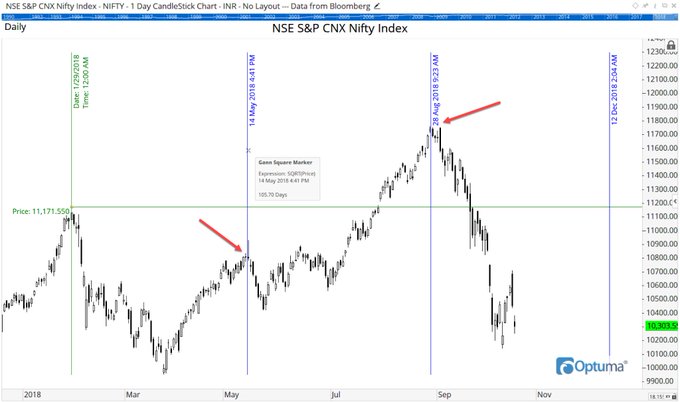
Use the
#Gann
Square Marker tool to calculate time intervals and/or price levels based on any mathematical formula. Here's time counts based on square root of Jan high for $NIFTY. Keep an eye on Dec 12th for possible reaction.
5
3
12
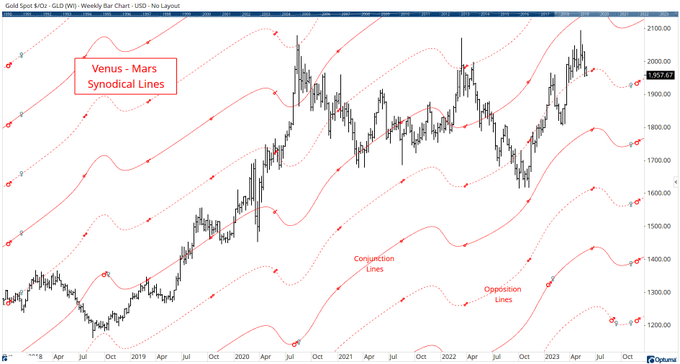
As well as
#Gann
Planetary Lines which plots a planet's longitudinal position on a price chart, we also have Synodical Lines which calculates the angle separation between 2 planets and plots on the price chart. Here's Venus - Mars conjunction and opposition synodics on $GLD:
0
2
13
Mercury is considered 'combust' when it has a longitudinal difference of 14° with the Sun when its motion is direct, or 12° when in retrograde. Mercury is currently retrograde and just over 10° from the Sun so is considered combust until the 13th:

1
0
13
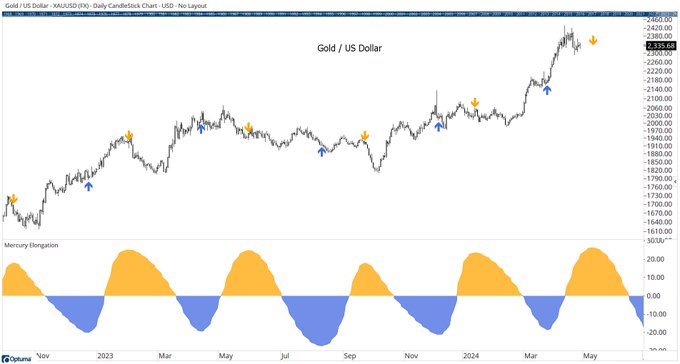
The elongation angle is the angle between a planet and the Sun as seen from Earth. Here's Mercury's elongation plotted below the $GLD $XAUUSD chart, with the arrows highlighting the extremes of elongation. Next date is May 10th.
0
3
12
It's also possible to scan for specific timecounts. These 6 $SPX stocks are approaching 144 days from a significant turning point $ALL, $ENPH, $EXC, $NEE, $NSC, $PPG

The
#Gann
Day Count tool has been designed to count calendar days / bars / weeks / planetary degrees from a user-defined point. Here's $BTCUSD from the Nov 21st low showing every 90 day & 144 day count. Currently at 176 days:
1
4
20
0
1
13
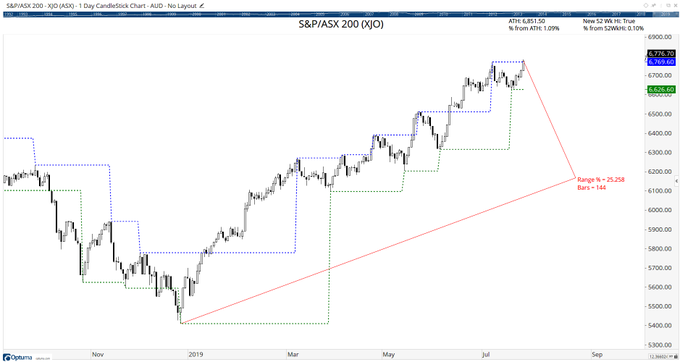
144 is an important Fibonacci timing count used by
#Gann
. Here's Gann expert Alan Oliver showing examples of turning points in the ASX 200 index $XJO

1
2
13
The Overlay Tool allows you to select a period of time and overlay it on the chart to help identify cycles. Here's $SPX 2009 vs 2021 as per JC's charts:
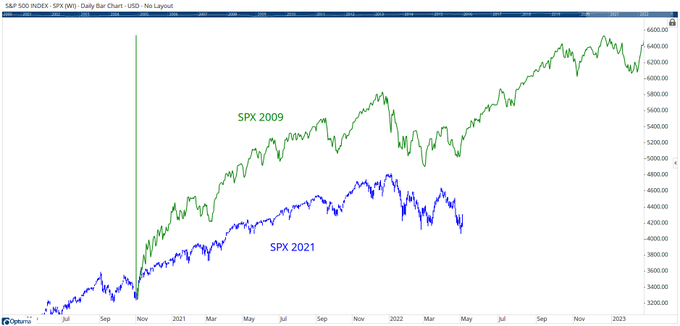

1
2
11
Uranus turned
#retrograde
on the weekend, joining Mars, Jupiter, Saturn, Neptune, & Pluto. Uranus currently at 40° ie cardinal cross of
#Gann
's
#Sq9
:
1
1
11
Learn how to use Optuma's powerful scanning module to find
#Fibonacci
&
#Gann
time counts, as shown by Alan Oliver in this short video. This week there have been 33 stocks in $SPX hitting a 144 bar time count from a significant turning point, incl $ADP:

0
1
12
Don Hall's
#Pyrapoint
technique uses the relationship between time & price to determine likely trend changes and support / resistance levels.
#Gann
#Square9

2
0
12
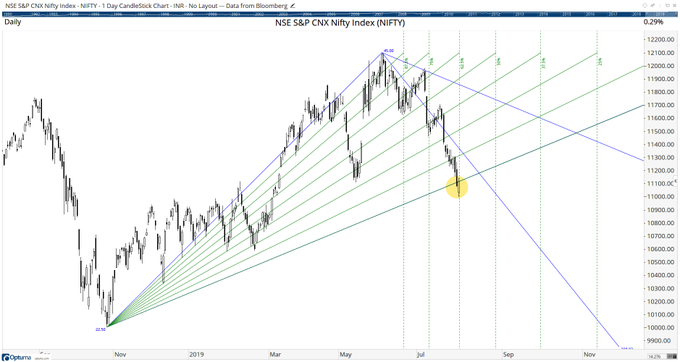
Interested in
#Gann
Fans? We have several types, including dynamic (where the user controls the 1x1 line), Planetary (time measured in planetary degrees), and also Square of 9 Fan based on square roots:
1
1
12
Since Feb 21st all planets have been in direct motion - and will remain so until April 27th when Pluto turns retrograde. Clients can log in here to see how to apply to your charts.
#Gann
#astrofinance
0
1
12
Don Hall's Pyrapoint tool is based on
#Gann
theory & calculated from a single click to show potential support / resistance levels and trend changes. Here's the calculations from on an hourly chart of $BTCUSD from the Feb 13th low:

0
3
11
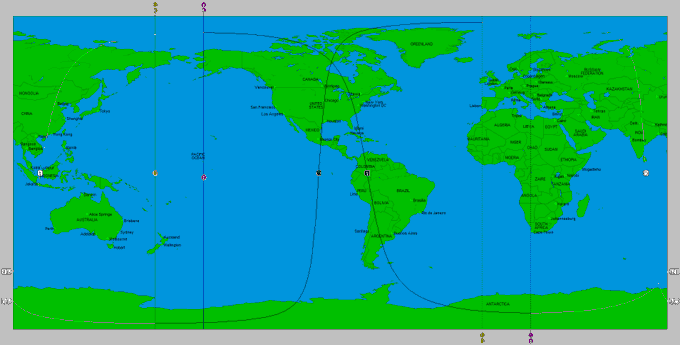
Here's how you can plot and mark the max east / west Mercury Elongations on a chart:

14th September
#Mercury
reaches Max East elongation from the Sun.
Mercury is connected with strong winds.
I have plotted the Sun/Mercury on map.
This may indicate strong winds, hurricanes, tornadoes, cyclones, typhoons along the lines.
#Astrocartography
8
8
88
1
0
12
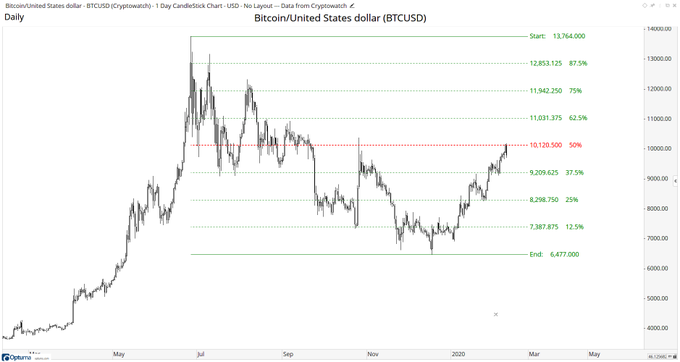
Dividing recent range of $BTC into 8ths shows interesting support / resistance levels. Failed to break above $10K this weekend - the important
#Gann
50% level:
1
3
11
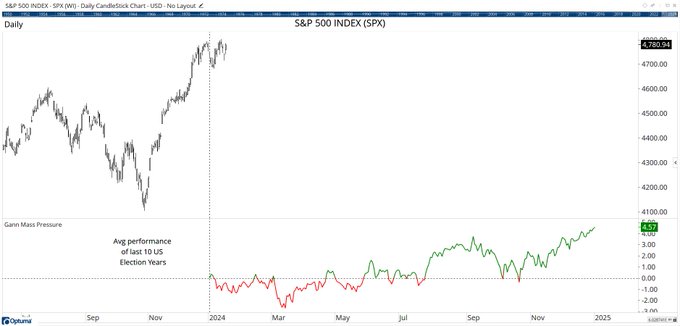
The
#Gann
Mass Pressure tool takes the performance of previous years (defined by the user) and plots the average performance. Here's the last 10 US Election years, with lows in March followed by a strong 2nd half to finish the year +4.5%:
2
1
11
The Signal Tester quantifies any astro event - including combined with a technicals. Here's what happens to $BTC after Mercury enters Aries as it did on 27th, but only if trading above 20 day moving average at the time (78% prob gain, avg 110% return 180 days later):

0
1
9
2019
#Gann
Mass Pressure chart for $SPX. The new tool will be available soon to calculate for any chart and cycle period
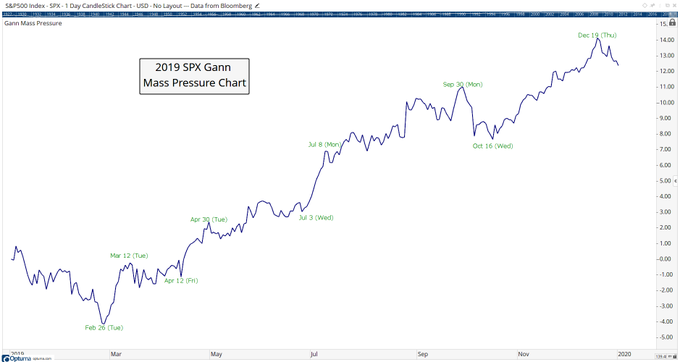
1
4
10
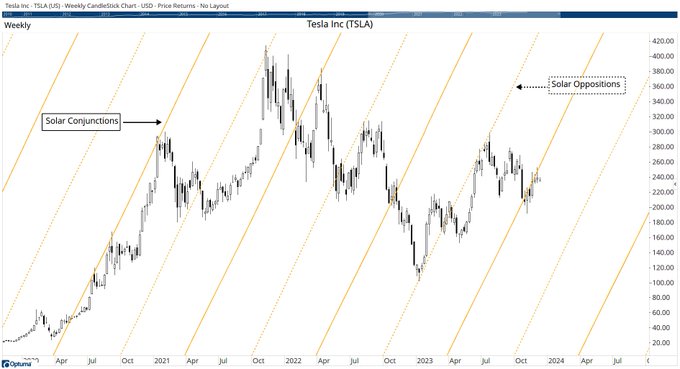
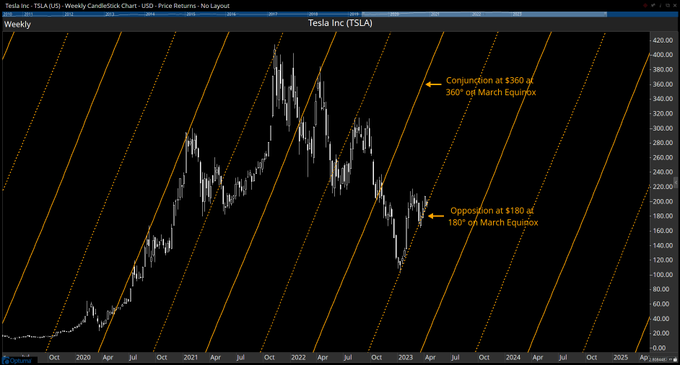
$TSLA and the Sun's longitude displayed in the
#Gann
Planetary Lines tool shows how price has respected the conjunct and opposite levels over the last couple of years:
0
1
11
#Gann
claimed the 144 time count (a
#Fibonacci
number) was one of his greatest discoveries. Here's an example on $NZDCAD from Alan Oliver:
1
4
10
A client wanted to backtest buying $MSFT when Venus is at 23° Cancer and selling at 23° Libra over the last 10 years. 7/10 wins with 84% profit. Using our astro scripting functions it took 2 mins to build...
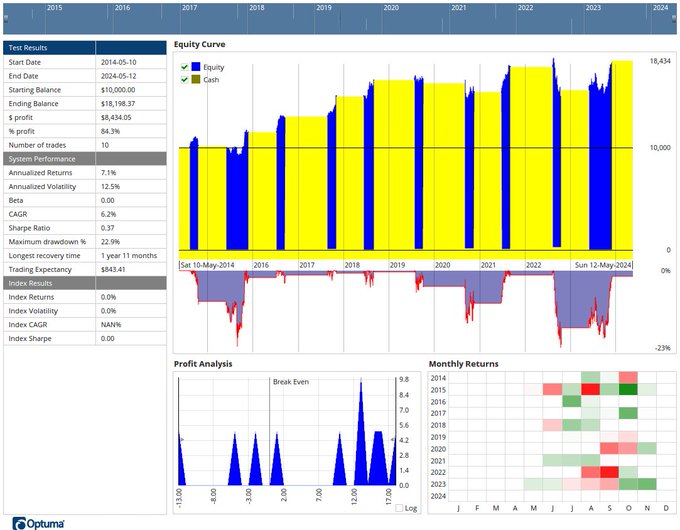
2
0
10
Jupiter is currently trine Venus. As well as the Aspects tool we have 2 types of
#ephemeris
: a 3D representation and a time series that allows you to download the data for selected planets & aspects.
#Gann
#astrofinance

1
1
9
We were asked if we could plot the 17th harmonic of Jupiter in our
#Gann
Planetary Lines tool for $BTC. Using the Custom Angle option set to 21.18° (360/17) and a price unit of 100:
1
2
10
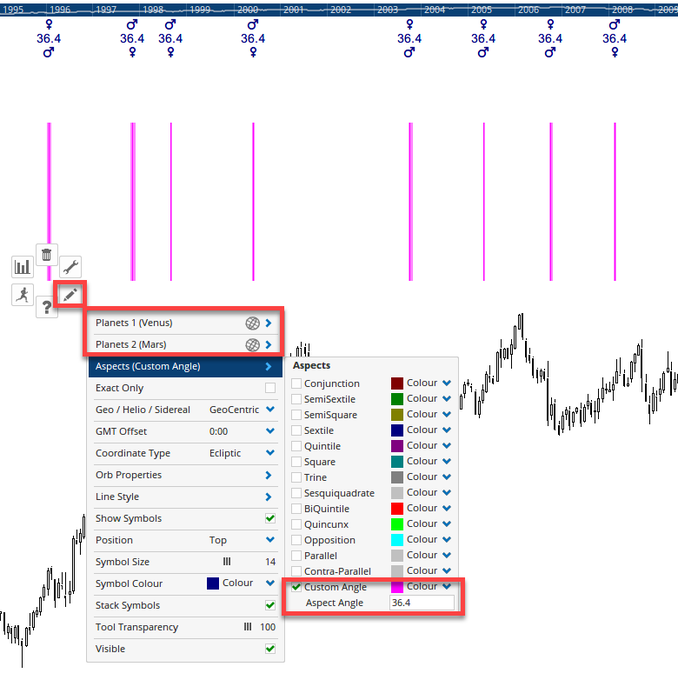
Did you know that you can add a custom angle to the Planetary Aspects tool? So as well as showing Square, Trine, Conjunction, etc relationships between planets you can set a custom angle. Here's Venus & Mars every 36.4°
0
0
9
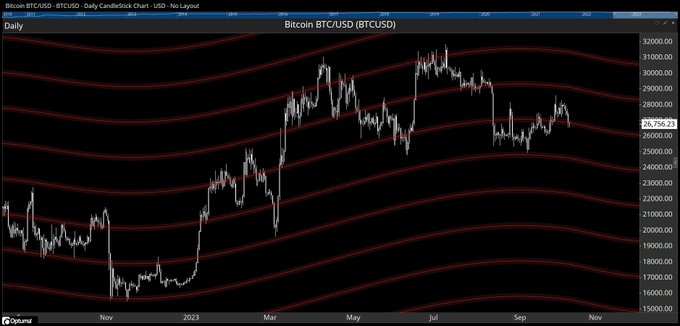
Using a price unit of 10 with the
#Gann
Square of 9 tool, Bitcoin $BTCUSD $XBTUSD often finds support / resistance at 180° and 360°. Today just broke 180° (690 x 10 = 6900).


1
1
10
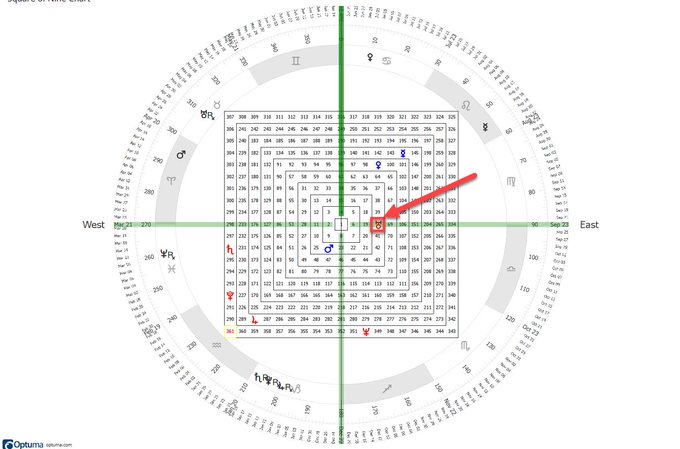
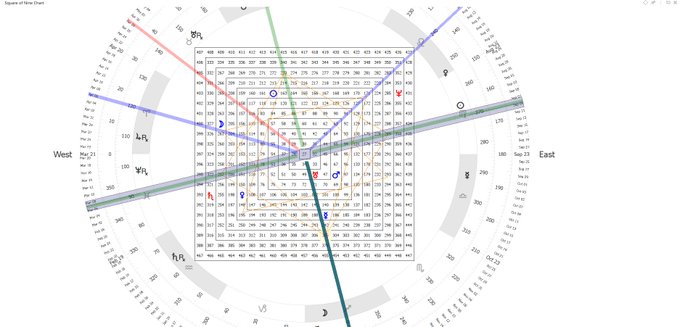
More info on our
#Gann
Square of 9 chart here, including planetary positions (red are in retrograde) & angle overlays:

Square of Nine... Kadim bir hesap makinesi...
Square of Nine...An ancient calculator...
#btc
#4cast
#ethereum
#forecast
#gold
#forex
#usd
#fed
#interest
#inflation
#crypto
#gann
#marketgeometry
#quadrivium
#squareofnine
#hexagonchart
1
1
2
1
0
9
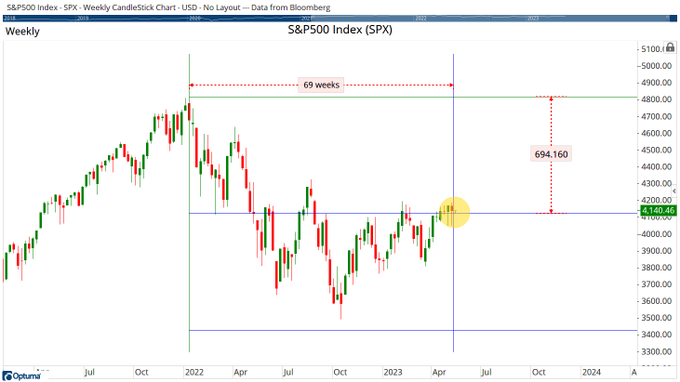
Use the
#Gann
Square Marker to calculate custom ranges, eg using SQRT(Price) from the $SPX 4818 high draws the intervals 69 bars apart. We are currently 69 weeks and 690 points from the high:
0
1
10
0
2
9
Followup on $NIFTY: Will be interesting to see if that low holds
0
1
10
@kates_9999
@mmacycles
Here's the average performance of Dow Jones $DJIA $INDU when Jupiter enters Taurus (Day 0). On average, the index starts to turn down 2 weeks prior & continues down for 3 more weeks before recovering. After 3 months (63 trading days) avg return is 3.33%, with 62.5% probability of
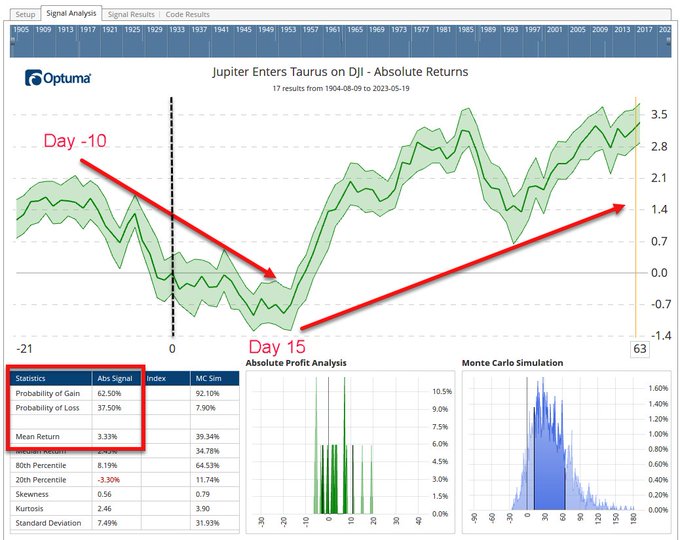
3
2
10
Today is 144 trading days (important
#Gann
count) since Dec 2018 lows in $SPX & $XJO. The ASX200 index closed above previous pivot for new 52 week high - will be interesting to see if it holds.
1
0
10
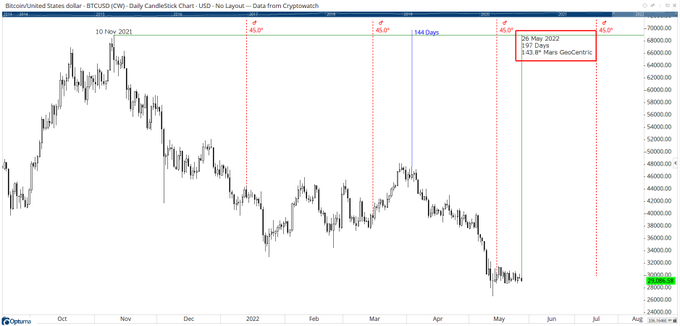
The
#Gann
Day Count tool counts how many trading days / calendar days / weeks / planetary degrees from a user-defined point to the current day. Today is 197 days (or 144° of Mars) since the $BTC high in Nov 2021:
0
0
10
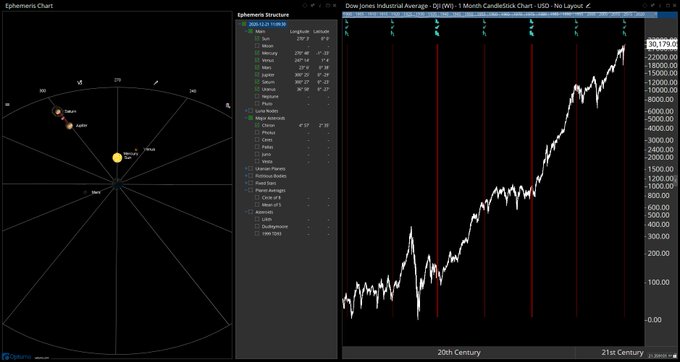
On this
#solstice
&
#GrandConjunction
day, learn how to link your price charts to the
#ephemeris
in this 2min video:
0
2
10
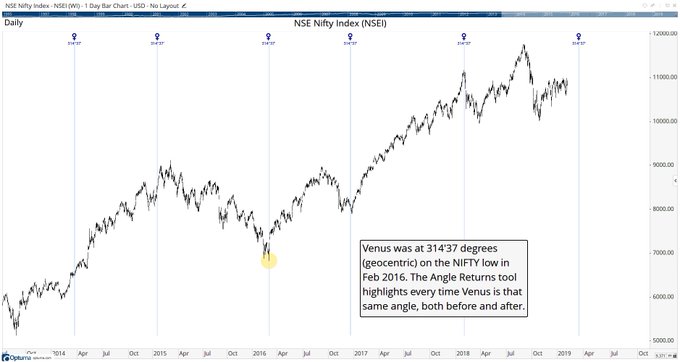
A strong move today in the $NIFTY with Venus approaching the same geocentric angle (314'37) as the Feb 2016 low.
#astrofinance
Planetary Angles at major turning points often influence the market when they repeat. The Angle Returns tool identifies these angles, eg Venus on the $NIFTY from the Feb 2016 low at 314'37 has occurred twice since, both on major turns. Next one is March 12th
#Gann
#astrofinance
1
1
5
4
1
9
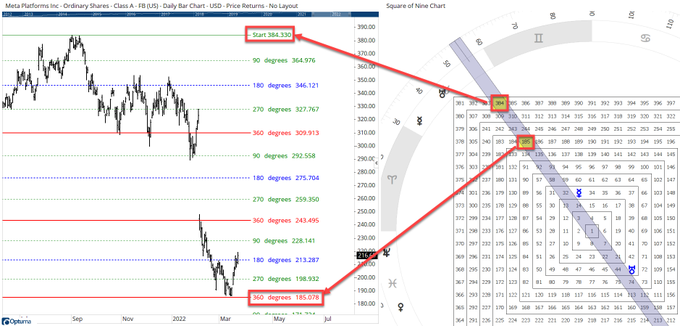
#Gann
Square of 9 levels for $FB from all-time $384 high shows interesting support / resistance levels, with recent $185 low occurring on an exact 360° line:
1
2
9
Monday Sept 23rd is an important
#Gann
seasonal date - autumnal equinox in the northern hemisphere (spring equinox in the southern) when the sun's declination crosses 0. These can be automatically plotted in your charts:
0
2
9

Today is the 11th anniversary of the $SPX 666 bottom.
#Gann
Square Marker tool set to 666 points high and 360 solar degrees wide:
2
1
8
We have the lunar Apogee/Perigee tool that can be added to any chart, plus the Show View tool can show the distance (or any planetary value) of any planet with a simple script formula. More on astro scripting:

Daily motion of the
#Moon
is very important for
#AstroTrading
and timing.
#Gann
#ASTRO
I made this graph to show you the lunar swings in one month.
#Perigee
#Apogee
#Financialastrology
#Astrology

2
2
21
0
1
9
Great use of a
#Gann
timecount scan to identify time from major turning points! Scripting examples here:

0
3
9
Here's one way to geometrically scale your chart:

Students of Michael Jenkins may be familiar with his Secret Angle method. Here's a chart of $SPX showing the angles calculated from the move from A to B. This is one of 9 tools we have available in the Jenkins module:
1
3
18
0
1
9
Did you know that we have the full suite of geometrical tools by Michael Jenkins of , including his Secret Angle Finder? More details:
2
1
8
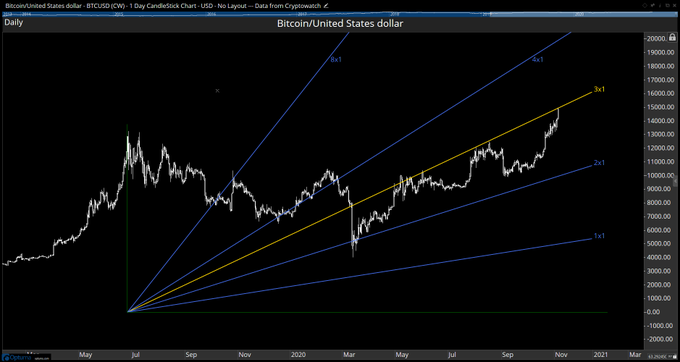
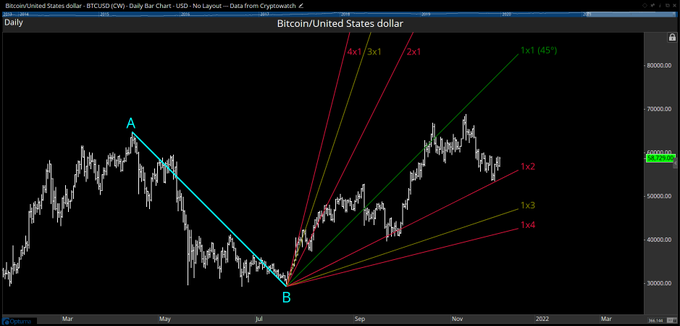
Scaling the chart so that the move from A to B in $BTCUSD is a geometric 45° we can use the same time/price ratio to draw a
#Gann
fan so that the 1x1 line from B is also 45°. Good support at the 1x2!
1
0
9
If you are interested in the work of Michael Jenkins take a look at our optional Jenkins Tool Module containing several of his proprietary tools, including the True Trend Line, Natural Ratio, & Secret Angle Finder:
1
1
9
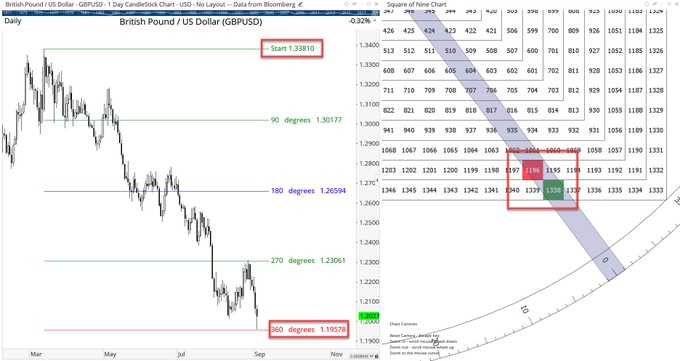
Our
#Gann
tools have a Price Unit to convert calculations relevant to the price increments of the chart. eg Square of 9 tool for $GBPUSD shows 360 degs from March 1.338 high is 1.196 (calculated from 1338 & 1196 on the Sq9 wheel).
0
1
9
The
#Gann
Day Count tool keeps track of trading days, calendar days, & planetary degrees from a specific starting point. Yesterday was Mercury 720° (helio) from April's high in $BTC:

1
3
9