

mathieu rajerison
@datagistips
Followers
2K
Following
9K
Media
396
Statuses
10K
Fun with #qgis #rstats 🦖 Cartomaticien @OSMdata 🌍 DiGIStal @ceremaCom 🌱 Starting #MapFailbruaryChallenge 🤪 #FrugaliTek 🐣 views are my own
Aix-en-Provence, France
Joined February 2012

Google is now using Gemini to cross-reference ~250M places with Street View imagery to identify visible landmarks for turn-by-turn nav. Think iconic buildings, gas stations and restaurants. So instead of "turn right in 500 feet" you get "turn right after the Thai Siam
200
341
8K

💡Des fonctionnalités avancées Rapideditor pour OpenStreetMap 🗺️. Cette version augmentée de l'éditeur OSM ✏️ dans le navigateur permet de récupérer des données manquantes 🔎grâce aux grands de la tech 👌 (route, bâti, commerce, chemins piétons). 👉 https://t.co/njDbg4xHJe
0
3
4

🌍 Découvrez l’équipe de #recherche #ENDSUM du #Cerema : approfondir les connaissances des phénomènes physiques et contribuer à la mise au point d’outils de diagnostic n’altérant pas les milieux auscultés https://t.co/XLHLTTqqBe
#CeremaRecherche
0
1
0

#30DayMapChallenge 🗺️, jour 3 : Polygones. Les préfectures de France 🇫🇷, représentation fière et massive du pouvoir central "dans les territoires". Hôtel classique du XIXe siècle, folie typique des années 1960, geste expérimental du XXIe siècle... Que de formes variées !
6
30
185

The 1.4 release of @duckdb supports using a DuckDB database to serve vector tiles! Of course, I had to try this out in R. Check it out: all 242,000 US Census block groups dynamically served as vector tiles from a DuckDB database, displayed on a MapLibre map from R in Positron.
6
65
523
📊 Inventaire national des #friches : l’importance des #observatoireslocaux. 📢 Participez au #webinaire du 18 novembre « Monter son #observatoire des friches et contribuer à l’ #inventairenational » https://t.co/p9pnKUzPVk
#CeremaFoncier
0
1
0
📊 Inventaire national des #friches : l’importance des #observatoireslocaux. 📢 Participez au #webinaire du 18 novembre « Monter son #observatoire des friches et contribuer à l’ #inventairenational » https://t.co/p9pnKUzPVk
#CeremaFoncier

cerema.fr
Découvrez comment structurer un suivi local des friches, enrichir vos données et les partager via Cartofriches.
0
1
0


That‘s crazy. 1.5km 3D Gaussian Driving at 280-500fps. City scale Gaussians with exciting real world applications.

It's possible to render a 1.5 km gaussian platting driving scene at 280fps-500fps on RTX 5090.
10
59
674

This is the power of YOLO, trained on a laptop for ~1 hour, with a Kaggle dataset. Oh, and just ~100 lines of Python. I can make a startup on this and it took me literally a couple of hours.
1K
3K
41K
Second article autour de la transformation de #QGIS en station d'annotation performante pour l'IA 🤖 sur l'exemple des parkings 🚗🚗🚗. https://t.co/UpWEyA2eBK ✏️J'ai fait des petits dessins et essayé d'insérer des petites touches d'humour. #QGIS #geotribu #IA #annotation

datagistips.hypotheses.org
L’annotation de données, ou la saisie de données, est un préalable essentiel à l’IA. Car plus il y aura de données, si possible de bonne qualité, et mieux elle apprendra. L’IA permet d’atteindre des...
0
0
3
✍️ Reprise de l'écriture avec une réflexion sur l'annotation pour la #GeoIA depuis #QGIS vis-à-vis de l'annotation classique pour l'IA avec Label Studio. https://t.co/jCFifKd3gN
#gistribe #geotribu #QGIS #GeoIA
datagistips.hypotheses.org
Dans ce billet, nous allons nous intéresser à l’annotation de données sous QGIS vis-à-vis d’autres outils plus classiques en IA comme Label Studio ou LabelMe, en nous intéressant à l’objet parking....
0
0
1


Un papier de fond dans les Échos aujourd'hui sur le Lydex, le lycée d'excellence marocain de l'Um6p qui sature littéralement le coucours international des grandes écoles, et nous rappelle la panne de la méritocratie française. Papier que la direction de l'EN devrait lire
39
253
633

Cartographie des Zones Climatiques Locales (LCZ) dans les aires urbaines françaises Le Cerema met à disposition l’outil Zones climatiques locales qui permet d’accéder aux données et cartes indiquant le degré d’exposition au phénomène d’îlot de chaleur https://t.co/Te6HDUlm66
1
4
7
🗞️"Sur les #friches industrielles, faire grandir la #ville sans rogner les champs" @LEXPRESS "Dans les #HautsdeFrance marqués par la désindustrialisation, plus de 3.000 sites ont été recensés par la plateforme nationale #Cartofriches" du #Cerema. https://t.co/XHmWoKafoN
#Foncier

lexpress.fr
Lille - Des skateurs qui s'entraînent, des habitants qui sirotent un café au milieu d'enfants joueurs: la vie a repris à Fives Cail, ancienne usine monumentale au coeur d'un quartier populaire de...
0
1
0

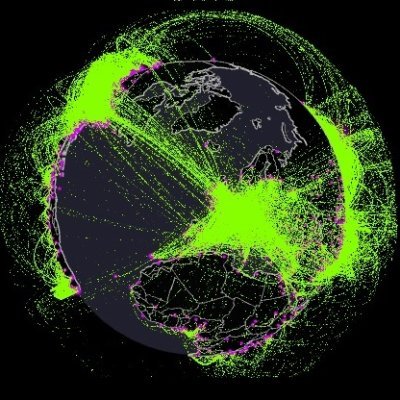
a=(x,y,d=mag(k=9*cos(x/8),e=y/8-12.5)**2/99+sin(t)/6+.5)=>point((q=99-e*sin(atan2(k,e)*7)/d+k*(3+cos(d*d-t)*2))*sin(c=d/2+e/69-t/16)+200,(q+19*d)*cos(c)+200) t=0,draw=$=>{t||createCanvas(w=400,w);background(9).stroke(w,66);for(t+=PI/45,i=1e4;i--;)a(i%200,i/55)}#つぶやきProcessing
105
656
5K
Le Parc National des Calanques @ParcCalanques recherche sa/son futur/e chargé/e de mission SIG 🌍🌊🐦 https://t.co/clVMGovYVQ
#emploi #gistribe
0
0
0