
Benjamin Bach
@benjbach
Followers
2K
Following
2K
Media
213
Statuses
2K
Academic, Information Visualization, leading VisHub research group https://t.co/9wbalyTKHH, U of Edinburgh
Edinburgh, Scotland
Joined September 2010

I'll present the work "From Science to Story: Communicating Permafrost Concepts with Data Comics" at the Permafrost Education and Outreach session at #ICOP2024. See you tomorrow (Tuesday) at 11.30 am. Find the comic at: https://t.co/p54jWeOfGV
1
2
12

I'm pleased to announce that the final program for the Historical Network Research Conference 2024 #HNR2024 is now available: https://t.co/CcNBsFaemw (8-10 July 2024) Join us in Lausanne @UNIL or online! Registration here (free): https://t.co/c67CafxQPm
@HNR_org
0
8
16
How do we address ethical dilemmas in AI and data visualization? We present a card-based approach to aid learning, discussing, and reflecting on the ethical dilemmas that may arise from the integration of AI technology and visualization. Check out our poster at board164 #CHI2024!
1
4
7
Our work "Design Patterns for Data-Driven News Articles" is presented at #CHI2024. Through the analysis of 162 data-driven news articles collected from news media, we identified five article types and 72 design patterns. The presentation will be at 3pm on Monday in room 324.
1
6
24

What is the purpose of using data visualization for collecting or modifying data (and how)? Check out our INPUT VISUALIZATION #CHI2024 paper: 📰 https://t.co/RalWLxPC0f 📺 https://t.co/BgUTR0L24t 🌐 https://t.co/DwHqNaP8QM
#CHI #dataviz w. Wesley Willet, @nathaliebressa
0
6
28

🚨 We are hiring! 🚨 We, the data & visualizations department at @derspiegel, are looking for a German speaking data visualization developer! ➡️ That's what we do: https://t.co/wicbaeK30t ➡️ Apply here: https://t.co/C9JEGcW8uG 💬 DMs open for questions.

spiegel.de
Von Datenanalysen über interaktive Rechner und visuelle Storys bis zu Dashboards und Dauerformaten – hier finden Sie alle Beiträge des Ressorts Daten & Visualisierungen.
2
23
52
👉Hybrid Workshop on Visualization for #ClimateAction and #sustainability: submissions due Jun10+Jul31, held Oct 12 or 13 @ieeevis. #dataviz
https://t.co/qFUeJGFq8g w/ @fanny_uoft @elenikostis @marksubbarao Yvonne Jansen @rsoden_
2
0
12
We invite you to submit to our 2nd IEEE VIS EduVis Workshop on Visualization Education, Literacy, & Activities to continue discussions on visualization education. Submissions are due July 1. More info: https://t.co/yhNvIzjPlN @ieeevis @mandykeck @benjbach @lonnibesancon
ieee-eduvis.github.io
IEEE VIS Workshop on Visualization Education, Literacy, and Activities
0
3
12
Join us for a new series of hybrid joint #dataviz #meetups in #edinburgh + #newcastle starting on April 25 with monthly sessions: https://t.co/uYXxqR7lem. +++We want to know you, it's open to everybody, spread the word+++ @DesignInf @vishublab @InfAtEd @uta_ente @shuxinhuan.
0
4
7
What an exciting line-up of speakers! Looking forward to meeting you all in #Berlin!

Unser Programm für die NIAM 2024 ist online und die Anmeldung offen: https://t.co/t8JMPF3Dvc Wir haben spannende Vorträge im Programm! Die Veranstaltung findet in der Staatsbibliothek zu Berlin, Unter den Linden oder via Livestream statt. Wir freuen uns auf Euch!
0
1
7
We're hiring! University Teacher/Lecturer (Teaching) in @DesignInf. In areas related to design, computer science, human-computer interaction, data science and visualization, and AI... Great dept, great crew.
0
1
3
We're hiring! University Teacher/Lecturer (Teaching) in @DesignInf. In areas related to design, computer science, human-computer interaction, data science and visualization, and AI... Great dept, great crew.
elxw.fa.em3.oraclecloud.com
The School of Informatics at the University of Edinburgh is seeking to appoint a suitably qualified and experienced candidate to the post of University Teacher in Design Informatics.
0
21
19

There was this big line for the opening of the Information XYZ exhibition at @InfoPlusConf . Thank you to everyone who stood there in the cold for coming!
1
1
13
Again, a huge thanks to the @InfoPlusConf student volunteers, an amazing proactive team organized by @shuxinhuan + @apister2 !! @vishublab @DesignInf

Very happy to have been the student volunteer chair of #infoplus2023 with @shuxinhuan, it was a lot of fun, the talks, people, and the exhibition were all great, and huge thanks to all the SVs!!
0
3
28
Amazing @visualisingdata for the video, for coming, and kudos again go @pmcruz @uta_ente, Carmen Hull and all the @InfoPlusConf artists for the amazing #dataviz exhibition at @InspaceG #Edinburgh
0
1
18
What a marathon! Having been at @ieeevis in Melbourne, just co-organized @InfoPlusConf in #edinburgh w/@uta_ente, now preparing submissions for @EuroVisConf, and learning about @OutlierConf in #chicago! #dataviz is taking over...
🥁 Get ready for #outlier2024! This time we are heading to Chicago, USA! (we will offer a virtual conference too) Block your calendars for 12-14 June 2024 for a conference you won't want to miss! Stay tuned for more details! #dataviz #datavisualization #datavizsociety
0
0
10
0
2
11

Woohoo, that’s a nice looking table!!

Books are ready on display @InfoPlusConf! Including @makingwithdata, @datasketches, @questionsinDV, @christiansenjen, @nigelblue & many more. Browse in the break area! And take a flyer for more info. #infoplus2023 #dataviz @tamaramunzner @AlbertoCairo @CRCPress @tandfSTEM
0
1
12
And this was the view from stage right before our talk. 🤗
2
1
10
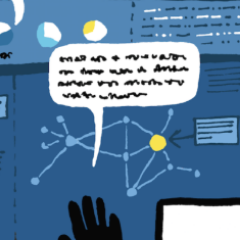
Data visualisations are public restroom walls - they just don’t know it yet! Tobias Kauer and Derya Akbaba talking about Dihital Traces as Design Material at @InfoPlusConf #infoplusconf23
0
2
10