

ZoomCharts
@ZoomCharts
Followers
1K
Following
1K
Media
532
Statuses
992
Drill Down Visuals for #PowerBI and JavaScript Charts Library for #DataExploration
Europe
Joined February 2014
Say hello to Drill Down Line PRO - the new line chart for Power BI designed for drill down and powerful data storytelling. ✅ 25+ series✅ Interactive drill downs✅ Conditional formatting ✅ Multiple line styles ✅ Smooth zoom & scroll. Now available in AppSource.

0
0
2
We’re running a live Power BI workshop this Thursday at 12:00 UTC. In the session, we’ll explore how to build reports that actually help Customer Success and Sales teams understand what keeps clients coming back. 📍 Join here:
1
1
3
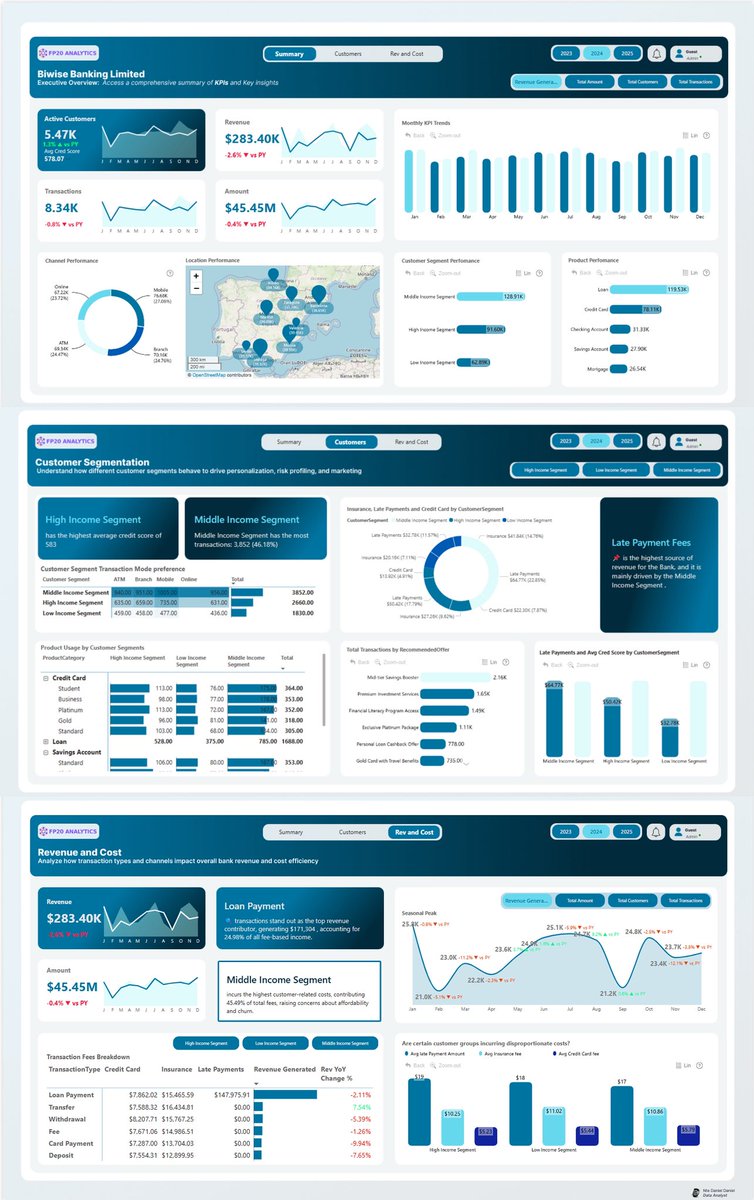
The Customer and Transaction report every finance team is looking for 💰📈. #BuiltWithZoomCharts.

🚨 𝐅𝐏𝟐𝟎 𝐀𝐧𝐚𝐥𝐲𝐭𝐢𝐜𝐬 𝐂𝐡𝐚𝐥𝐥𝐞𝐧𝐠𝐞 𝟐𝟕 .My entry is in!. Analyzed 𝟐𝟎𝟐𝟑–𝟐𝟎𝟐𝟓 banking data for Biwise Bank across products, channels & regions. 🔹 €𝟒𝟓.𝟒𝟓𝐌 in transactions.📱 Mobile banking tops revenue .📍 Murcia & Barcelona lead in customer volume.👥
0
0
9
RT @Pucheo_dataGuy: Hi, #datafam super glad to share with you another @MSPowerBI project - A Bank transaction report (data courtesy of @F….
0
20
0
Banking Dashboard with ZoomCharts Drill Down PRO visuals, submitted to the Banking Customer & Transactions Data Challenge. #BuiltWithZoomCharts.

Met the deadline for the FP20 challenge 27…me & last minute 🤝. This is a two page @MSPowerBI report analyzing banking transactions to reveal revenue drivers, customer segments, and branch performance. Chart:@ZoomCharts . View more here:

0
1
8
Power BI for the Banking Industry! See how a Power BI Challenge participant handled Customers & Transaction Analytics using Drill Down PRO visuals by ZoomCharts. #BuiltWithZoomCharts #FinanceAnalytics.

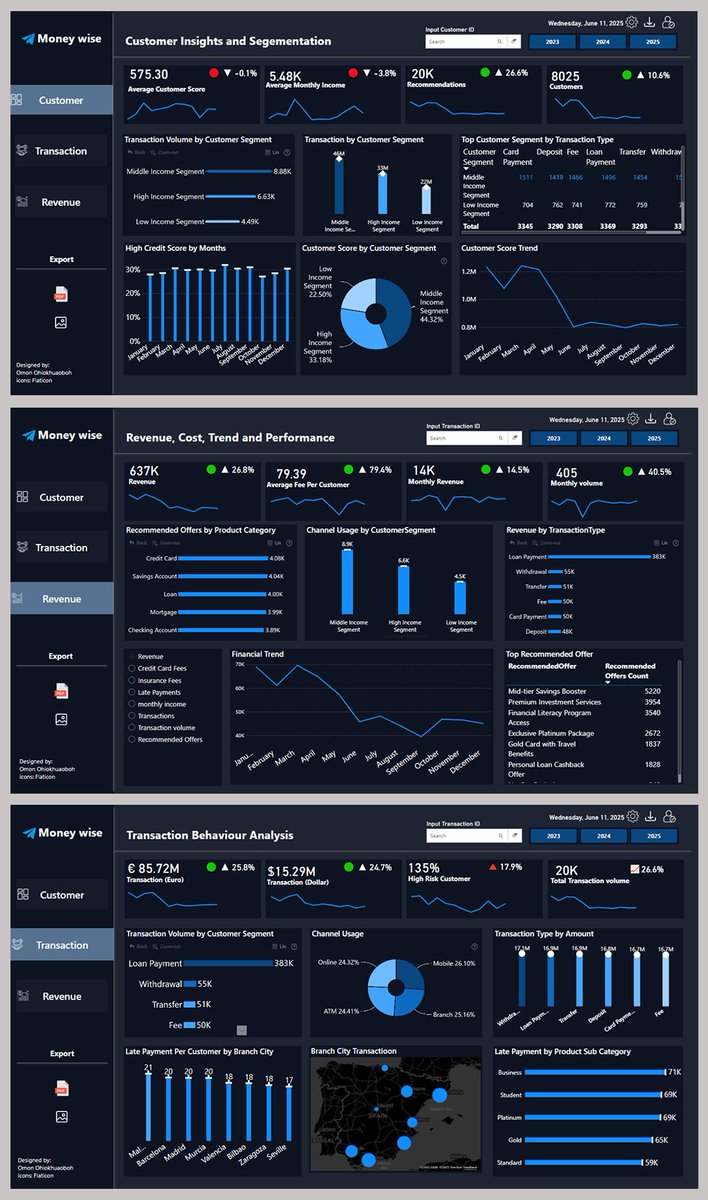
Built a Power BI report on Banking, Customer & Transaction Analysis using @ZoomCharts @MSPowerBI . 💡Highlights:.• €46M+ from middle-income customers.• €85M+ in Euro transactions.• Top offers: Savings Booster, Investment Services.🔗
0
0
8
Explore a new creative Power BI project with ZoomCharts Drill Down PRO visuals, created by a Monthly Data Challenge participant, analyzing banking transactions and customer insights! #BuiltWithZoomCharts.

🚀 I’m participating in #FP20Analytics Challenge 25!.Analyzed banking transactions by segment, channel & product to uncover key insights on revenue, fees & behavior. 📊link: #builtwithzoomcharts @ZoomCharts #FP20InventoryManagementAnalysis


0
0
4
🚨 LIVE Workshop: Power BI for Marketing Analytics.📅 June 11 | 🕛 12:00 UTC.📍 LinkedIn & YouTube.Learn to build unified reports & visualize social media campaign performance using the June @OnyxData DataDNA dataset. Register: #PowerBILearning
0
0
4
This SaaS Financial Statement Power BI report, featuring ZoomCharts Drill Down PRO visuals, was submitted to the FP20 Analytics Data Challenge, and it won the competition!. #FinanceDaily #PowerBIDashboard.

Financial Statement Analysis report that won FP20 #data #Analytics challenge for May 2025 Edition. The analysis covered some key financial metrics likes Revenue, Expenses, Gross Profit, EBIT, COGs, and Net Profit/loss.#buitwithzoomcharts @ZoomCharts.@MSPowerBI .@MicrosoftLearn
0
2
6
🚀 New article out now!.We’re diving into Stacked Column Charts in Power BI, explore stacking options in facet charts, and learn some neat tricks using our advanced customization features:
0
1
3
We’re going live in 1 hour with a Power BI workshop on banking report creation!.Customer insights, transaction analysis, and more! 💳. Join us 👉
0
1
4
Each month, we support hundreds of Power BI developers around the world in creating amazing reports. Thank YOU for using ZoomCharts visuals and participating in our challenges!.#PowerBILearning.

Hi #datafam,. I managed to post this just before submission deadline of the Onyx Mobile Phone Sales Data Challenge - May 2025. This was also my first time participating in the @ZoomCharts mini-challenge. Interact here:


0
2
6
See the creative approach to designing the ZoomCharts Scatter chart ⬇️. #DrillDownScatterPRO #ZoomCharts #PowerBIVisuals.

The One Time the Scatter Chart is not so confusing. I'll admit it, the scatter chart is usually that one visual stakeholders ask to skip. Too messy. Too abstract. Too analytical. But this Gartner-style quadrant flipped that script.@ZoomCharts #Builtwithzoomchart

0
0
2
We are thrilled to share the Financial Statement analysis Power BI report created by the participant of the monthly data challenge by FP20 Analytics and supported by our team!. #BuiltWithZoomCharts #PowerBIVisuals.

Just completed Challenge 26 of the #FP20Analytics series — a deep-dive Financial Statement Report for a SaaS company, built using Power BI and ZoomCharts Advanced Visuals!. #FP20Analytics #FinancialAnalytics #PowerBI #ZoomCharts #DataVisualization #FinanceDashboard #SaaSAnalytics


1
0
6
Power BI for Finance!.Our live workshop is happening this Thursday, 15 May! 🚀 See You There: Join us to explore best practices, Power Query tips, DAX formulas, and stunning visuals, all tailored for financial reporting! #SaaS #Finance #DataChallenge

0
1
2
🆕.A bunch of new features were implemented in ZoomCharts visuals during April, start using them in your Power BI reports!.
0
0
4
RT @ukolojoaud: New Report: #healthcare analysis for Onyx data #DNA challenge April 2025 edition. #builtwithzoomcharts @ZoomCharts #USA #….
0
1
0
Great use of ZoomCharts visuals in this #PowerBI report analyzing healthcare data!.Insightful work, @xackkent01 👏. #DataViz #HealthcareAnalytics #ZoomCharts #DataDNA.
🚨 Just dropped my #dataDNA submission!.Exploring patient care, billing trends & hospital insights using 55.5k records from 10 U.S. hospitals. Built in #PowerBI Thanks @ZoomCharts @Onyxdata.#DataAnalytics #healthcare #DataViz.@omoalhajaabiola @_DeraIJ @AramideOyekunle

0
0
6
We're hosting data challenges for Power BI report creators and loving the amazing report submissions! It's great to see powerful use cases and real-time data analysis with ZoomCharts Drill Down PRO visuals in action 🚀.

Completed this in 3 hours just to meet up with the deadline of the project. it is an inventory management analysis where I did analysis on the pricing, supplier and restocking and category demographics. #PowerBi #Datafam #DataAnalytics


0
0
7
We are LIVE soon! Join the free workshop to learn how to visualize the healthcare dataset in Power BI! ⚕️📈

0
0
7