
World Climate Service
@WorldClimateSvc
Followers
8,643
Following
994
Media
1,114
Statuses
2,053
Insight and tools for long-range forecasting: objective seasonal and subseasonal prediction. Tweets by Prescient Weather cofounder Richard James, PhD
State College, PA
Joined January 2018
Don't wanna be here?
Send us removal request.
Explore trending content on Musk Viewer
#Eurovision2024
• 1443880 Tweets
América
• 499930 Tweets
#母の日
• 178533 Tweets
#MothersDay
• 79192 Tweets
ヴィクトリアマイル
• 69792 Tweets
ストフェス
• 34224 Tweets
Pachuca
• 33408 Tweets
Tatum
• 32866 Tweets
Barco
• 31953 Tweets
カーネーション
• 31647 Tweets
Chivas
• 29422 Tweets
Newwiee Honey Teerak🩷
• 27193 Tweets
Roger Corman
• 24228 Tweets
Saint MSG Insan
• 24216 Tweets
Igor
• 24081 Tweets
カグヤ様
• 20636 Tweets
ティアキン
• 16434 Tweets
Garland
• 16287 Tweets
ナミュール
• 15785 Tweets
Buckley
• 11944 Tweets
Derrick Lewis
• 11770 Tweets
Toluca
• 11740 Tweets
Hannibal Lecter
• 10997 Tweets


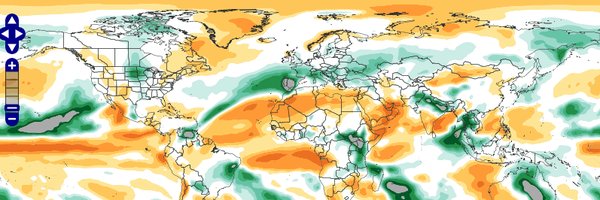
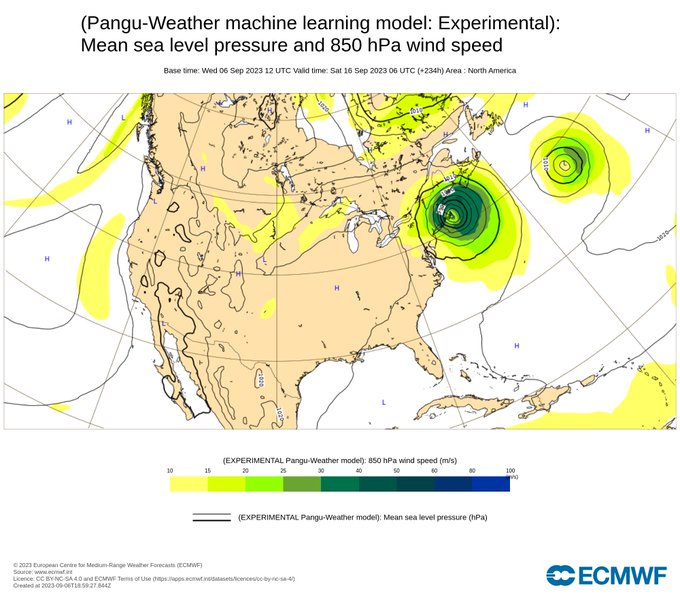
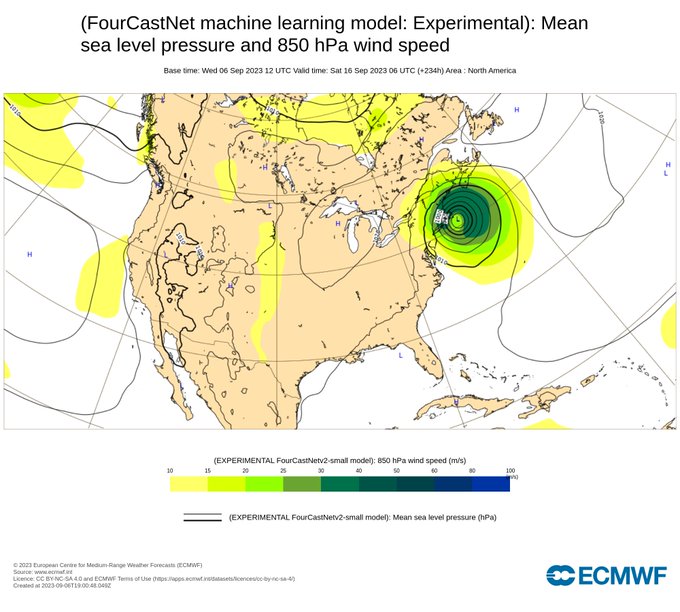
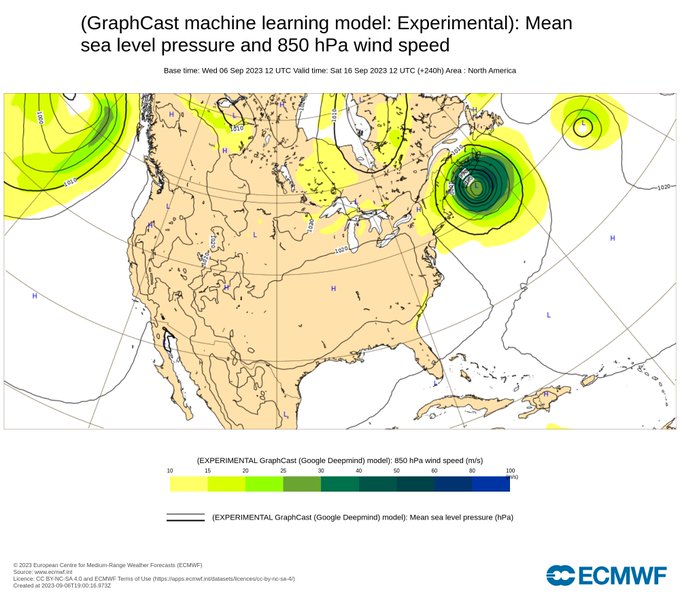
All three of the latest
@ECMWF
#MachineLearning
forecasts are showing
#HurricaneLee
perilously close to the North American coastline 10 days from now.
This is going to be a *very* interesting real-time test of the new technology.
26
124
497
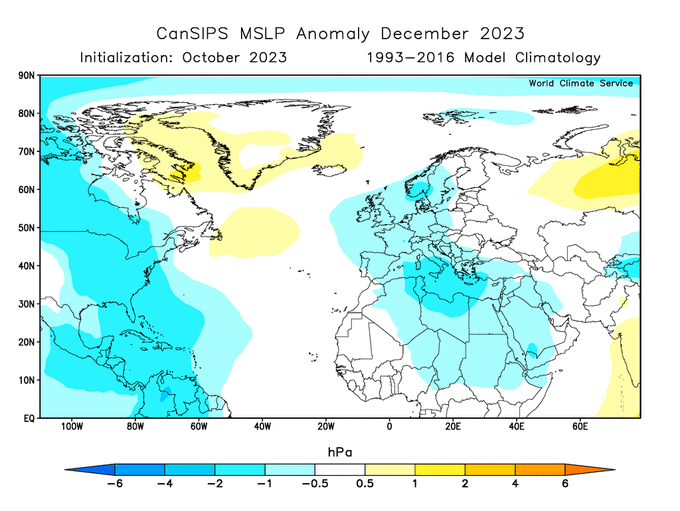
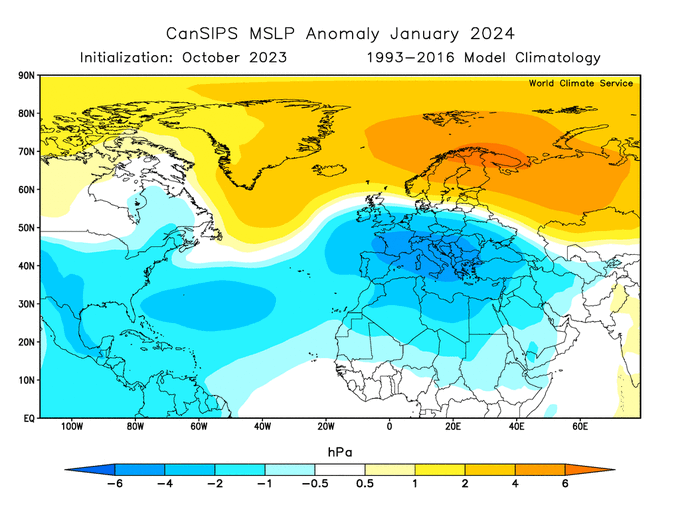
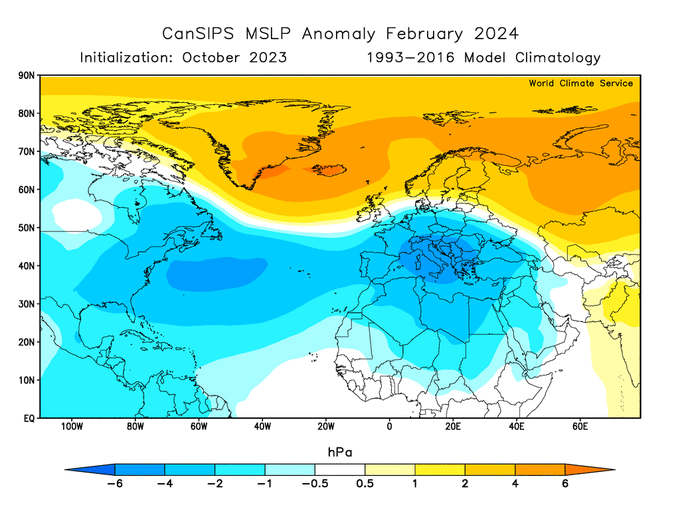
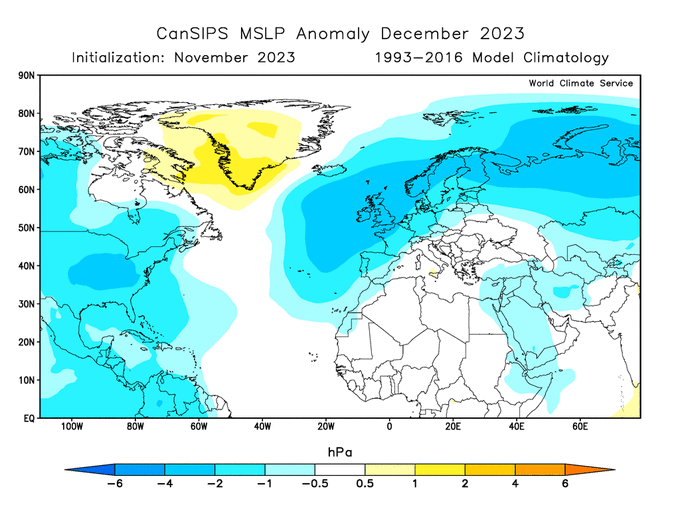
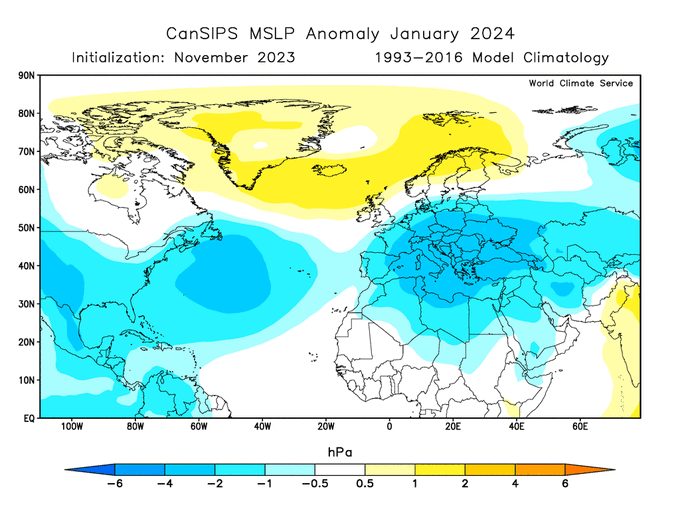
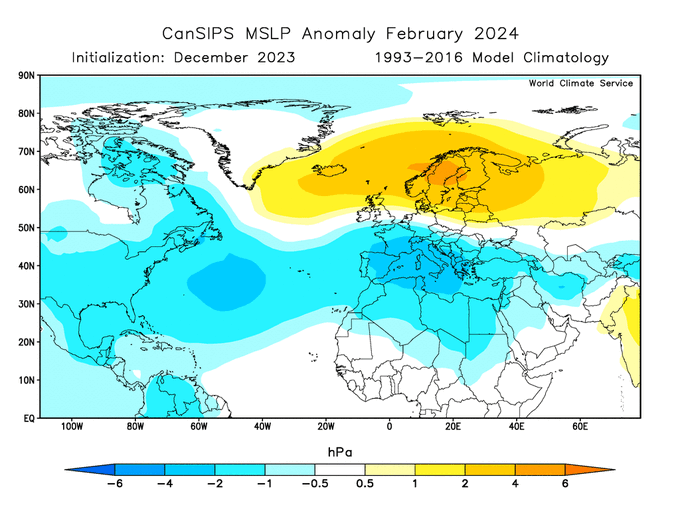
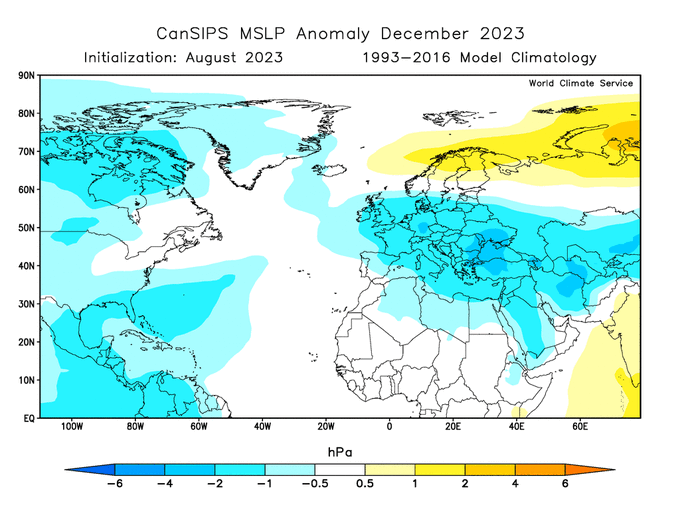
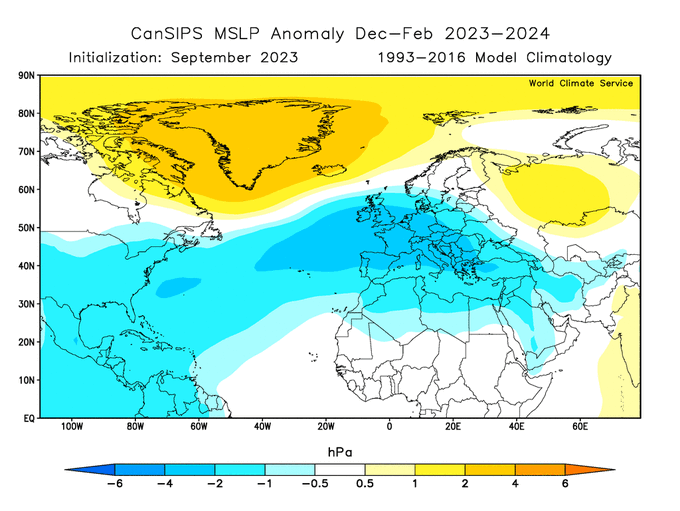
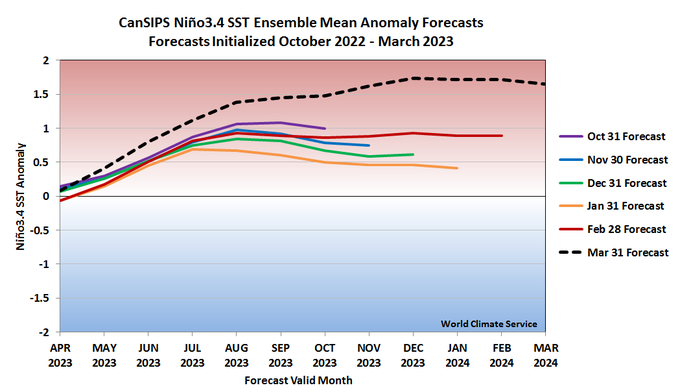
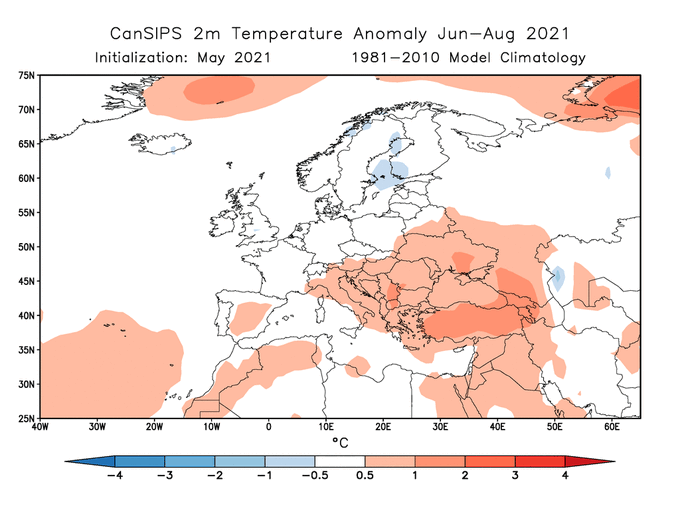
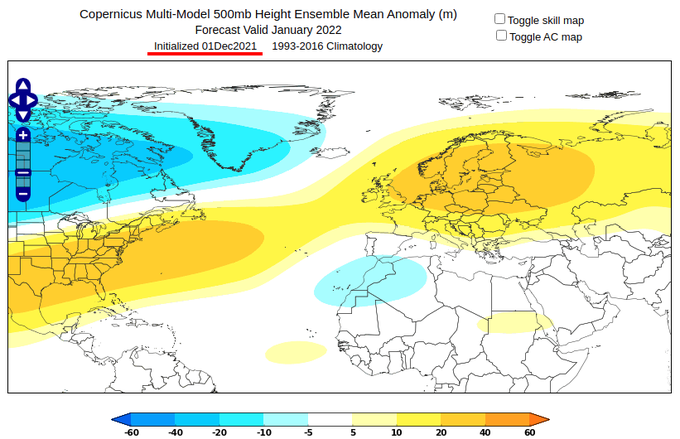
The latest CanSIPS loses most of the Greenland blocking signal for December, but keeps a strongly blocked pattern for Jan-Feb.
The ensemble size of 20 members (combined from the two CanSIPS models) is not as good as most seasonal models, but still - an impressive signal.
11
54
264
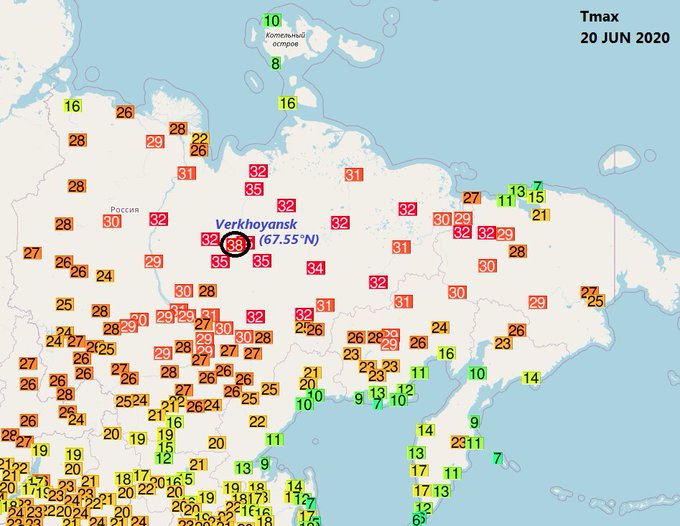
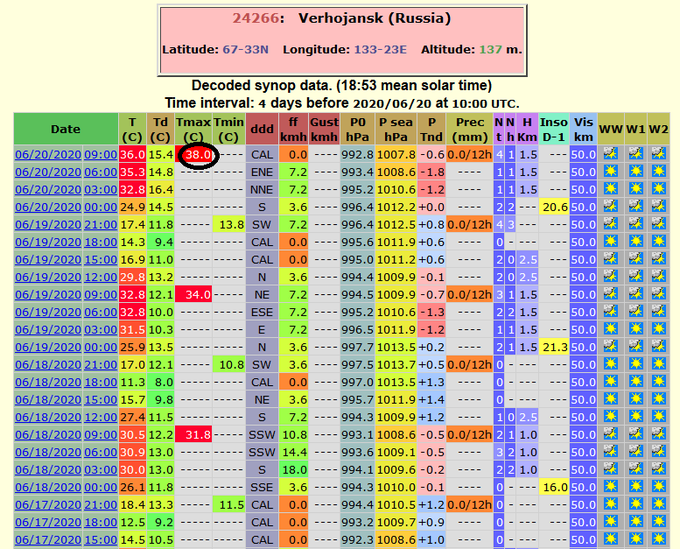
Preliminary all-time record of 38.0°C (100.4°F) at Verkhoyansk in Siberia, and a contender for hottest on record within the Arctic Circle. The existing record is, I believe, 100°F in 1915 at Fort Yukon, Alaska
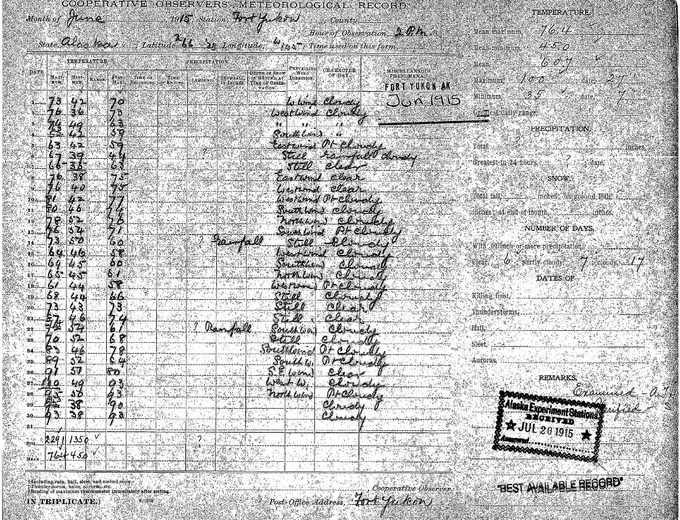

🌡️🔥 T°max de 38.0°C à
#Verkhoyansk
,
#Sib
érie orientale (67.55°N), ce 20 juin.
Si cette valeur est correcte, ce serait non seulement un record absolu à la station (37.3°C, 25/07/1988) mais aussi la température la plus élevée jamais observée au nord du cercle polaire
#arctique
!
21
515
522
4
175
251
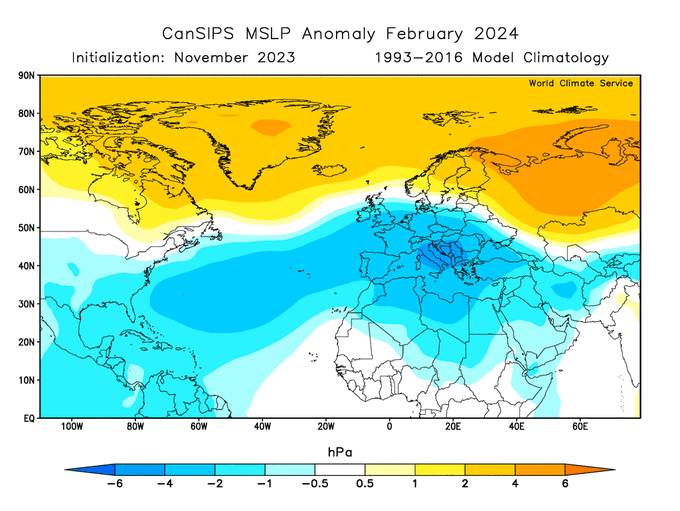
CanSIPS data is finally in... the latest update again pushes back the Greenland-Scandinavia blocking, now only a strong signal for February. December very unsettled for W+N Europe.
12
44
258
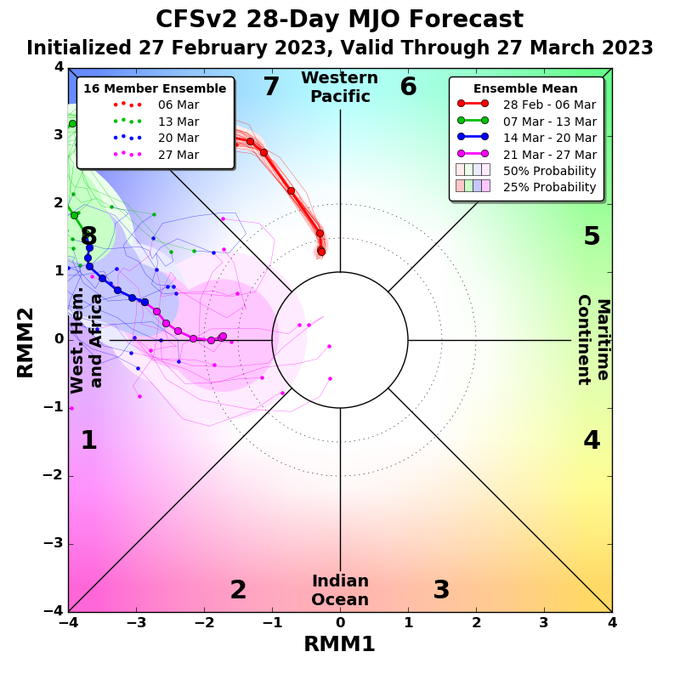
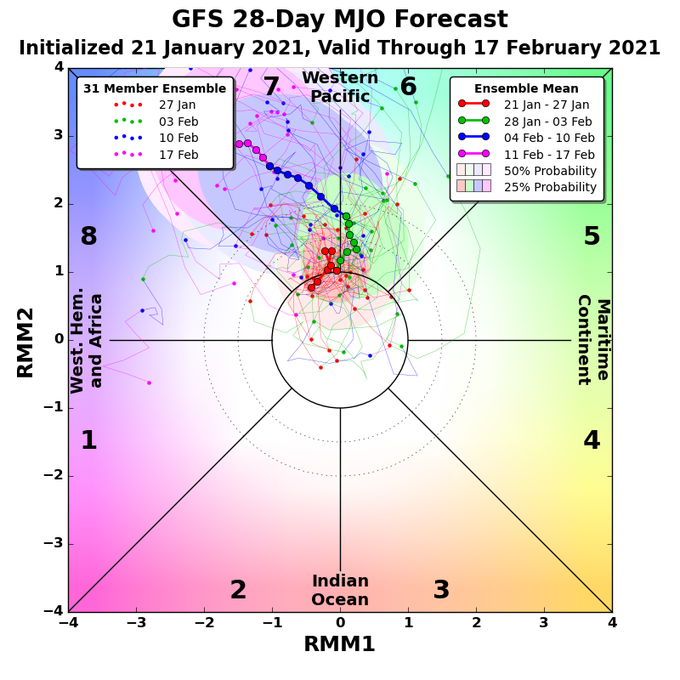
The latest CFSv2 MJO forecast is literally off the chart! This is easily the strongest CFSv2 phase 8 signal in recent years (data since 2015).
As for the real world, the most negative RMM1 index on record (BOM data) was -3.5 in March 1997 (we know what happened next).
11
54
230
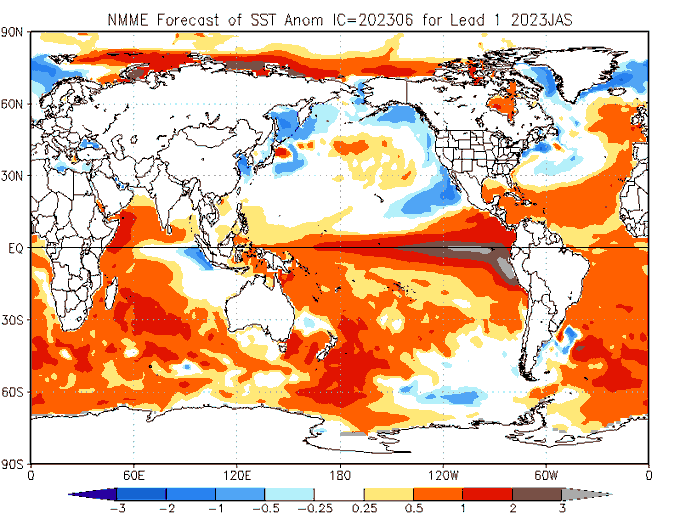
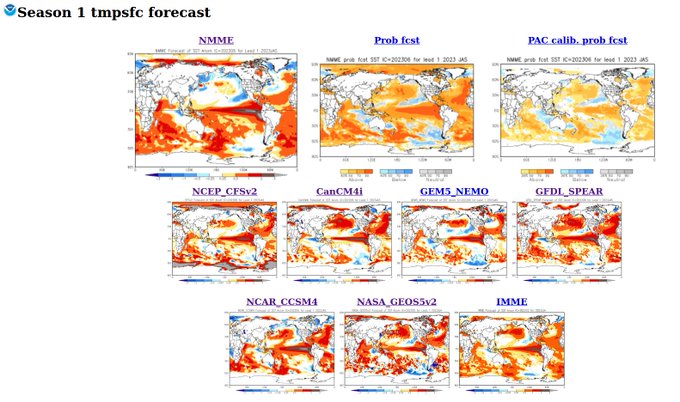
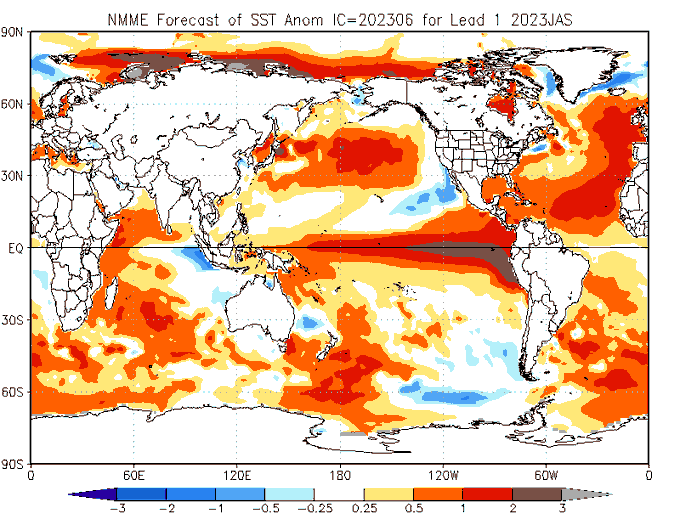
This month's NMME has been fixed. The excessive warmth is back.
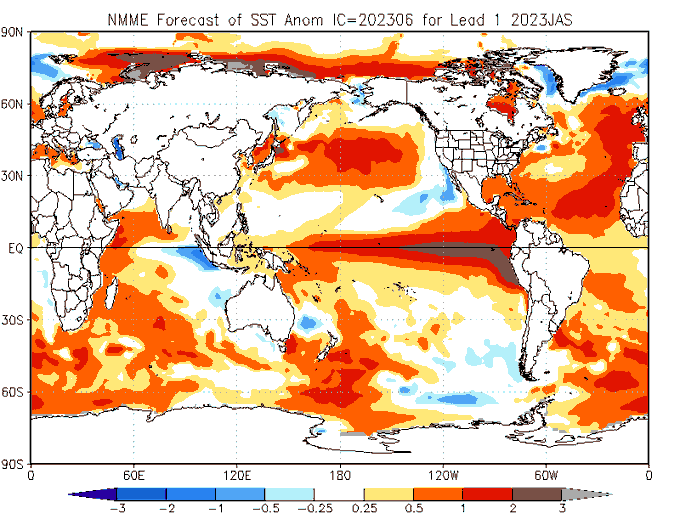
Something's amiss with the just-released NMME forecast - the multi-model SSTs are cooler than any of the component models across the North Pacific. The central N Pacific (and east Atlantic) should be much warmer.
4
13
70
4
59
210
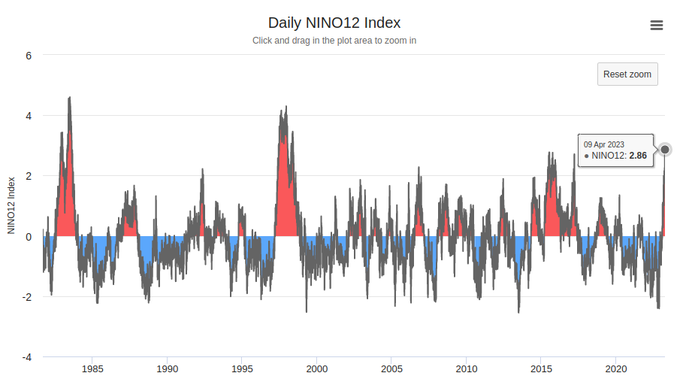
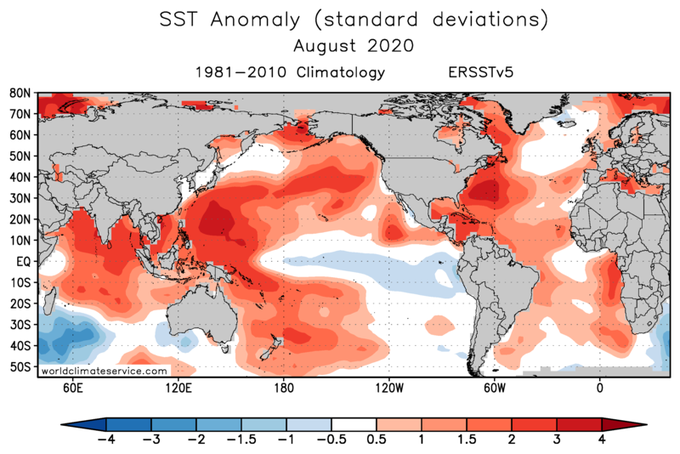
Remarkably, the eastern equatorial Niño1+2 SST anomaly is already approaching +3°C, a degree of warmth only seen in the strongest El Niño episodes of recent decades.
On a monthly basis, Niño1+2 exceeded +2.5°C in 1982-83, 1997-98, and July 2015.
(OISSTv2.1, ERSSTv5 data)
9
95
214
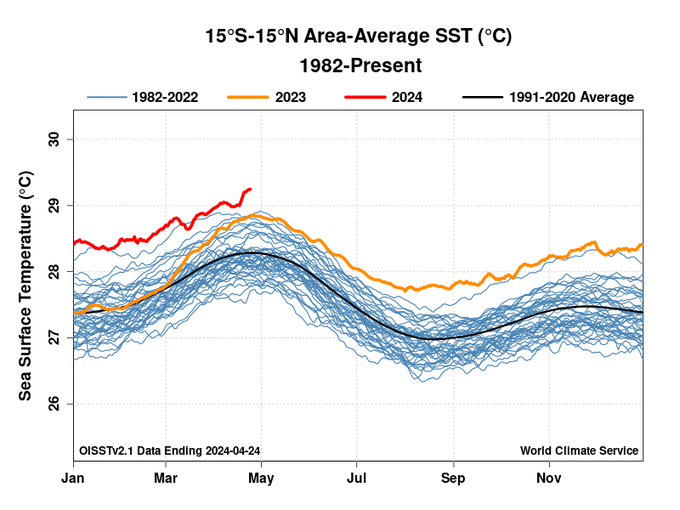
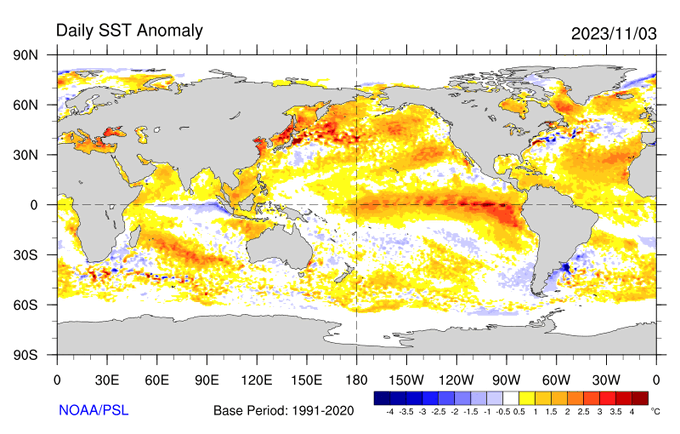
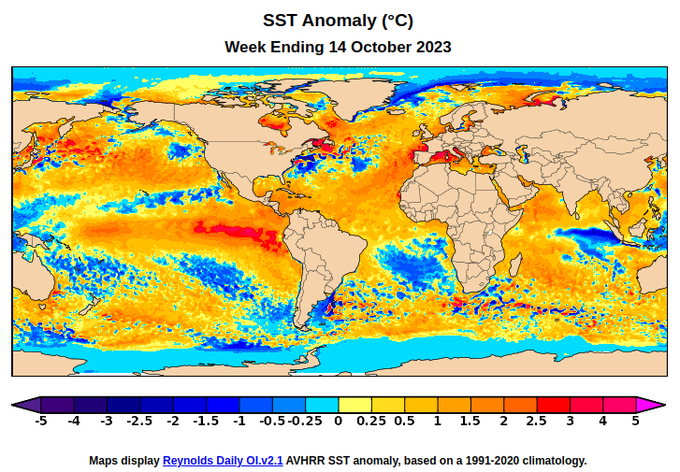
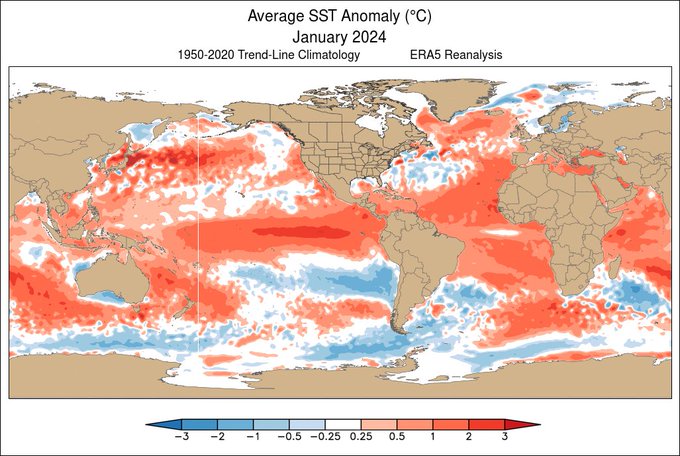
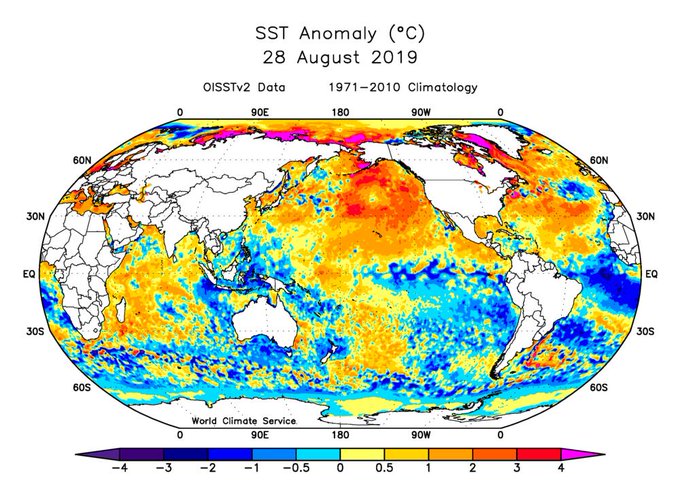
El Niño is ending, but near-equatorial SSTs around the globe aren't cooling off yet: still warmer than last year, and record high for the satellite era.
The most unusual warmth is now in the Atlantic sector.
5
68
199
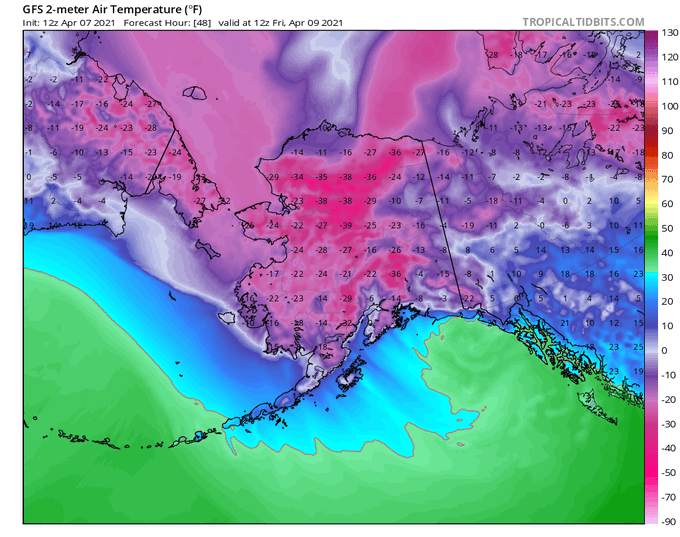
The cold that's inbound to Alaska is truly extreme for the time of year. The NWS forecast of -30°F in Fairbanks would be 47°F below normal, the largest negative anomaly (any time of year) since 1969. -4°F in Anchorage would be 5 std devs below normal.
@AlaskaWx
@Climatologist49
4
75
187
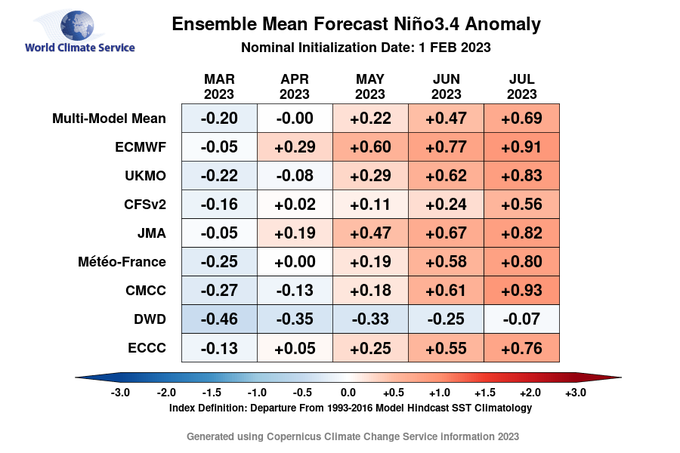
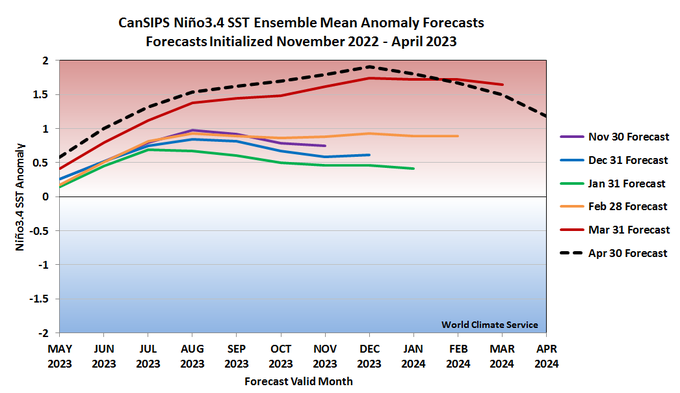
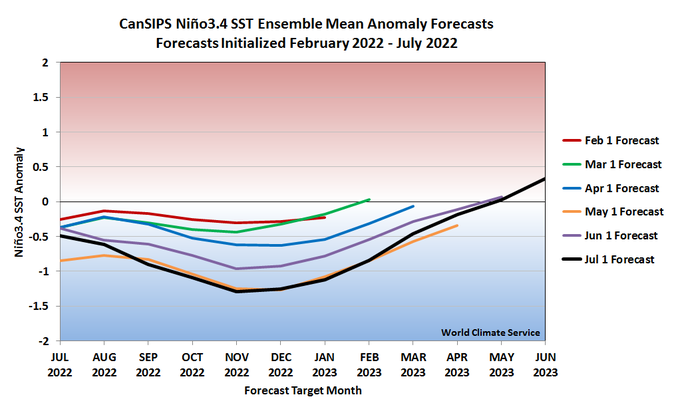
El Niño by summer? The CFSv2 has backed off considerably in the last two months. It's not surprising, as January-initialized forecasts are the worst of all forecasts at a 6-month lead time (due to the spring predictability "barrier"). Uncertainty remains high for now.
12
64
186
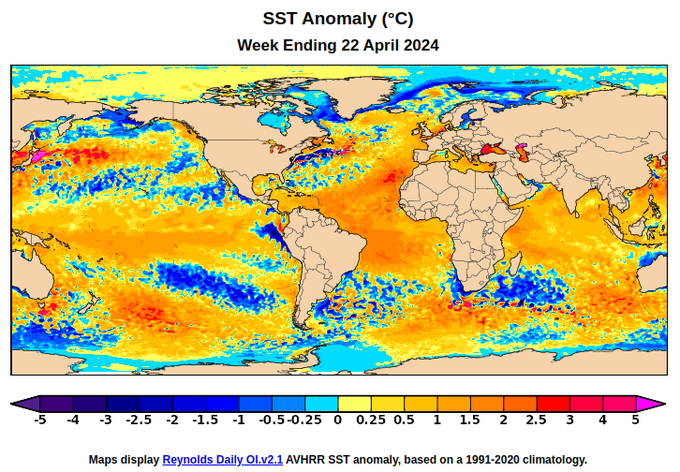
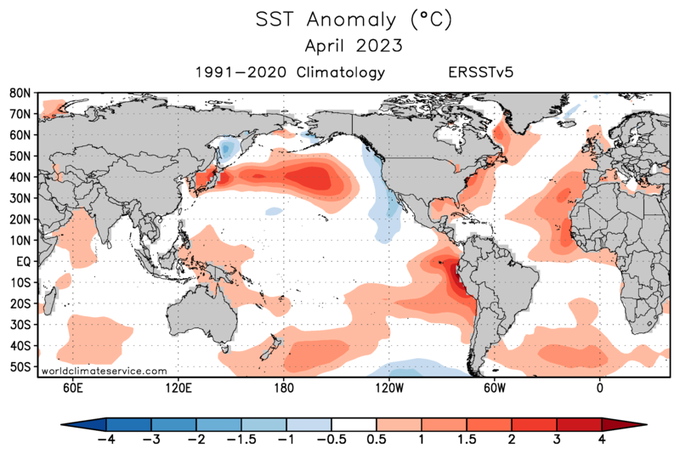
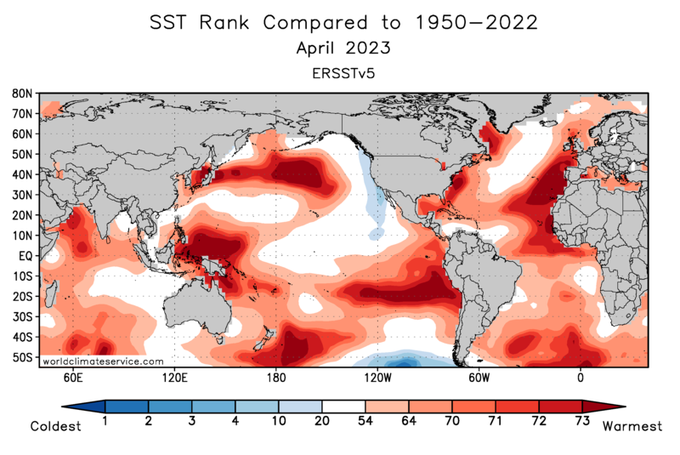
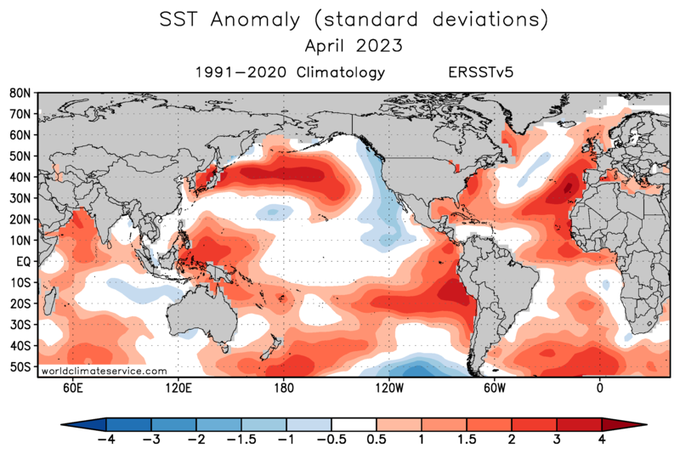
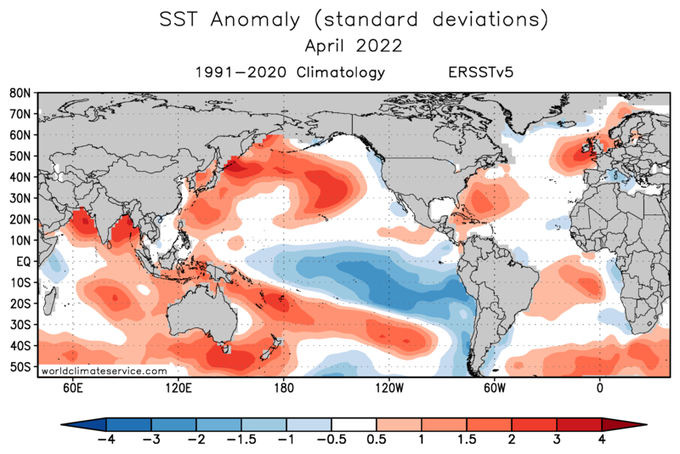
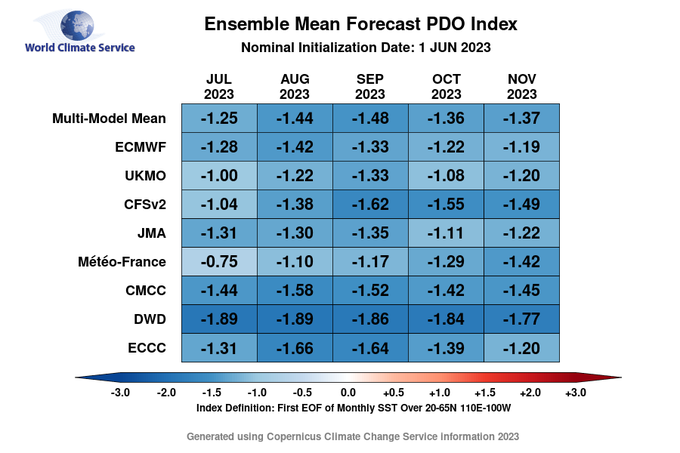
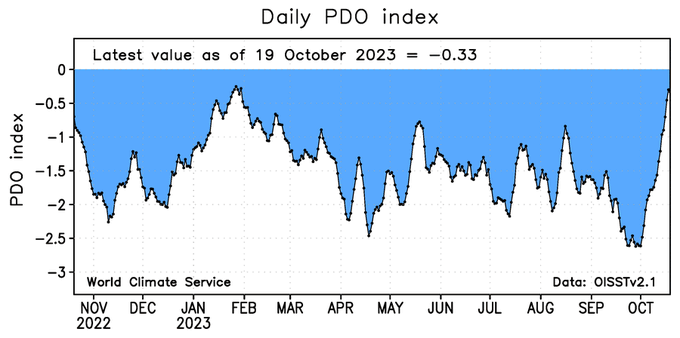
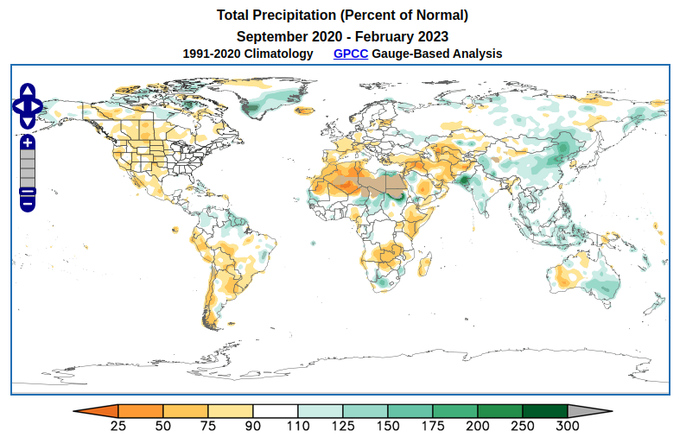
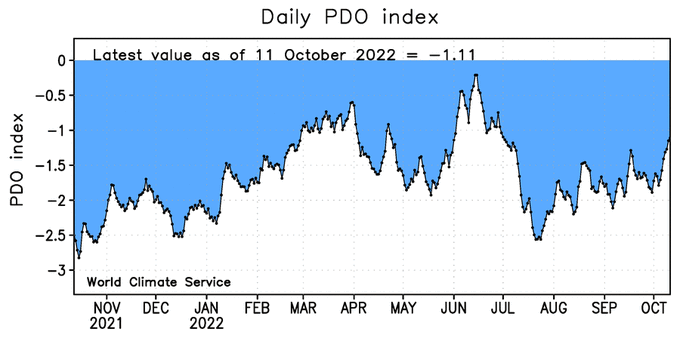
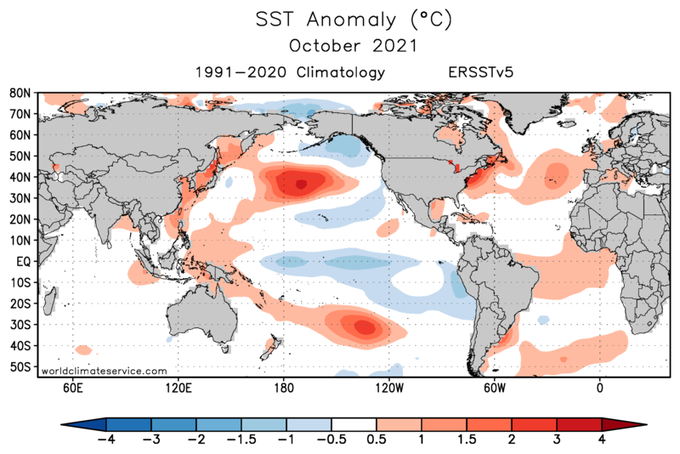
April SST data shows the emerging El Niño signal near Peru. At the same time, the PDO index of -1.9 is the lowest for any spring month since 1956. This contrast is very striking and unusual.
In the Atlantic, SSTs to the W of Morocco are record warm and 3-4+ std devs above normal
7
53
180
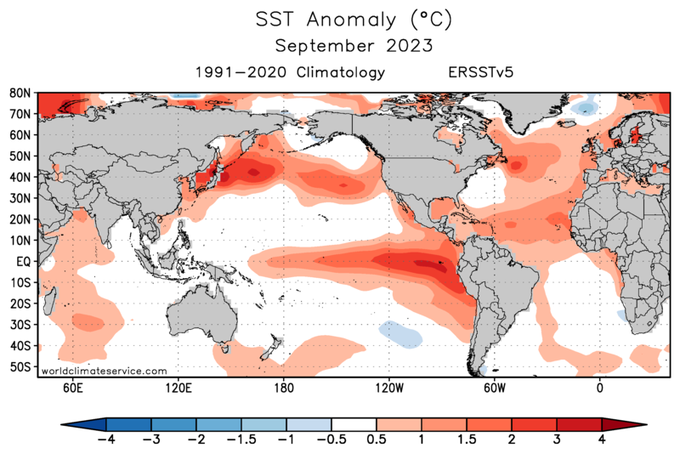
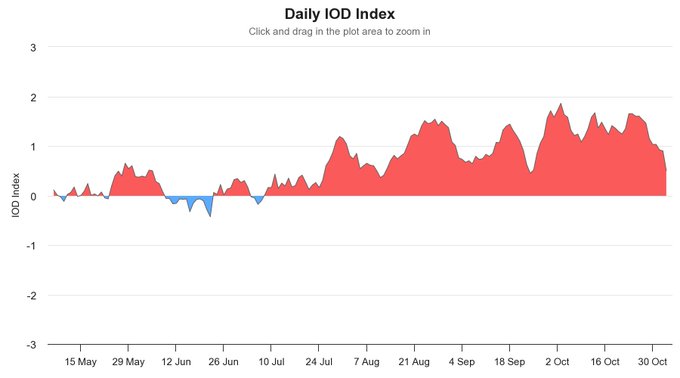
September ENSO/IOD index update (ERSSTv5):
• Niño3.4 +1.6 (4th highest)
• Niño1+2 +2.5 (second only to 1997)
• Niño4 +1.1 (record highest)
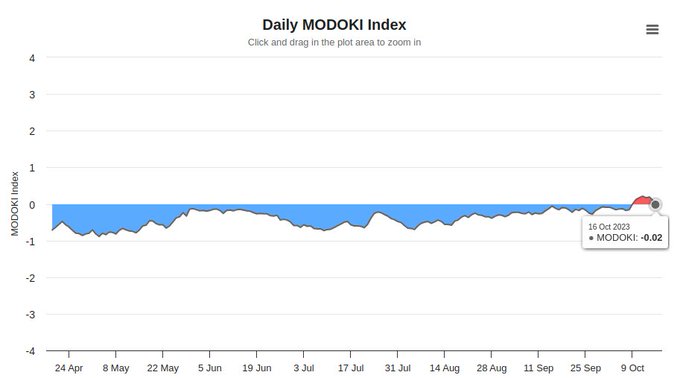
• Modoki Index -0.24 (*not at all Modoki-like yet*)
• ENSO Longitude Index: now 5th highest since 1950
• IOD +2.1 (4th highest)
11
55
175
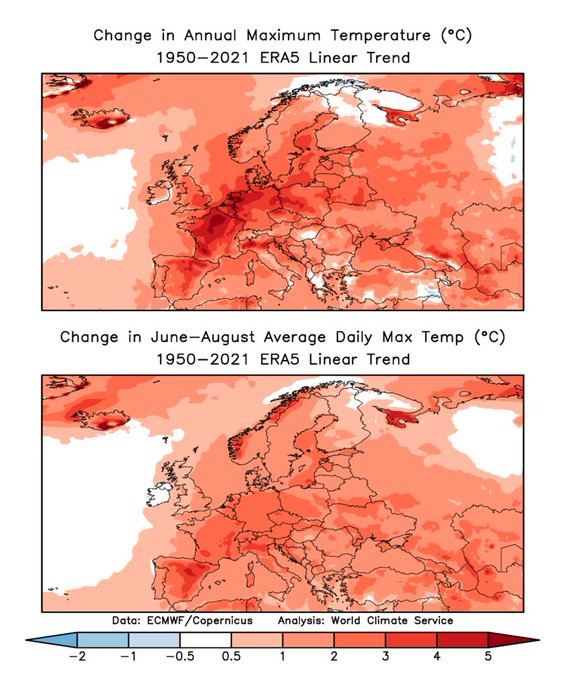
After last week's record heat in the UK, there's interest in whether heat extremes are warming more rapidly than average temperatures. It's a big yes for western Europe: the
@CopernicusECMWF
ERA5 trends are quite astonishing. Blog post on the topic:
8
77
175
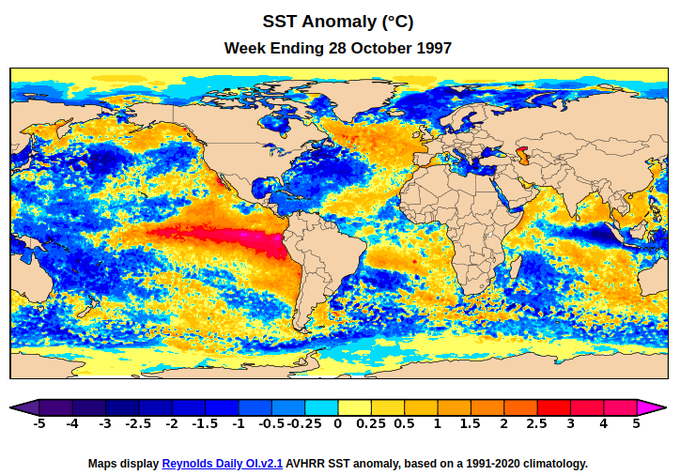
Looking at the Indian Ocean Dipole index, one might think the strongly positive phase has decayed significantly in recent days.
But actually the equatorial easterlies have been so strong that the +IOD cool wedge has made it into the western IOD region. Similar in Oct 1997.
9
41
173
Eastern equatorial Pacific waters recently cooled more than 10°C in one month just below the surface, as the transition towards
#LaNina
gets under way.
Most models expect La Niña to be well established this summer already: one of the more rapid transitions we've seen.
5
67
173
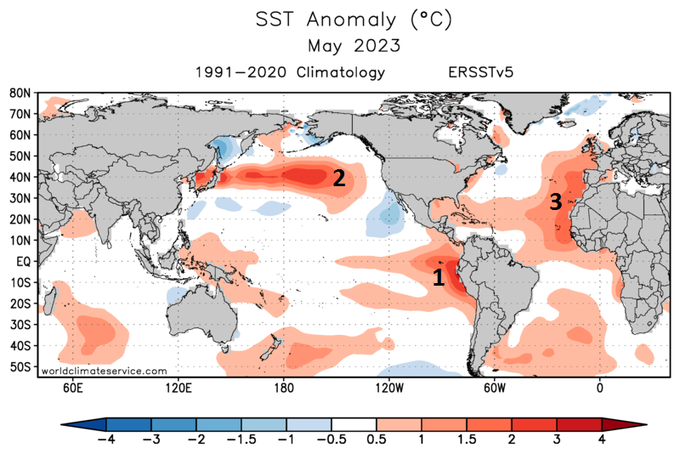
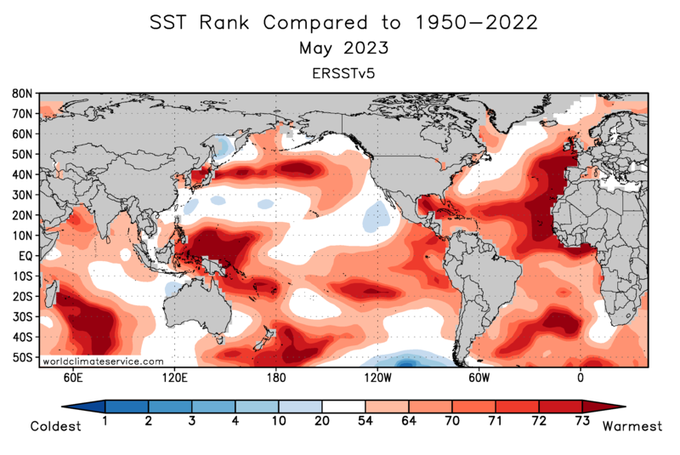
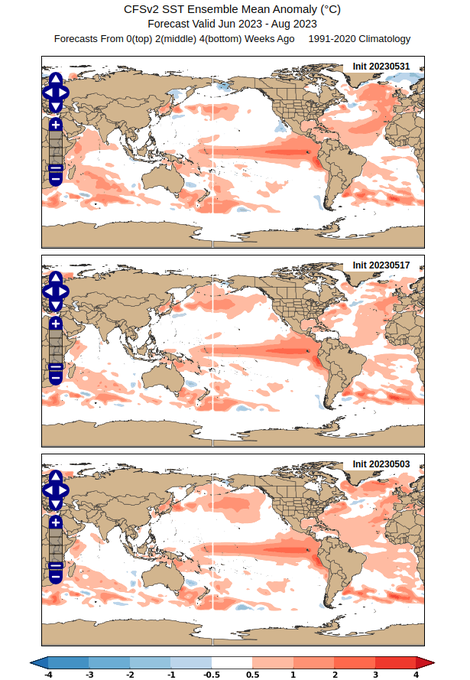
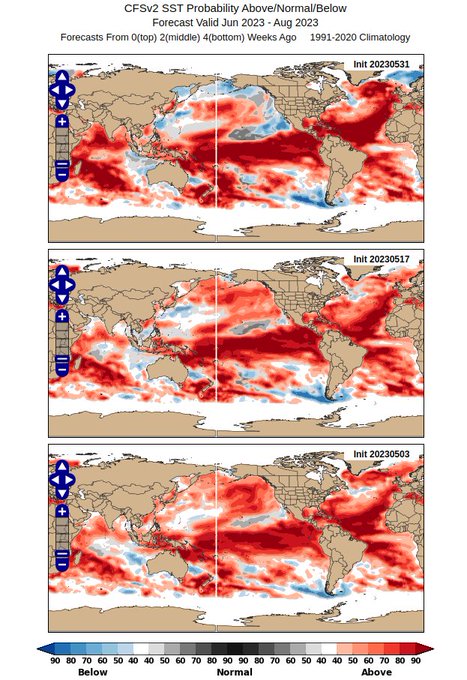
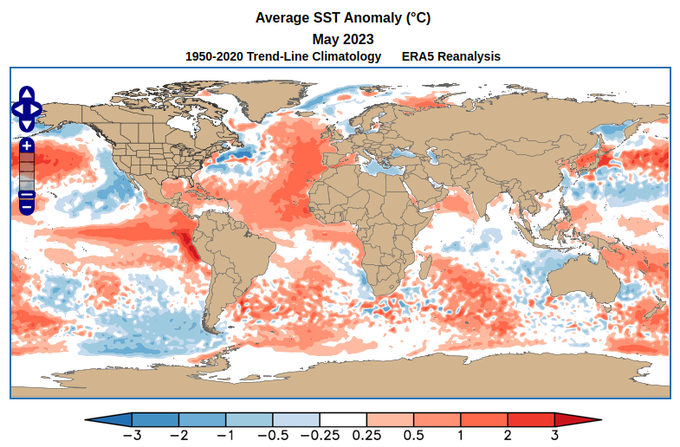
Three notable areas of unusual warmth in the May SST data:
(1) emerging El Niño
(2) mid-latitude N Pacific (negative PDO)
(3) east Atlantic warmth from the tropics to the UK
Number 3 may be the most striking - the area of record (1950-present) warmth is now very large.
9
64
161
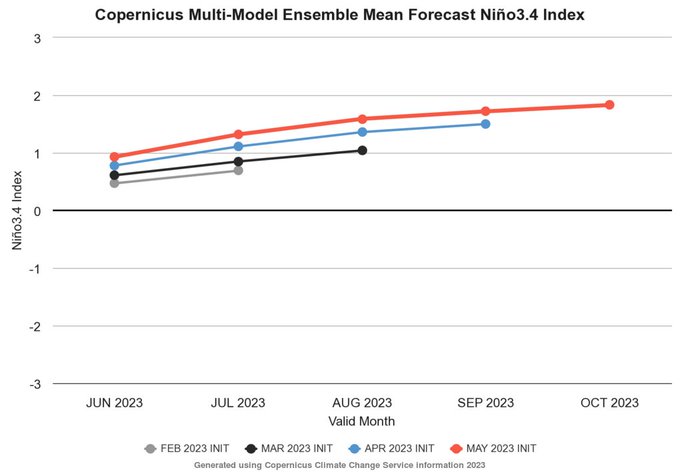
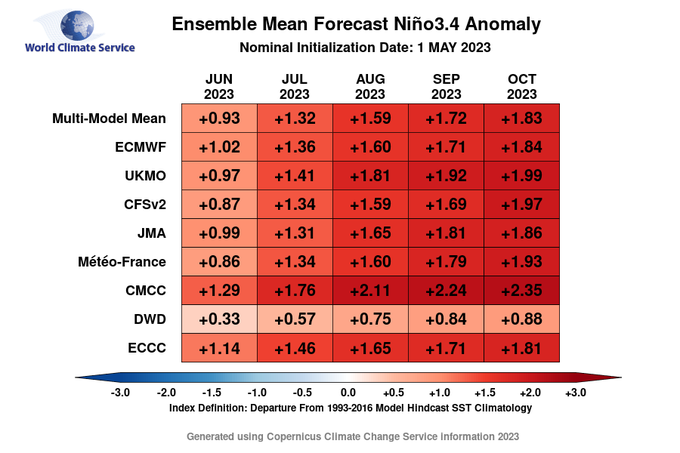
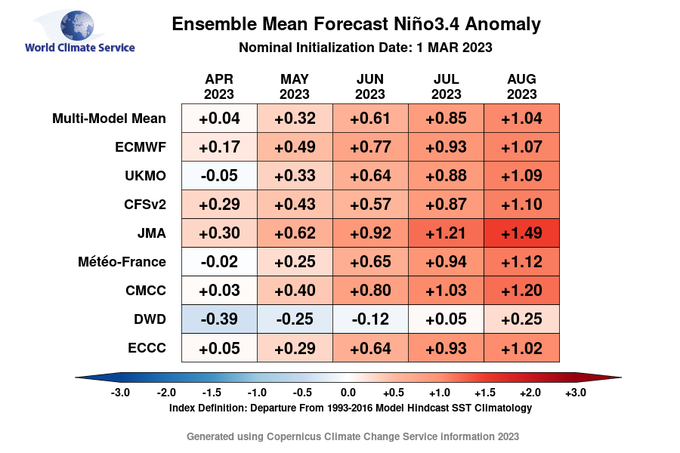
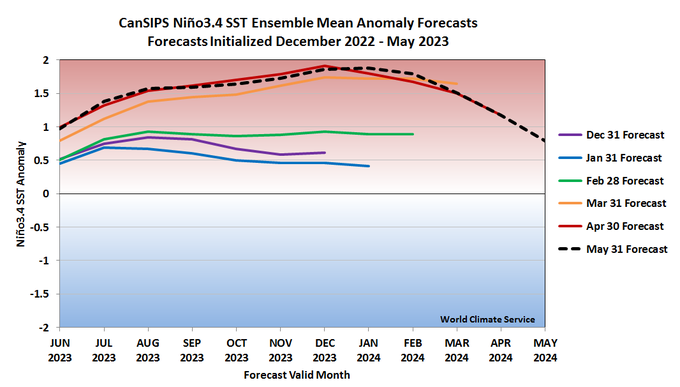
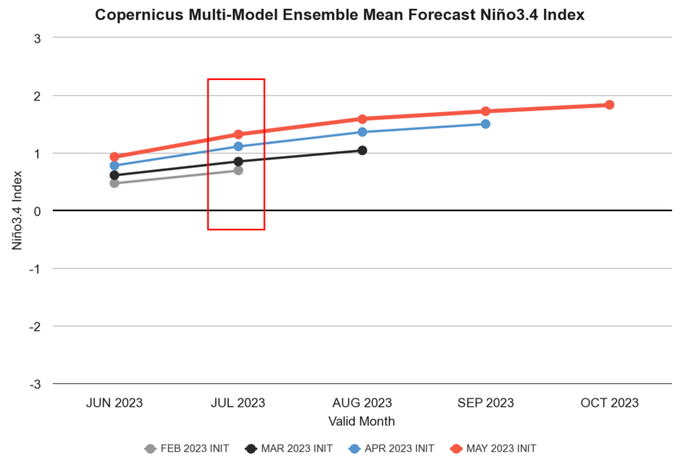
It's really remarkable to see the seasonal models steadily - but dramatically - intensifying their El Niño predictions month after month.
Strong El Niño by August, according to the latest
@CopernicusECMWF
update.
8
53
157
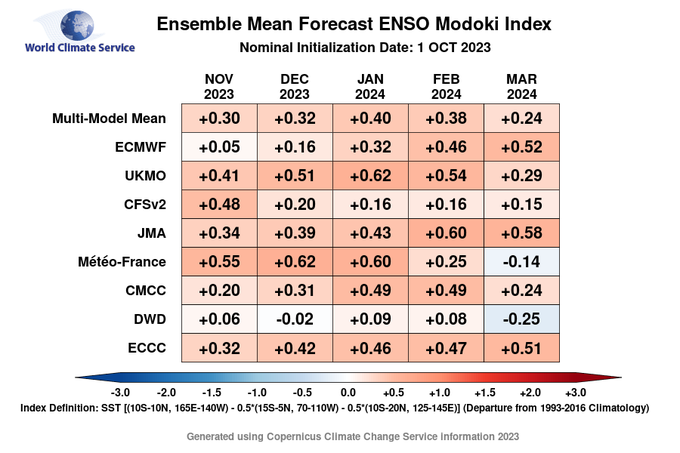
As expected, El Niño is slowly losing its East Pacific focus, with the core warm anomaly shifting west.
Latest forecasts suggest a winter Modoki index similar to 2015/16 (+0.4). That's a fairly typical value, neither strongly east-based (1997/98) nor Modoki-like (2009/10).
7
50
158
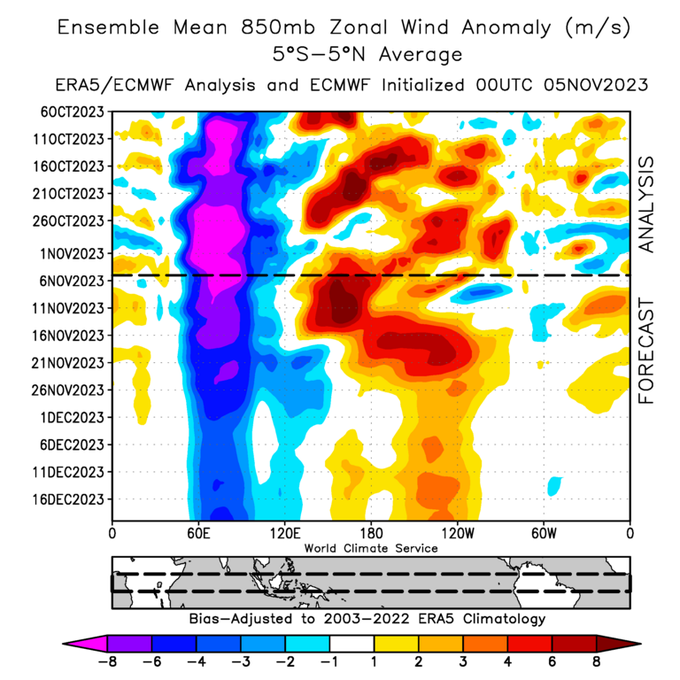
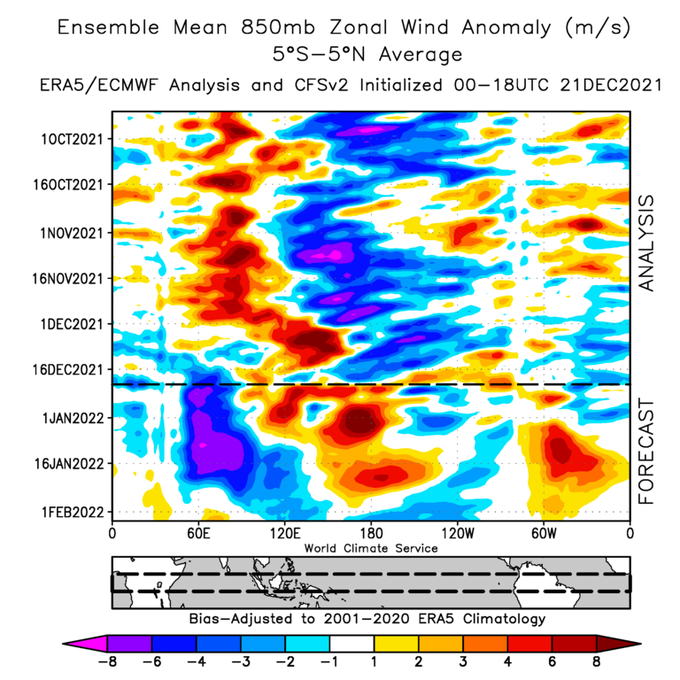
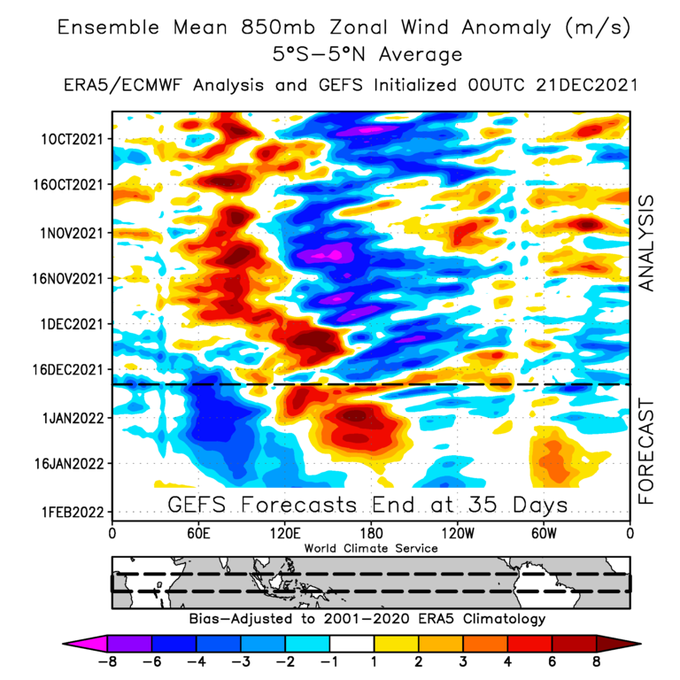
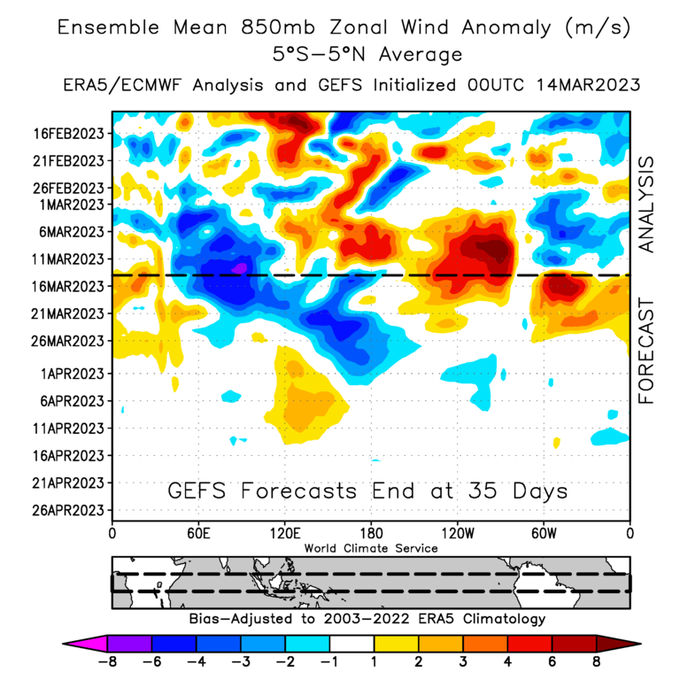
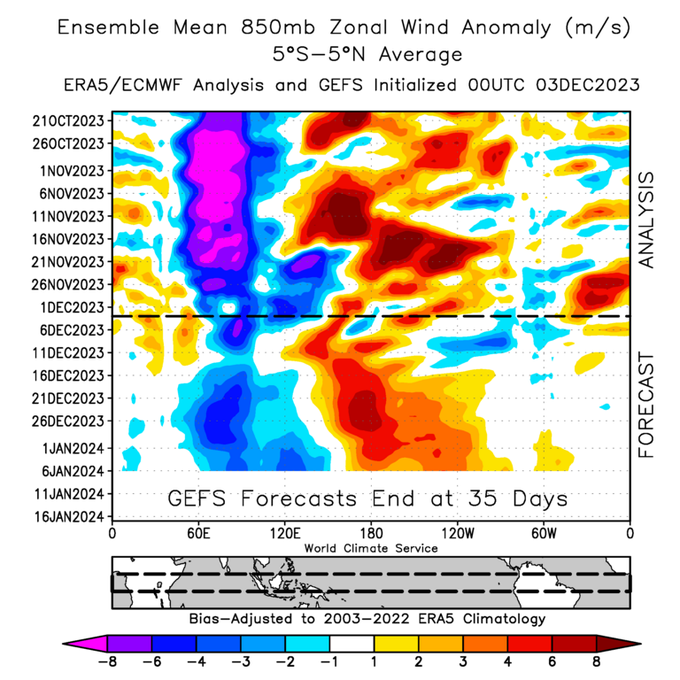
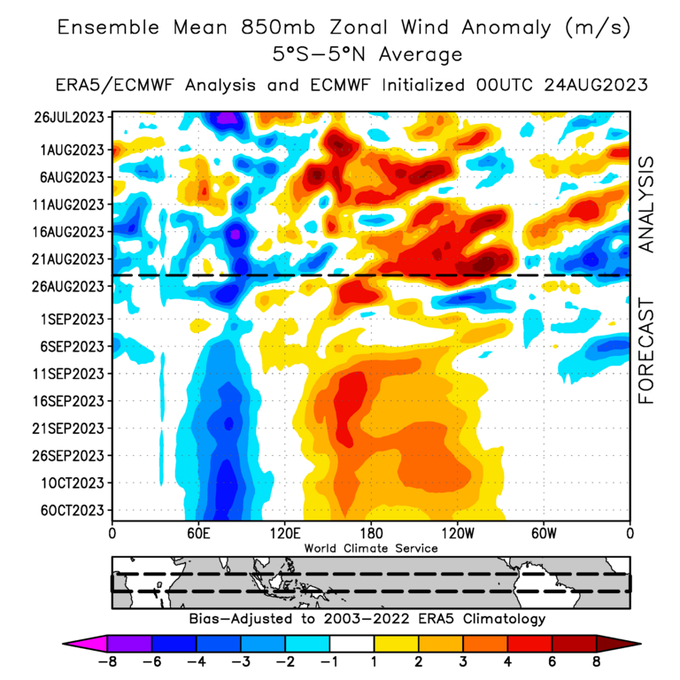
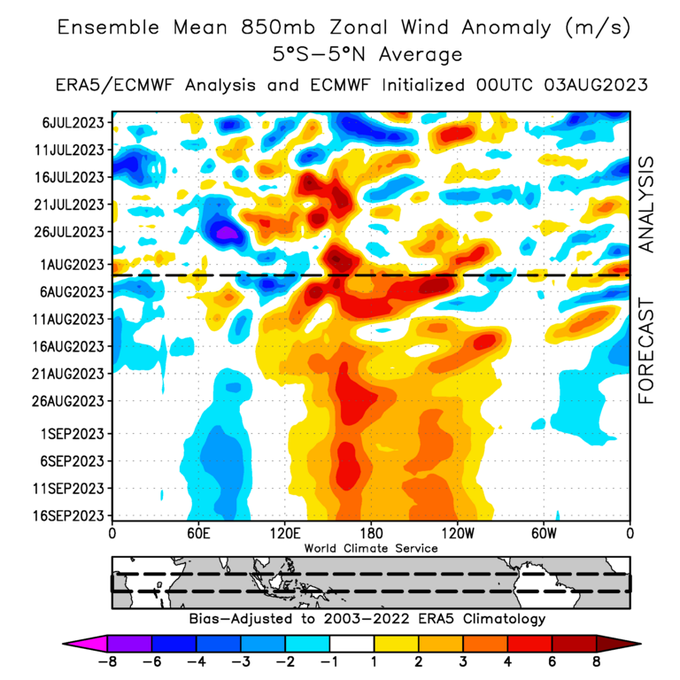
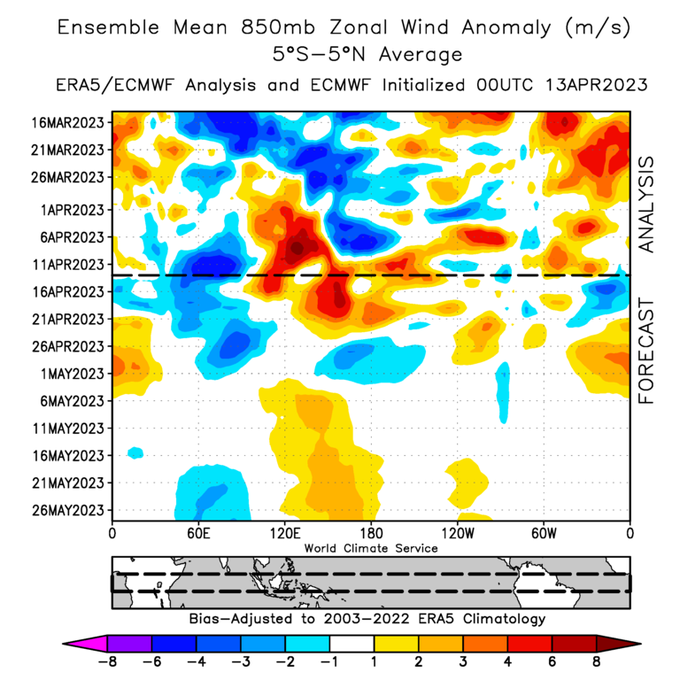
As very strong MJO activity pushes into the central Pacific, we're seeing a wholesale reversal of equatorial 850mb wind anomalies from the earlier quasi-steady La Niña signal. It will take some doing for La Niña to recover from this.
12
35
142
The latest CanSIPS ensemble has the strongest signal yet for La Niña next winter.
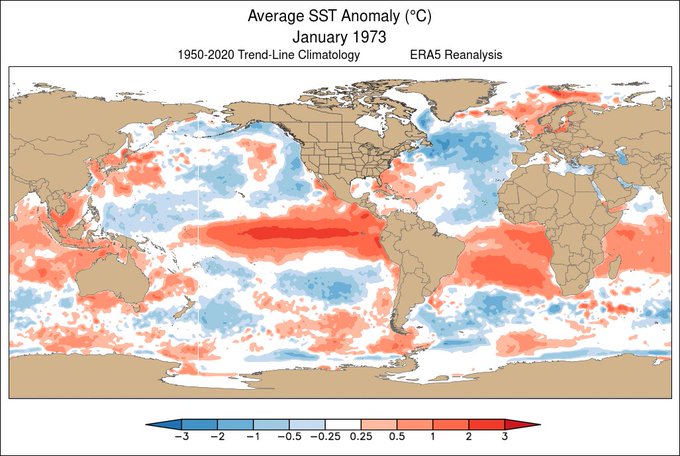
1998 and 1973 are analogs for a flip from strong El Niño to strong La Niña within one year. 1973 is a better Pacific match (-PDO) but the Atlantic was drastically cooler then (-AMO).
4
39
147
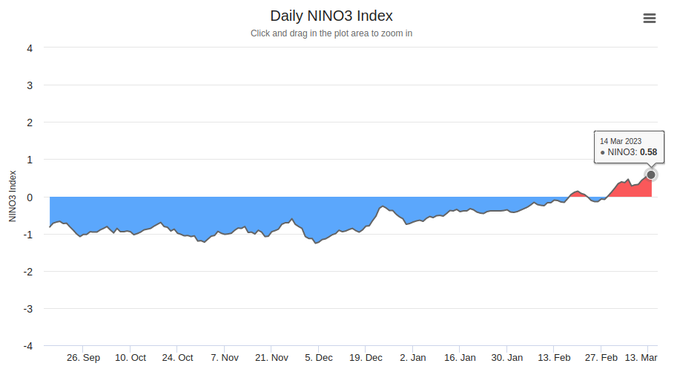
Niño3 (eastern equatorial Pacific) SSTs are already in El Niño territory, exceeding 0.5°C above normal.
Recent warming has been dramatic, caused by westerly winds associated with the record-breaking MJO.
5
50
144
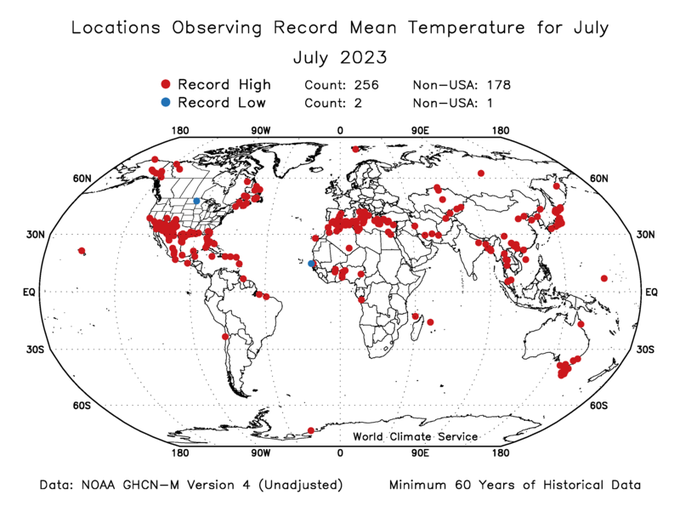
No surprise here, but locations with record high July average temperature were numerous last month, especially around 15-45°N latitude.
4 GHCN-Monthly sites exceeded July records by >2°C, including of course Phoenix airport.
11
62
147
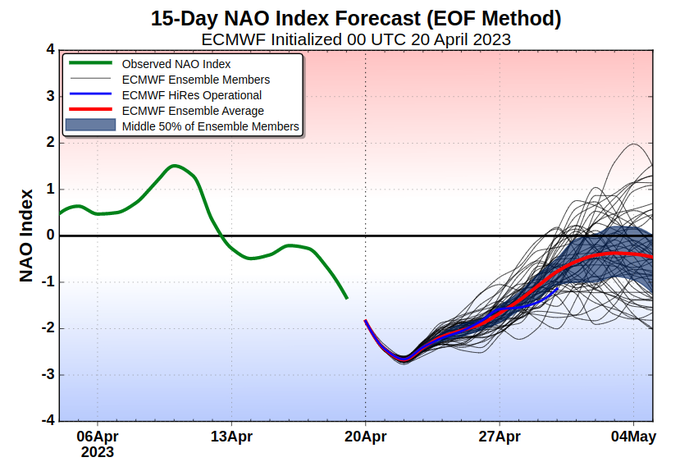
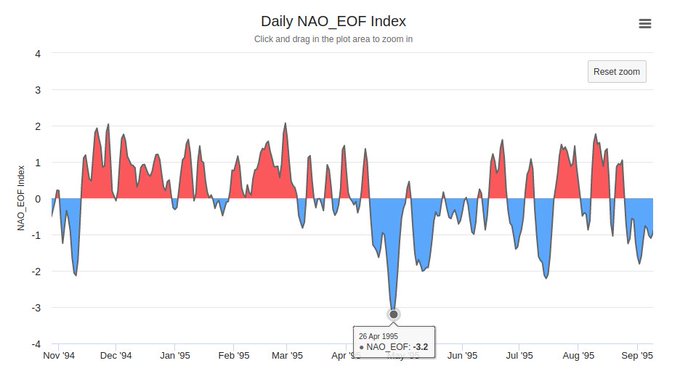
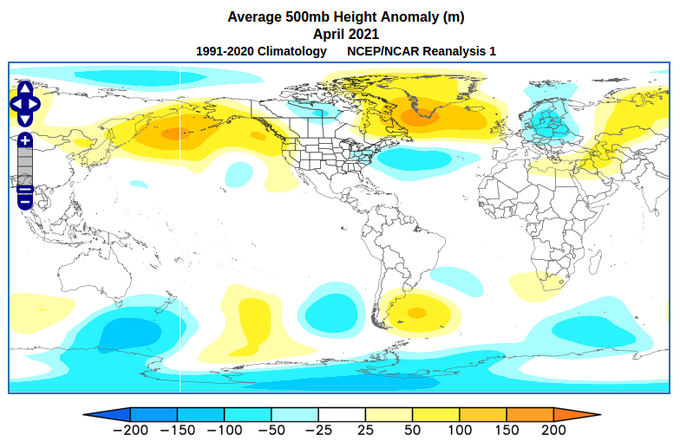
This negative NAO episode will be the second strongest on record for the month of April. Late April 1995 holds the record for most negative (daily) NAO index in April.
7
32
124
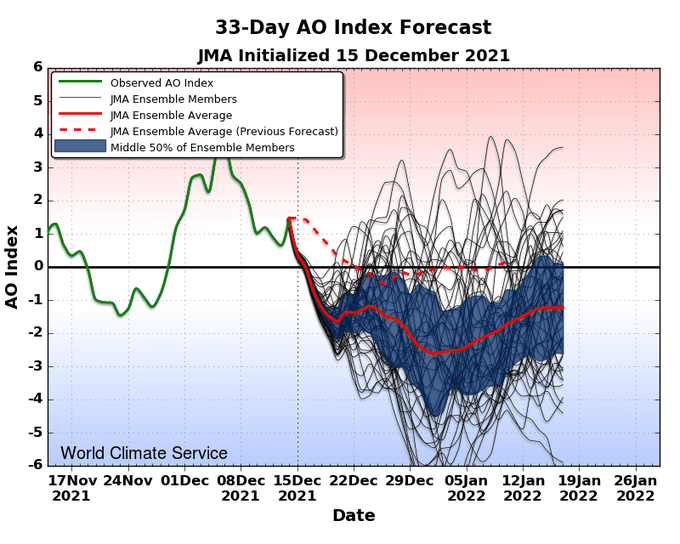
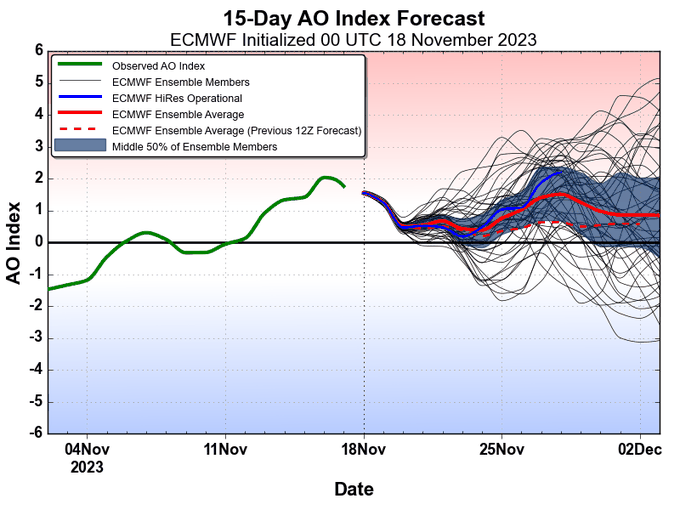
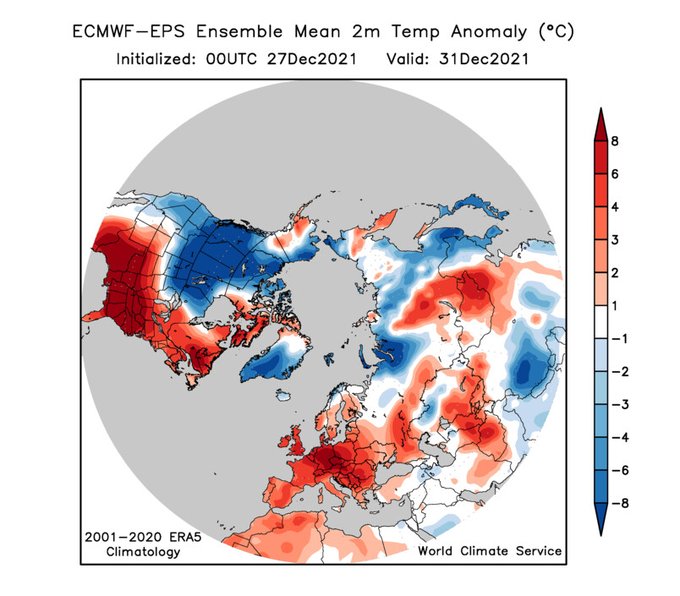
Coast-to-coast U.S. cold leading up to Christmas: an extremely impressive ECMWF ensemble-mean signal at day 14. Big shift towards prolonged -AO blocking in the 12Z run today. Wow!
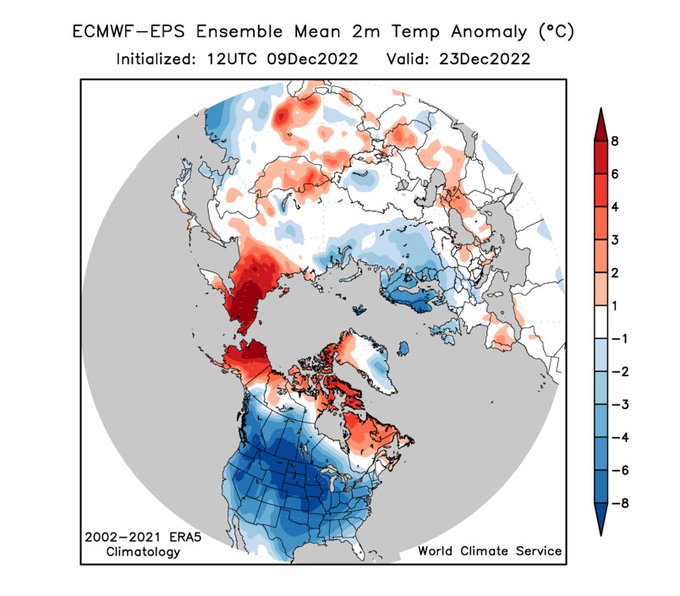
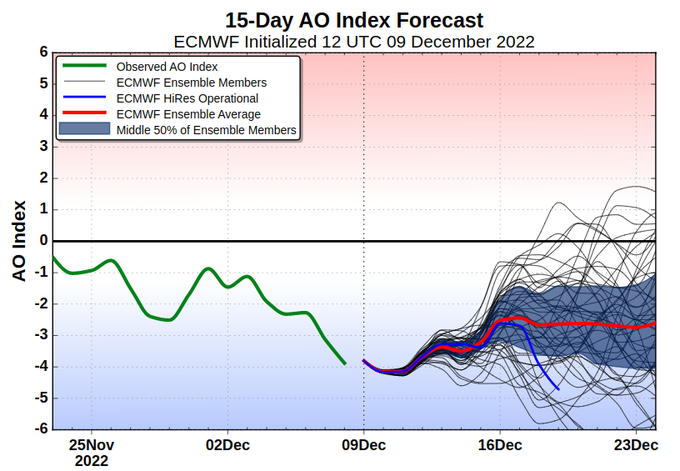
6
27
121
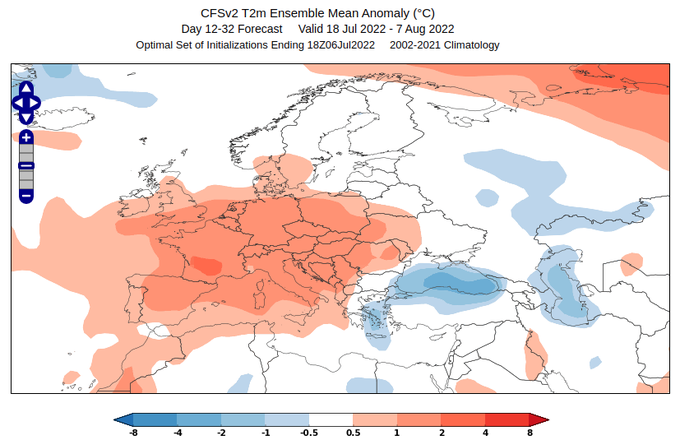
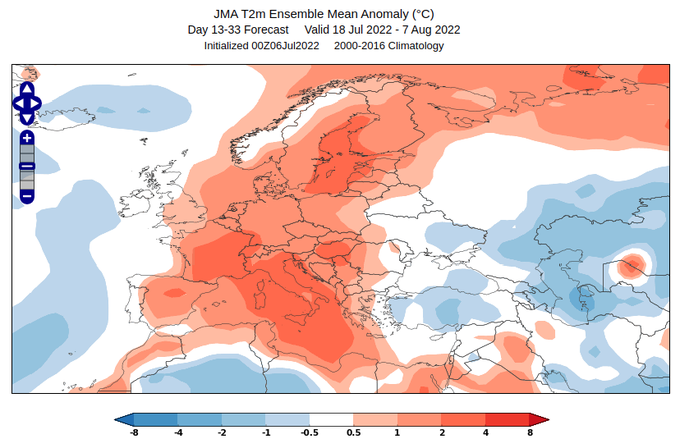
Heat building again across western Europe next week may mark the start of a lengthy and excessive heat wave: the subseasonal models all show heat persisting well into August over a large area. GEFS is particularly extreme, and that's after bias correction/calibration.
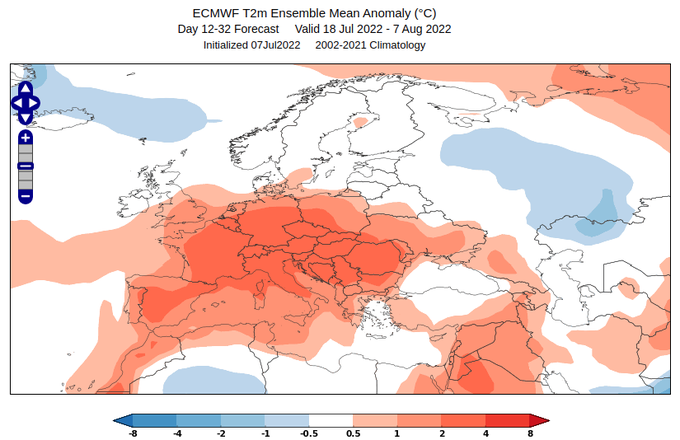
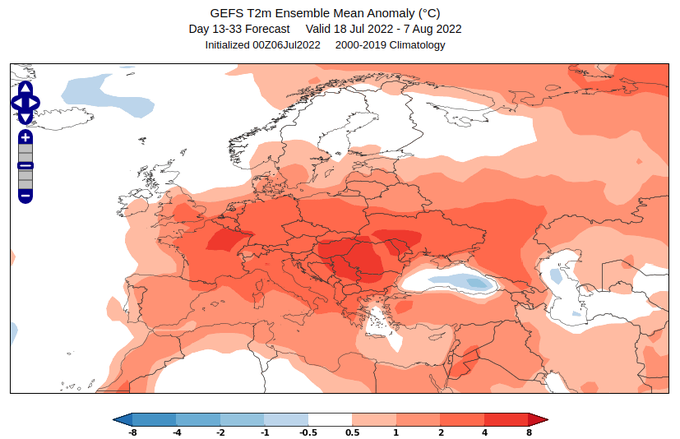
6
54
124
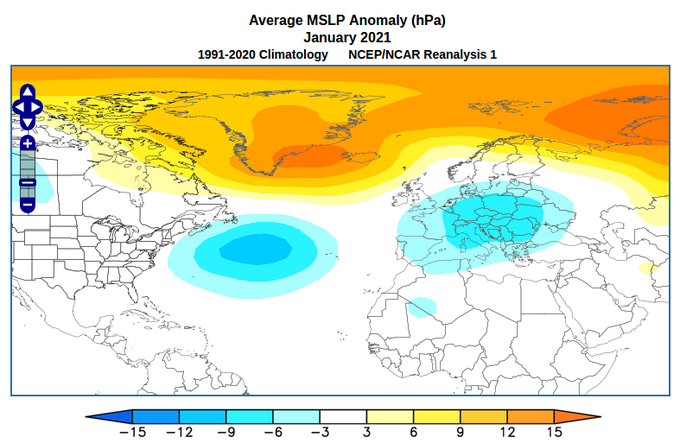
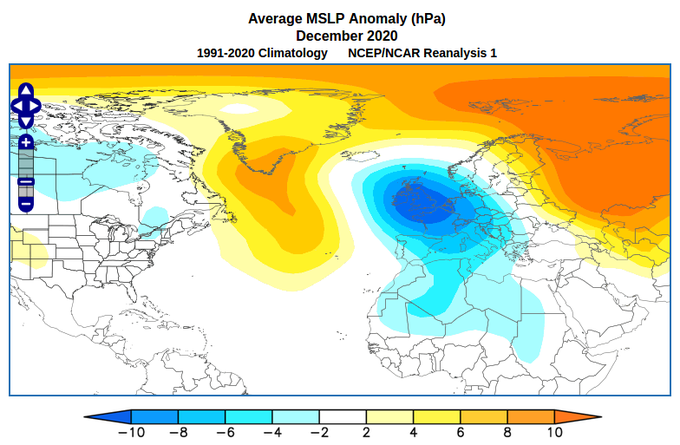
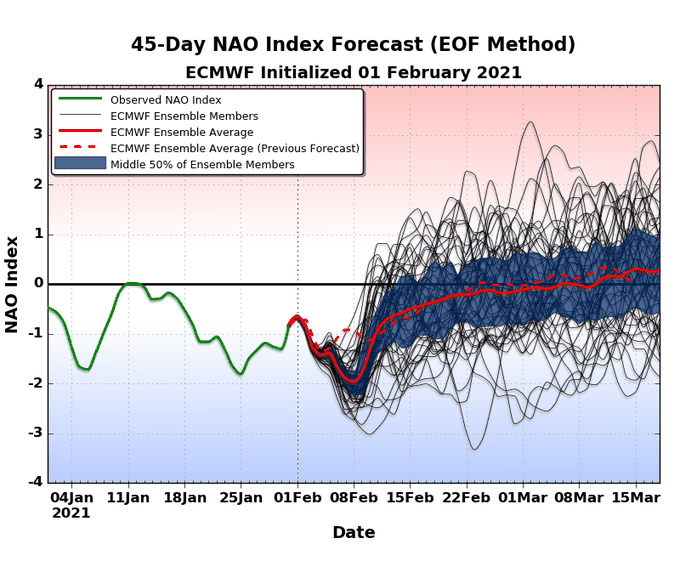
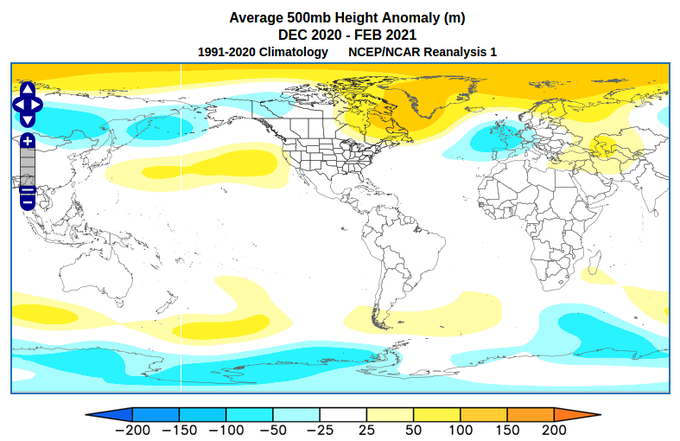
The January NAO index came in at -1.4, the most negative in 11 years. Negative NAO for each of Dec/Jan/Feb is now all but guaranteed, also the first time since 2009-10.
4
34
123
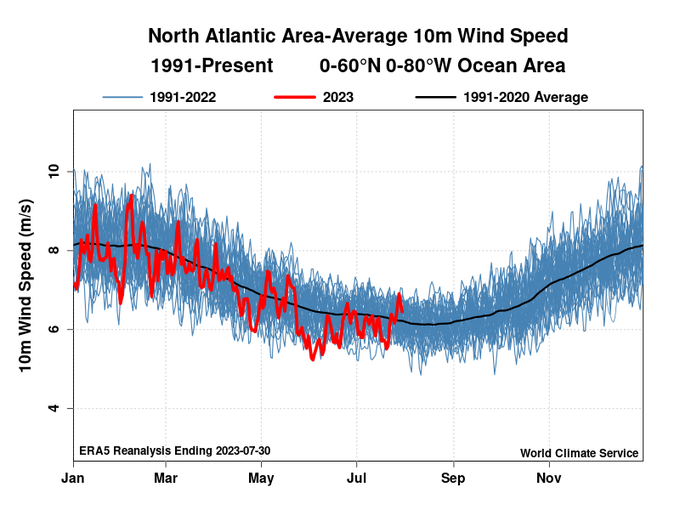
Lots of speculation on causes of the extreme North Atlantic warmth. Reduced aerosols, El Niño, Hunga Tonga...
Here's a more direct explanation: persistently low wind speeds➡️reduced cooling by evaporation.
April-July: lowest basin-average winds since 1995.
More to come on this
15
21
118
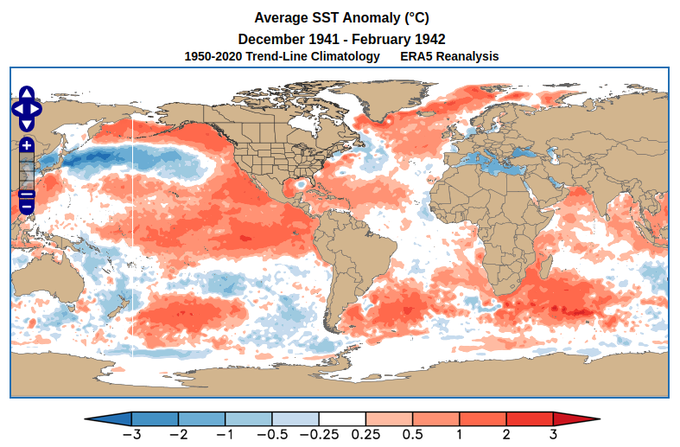
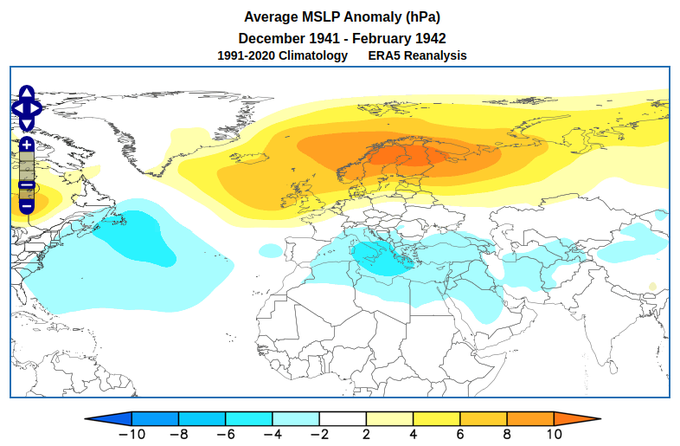
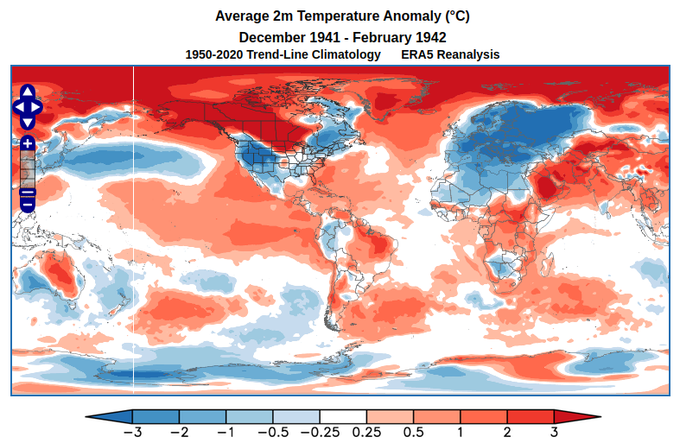
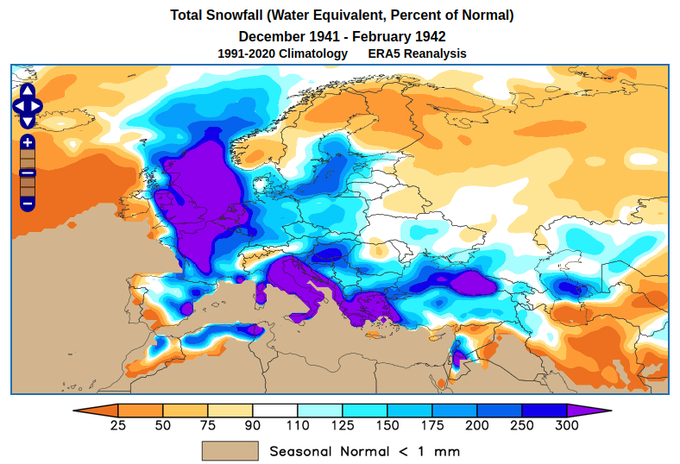
Added the newly-released 1940-1949 data to our ERA5 viewer.
The notoriously cold European winter of 1941-1942 (coldest of the 20th century) occurred in tandem with an extreme +PDO phase, following a super-El Niño the prior winter. Extreme climate anomalies!
5
21
114
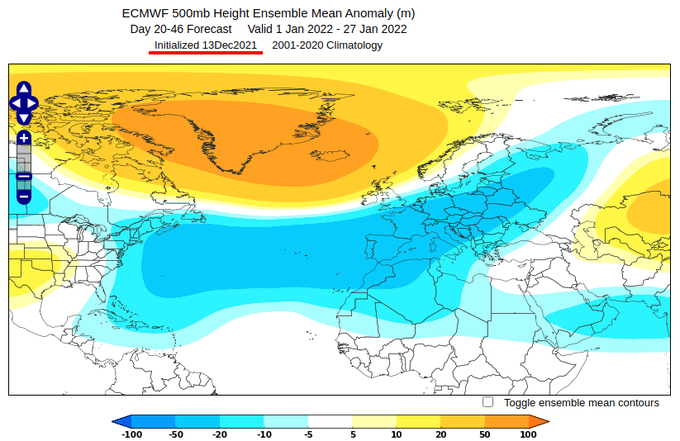
Eyebrows raised at last night's subseasonal JMA forecast. Like Monday's EC46, a dramatic shift to persistent Greenland-Iceland blocking well into January. JMA subseasonal skill is inferior to ECMWF, but the agreement is striking.
3
40
111
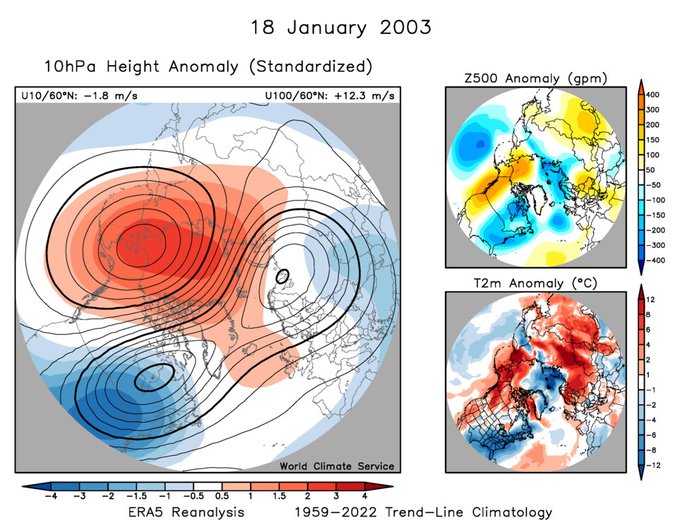
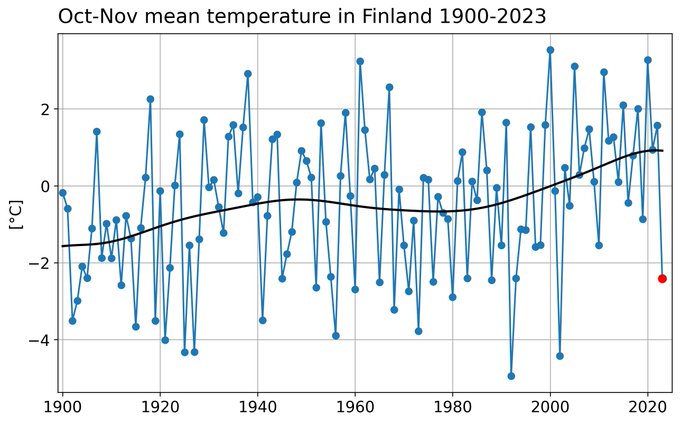
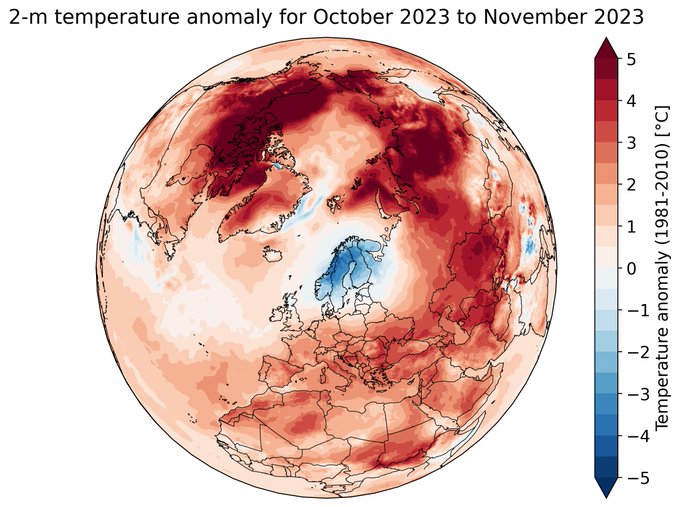
Cold has been remarkable in northern Europe since October. Interestingly, Oct-Dec cold in Finland is much more common during La Niña, but 2002 (exceptionally cold) was an El Niño winter.
Highlights for rest of winter 02/03 were the SSW on Jan 18, and the US East Coast blizzard.
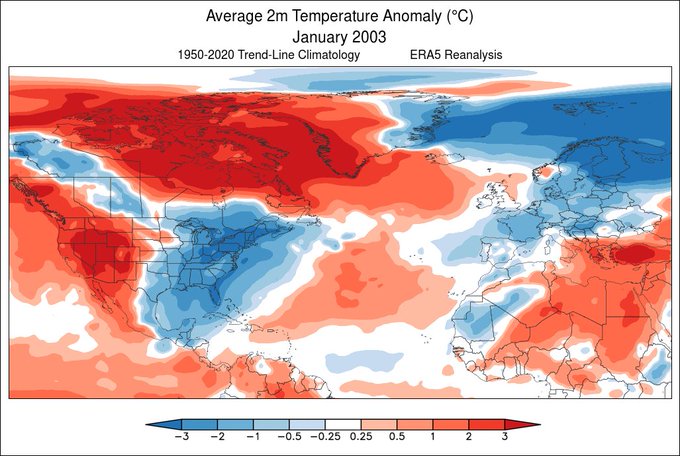
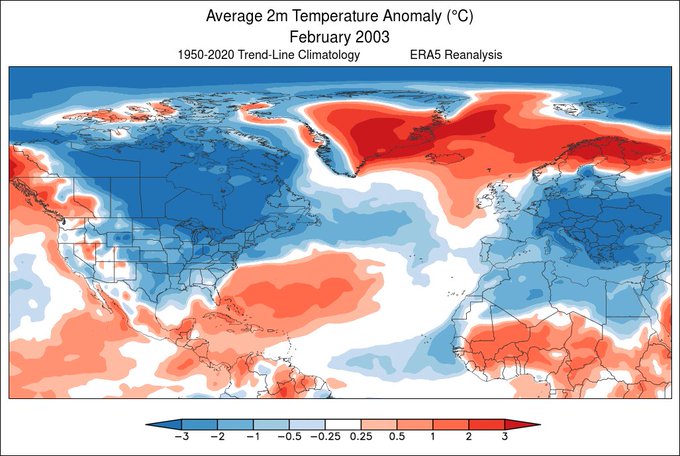

The October-November combined was the second coldest such period in Finland in this century. Only Oct-Nov 2002 was colder.
In the last century, however, such cold spells were much more common.
4
22
138
2
26
116
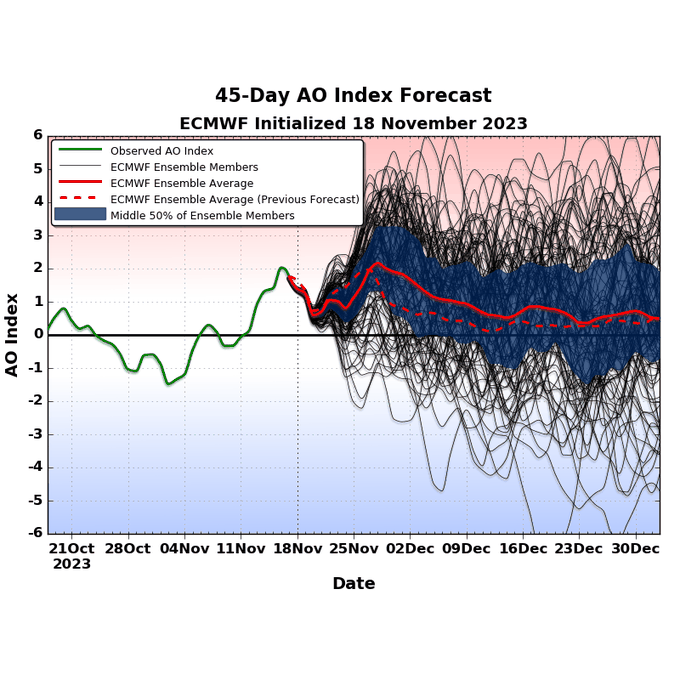
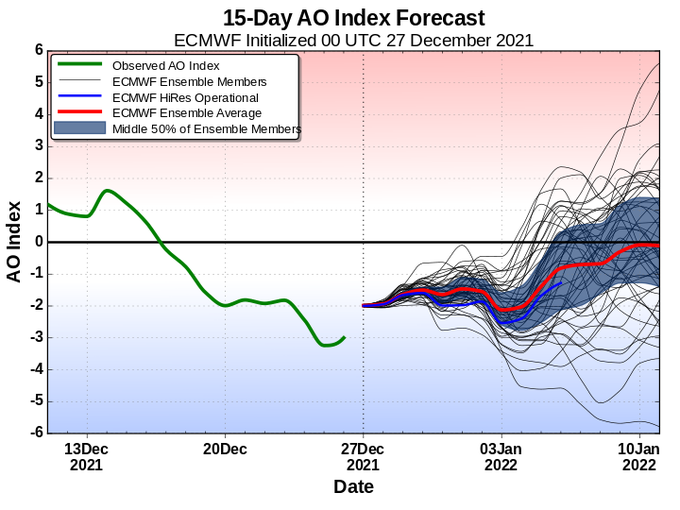
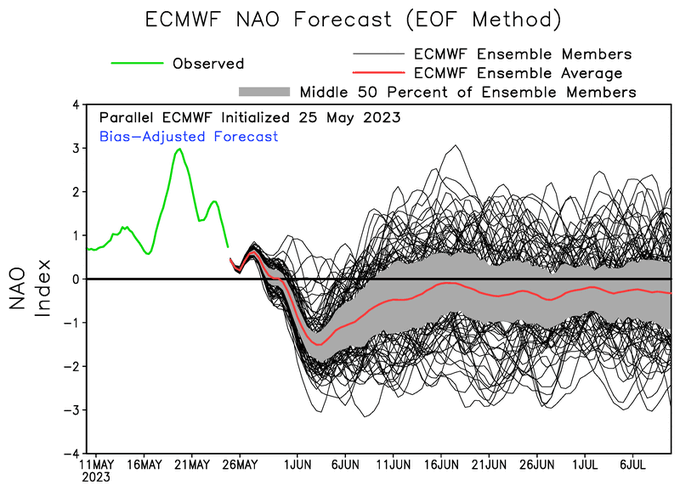
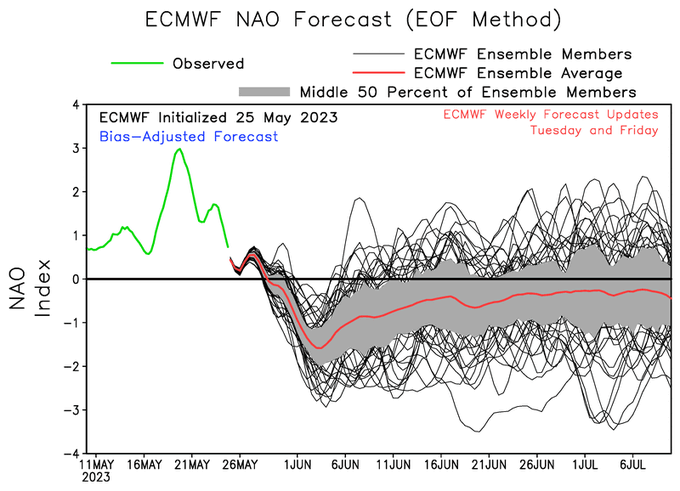
Ten days ago the ECMWF ensembles (both 15-day and 101-member extended) indicated a +AO/NAO phase for the end of the month, with fairly strong confidence. Then things changed.
This will be a great case study for medium-range predictability, including with the new AI models.
5
22
114
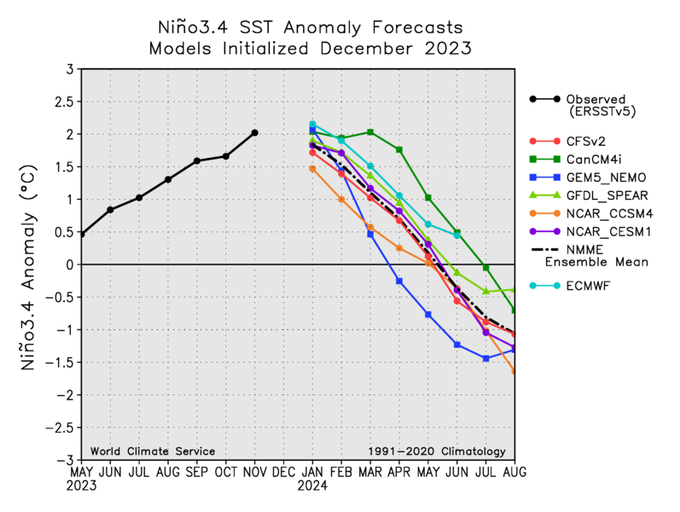
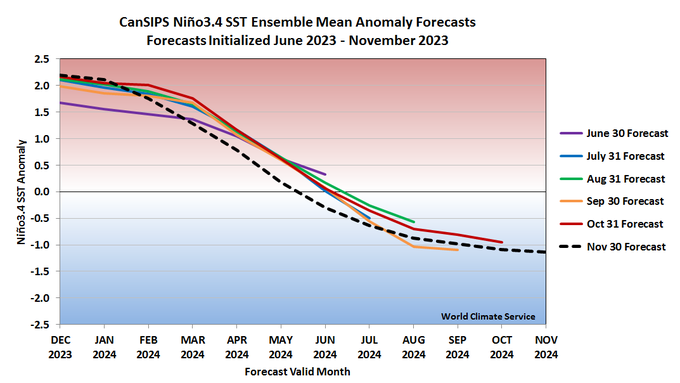
NMME models latching on to a rapid end of El Niño in Northern Hemisphere spring.
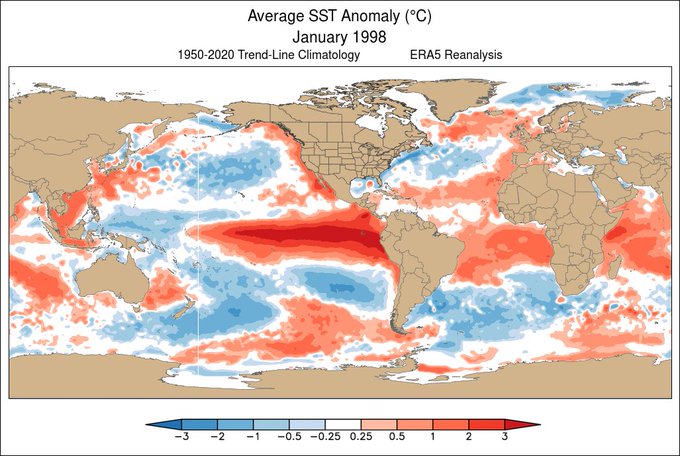
The 1998 and 2016 events had a negative Niño3.4 anomaly by June, so it's not unexpected.
6
26
110
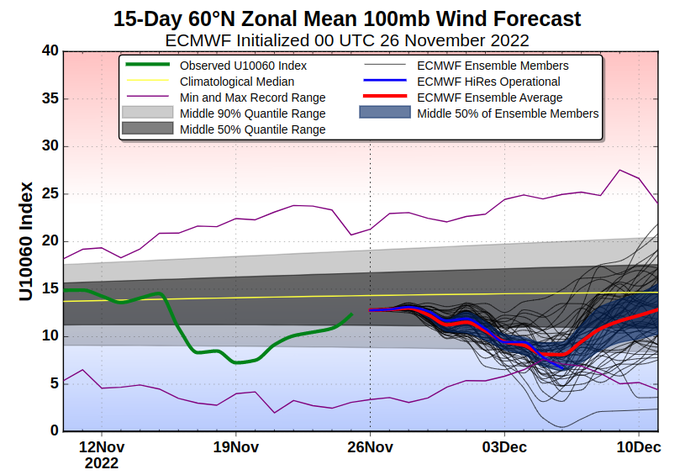
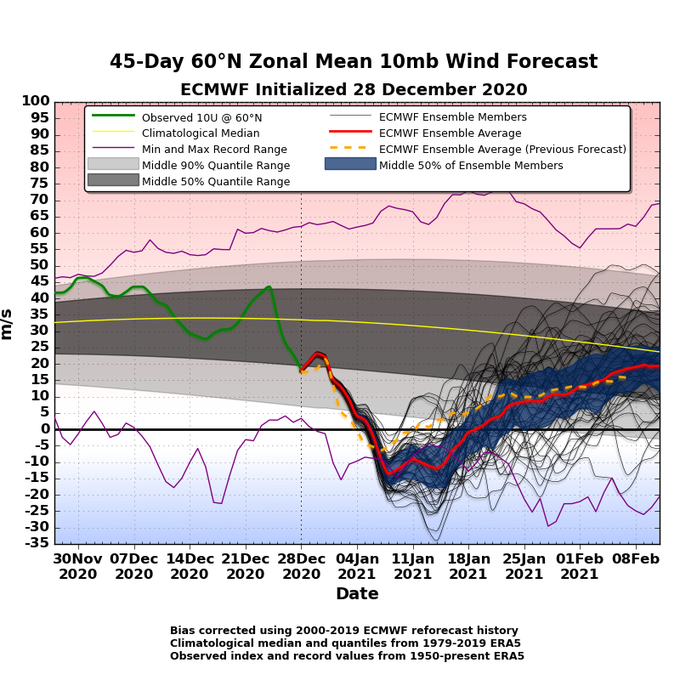
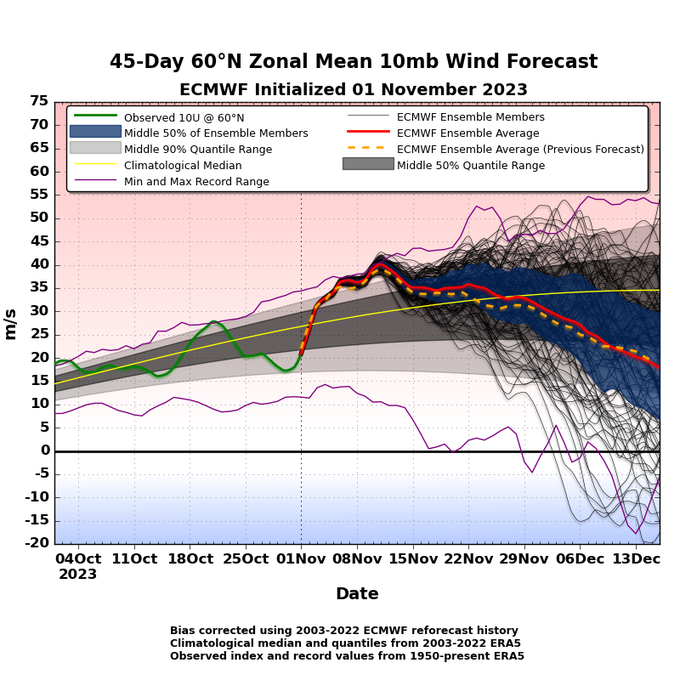
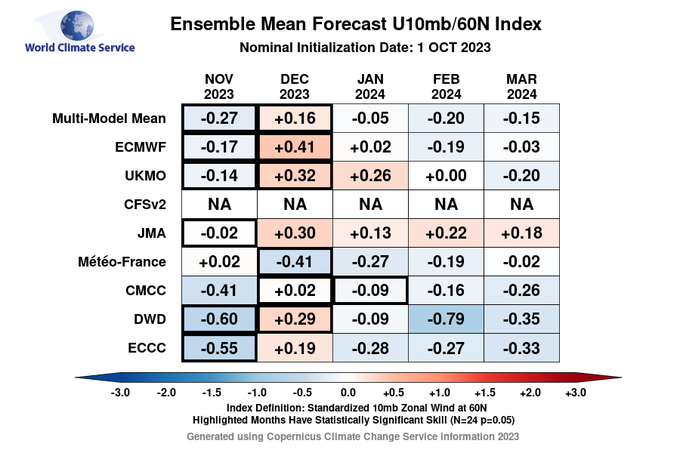
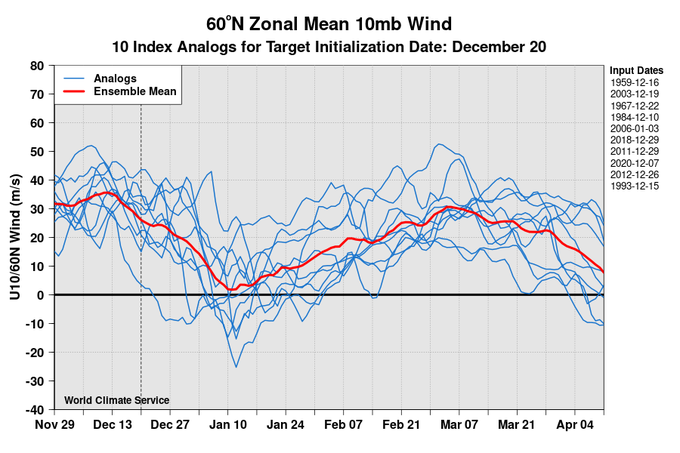
For those watching the stratosphere, there's no question about the trend in recent forecasts: a strong polar vortex is now heavily favored into the first part of December, especially in the lower stratosphere...
7
31
109
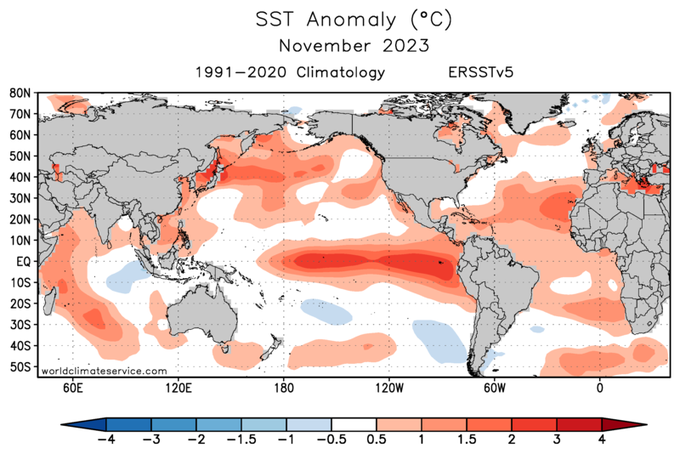
November SSTs show very interesting changes in the tropical Pacific.
Strong wind anomalies produced major warming east of the Date Line, extending El Niño's warm SSTs significantly westward.
Niño3.4 is at +2.0°C, but the ENSO Longitude Index is now only 12th highest since 1950.
4
32
110
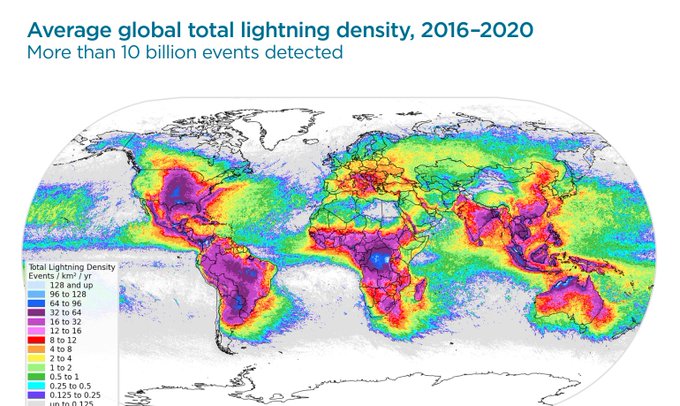
Fascinating map of 2016-2020 global lightning density in the
@VaisalaGroup
annual lightning report. I always thought Florida was a global lightning hotspot, but apparently not so much in the last 5 years.
5
23
110
If the ECMWF seasonal model is right about ENSO's rapid transition this spring, it would be a rare feat: only twice since 1950 has Niño3.4 warmed from -0.5°C to +0.5°C between January and May (1957, 1997). Model consensus is for El Niño to emerge later, in summer...
8
37
106
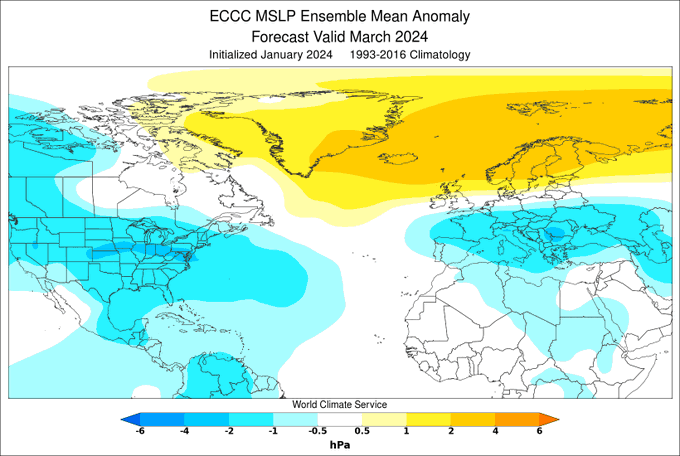
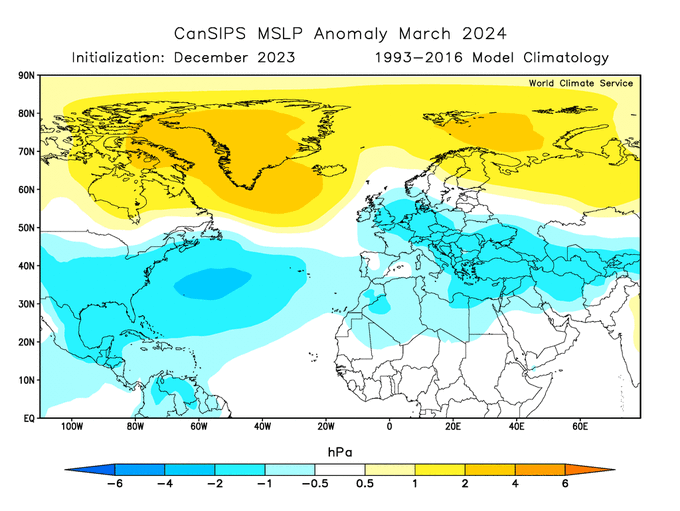
The CanSIPS seasonal update is finally available, and it shows no let-up in cold for northeastern Europe in February and March.
CanSIPS is the same as the
@CopernicusECMWF
ECCC model (actually two models) available on the 10th.
5
34
108
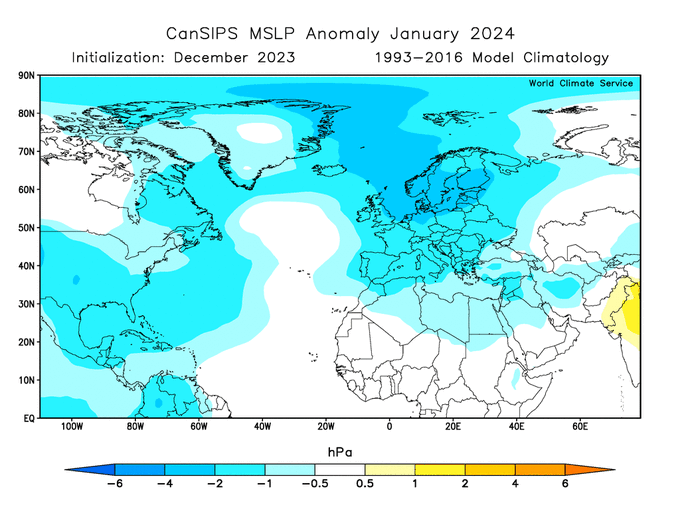
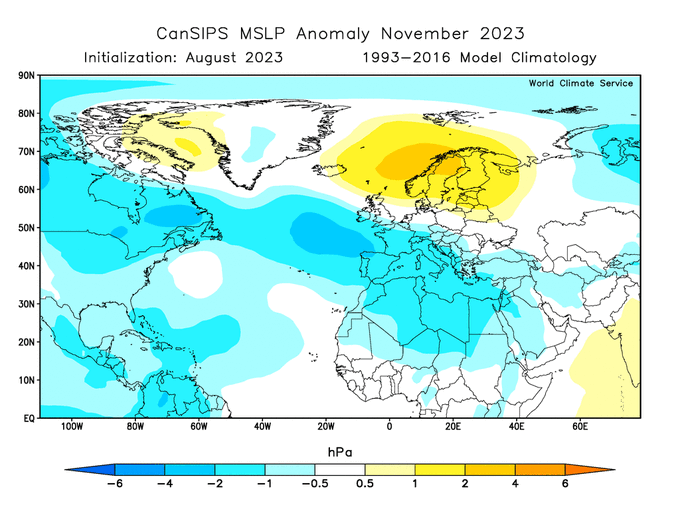
Ironically - given current events - the latest CanSIPS seasonal forecast backs away from its blocking signals yet again, now showing low pressure from N Europe to the Arctic in January. But last month showed this for December.
Also now expecting a rapid demise of El Niño by May.
6
8
102
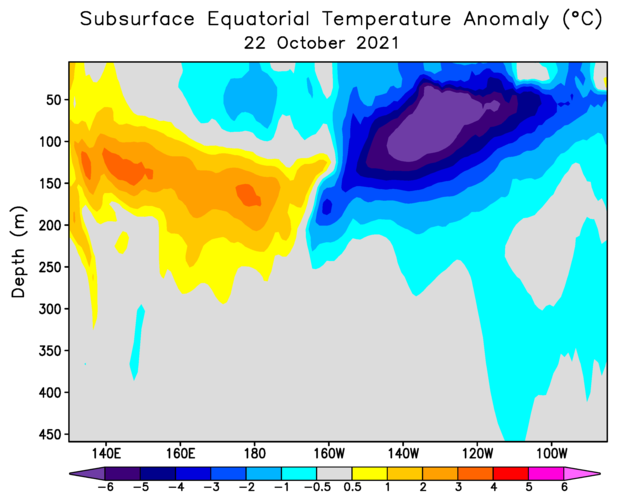
The latest data is a few weeks behind on this (GODAS), but it's remarkable to see equatorial Pacific subsurface temperatures even cooler around 130°W than the same date in 2010. The La Niña of 2010-11 was one of the strongest on record.
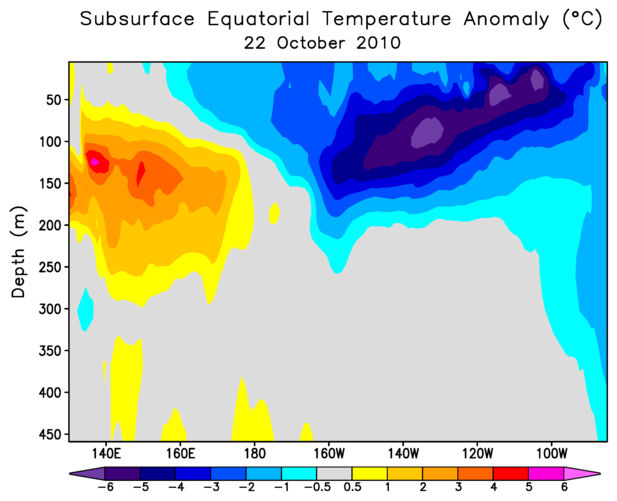
9
17
97
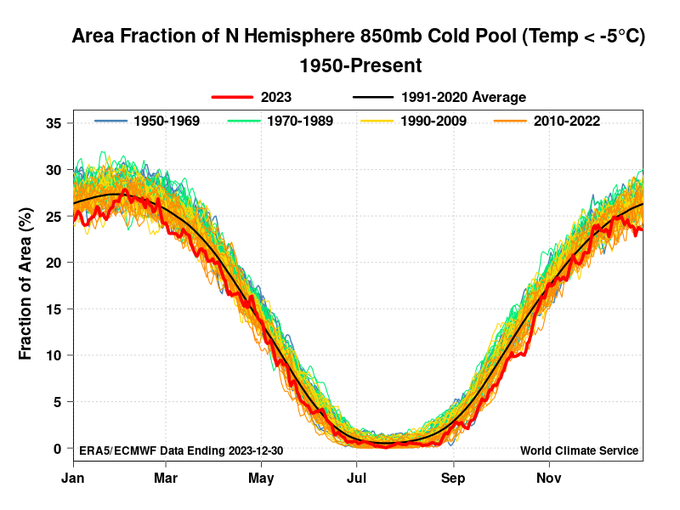
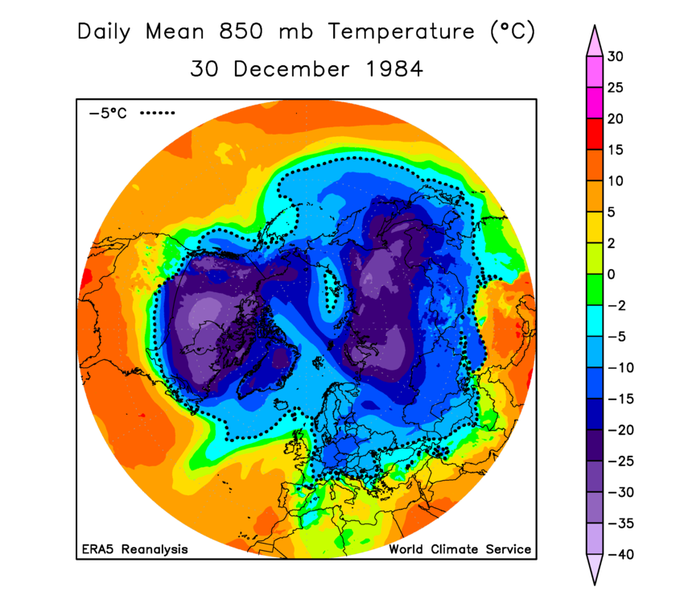
Not much cold air around to finish the year in the Northern Hemisphere: the 850mb area of the -5°C cold pool is the lowest on record.
Highest on record for the date was in 1984, a few weeks ahead of the enormous Jan 1985 U.S. cold outbreak.
ERA5 data since 1950.
3
26
103
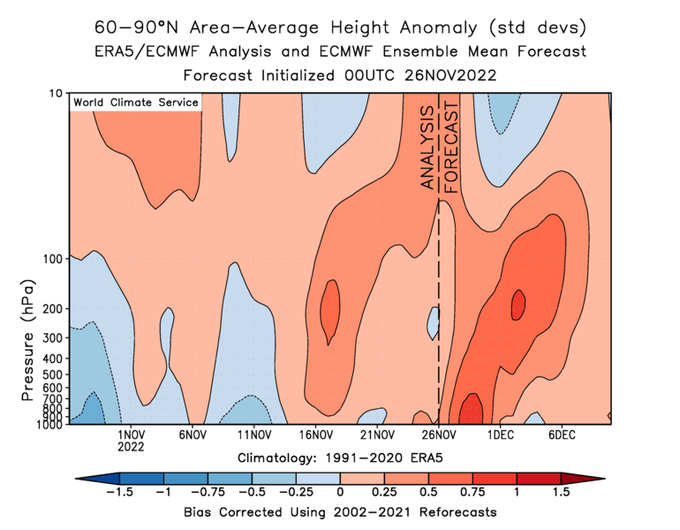
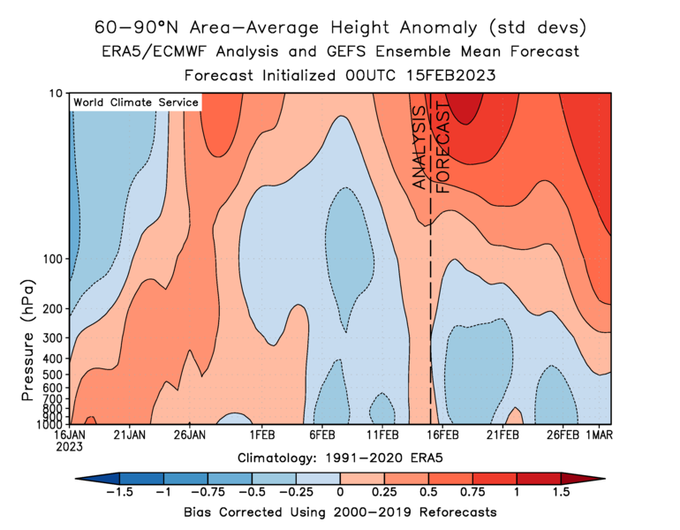
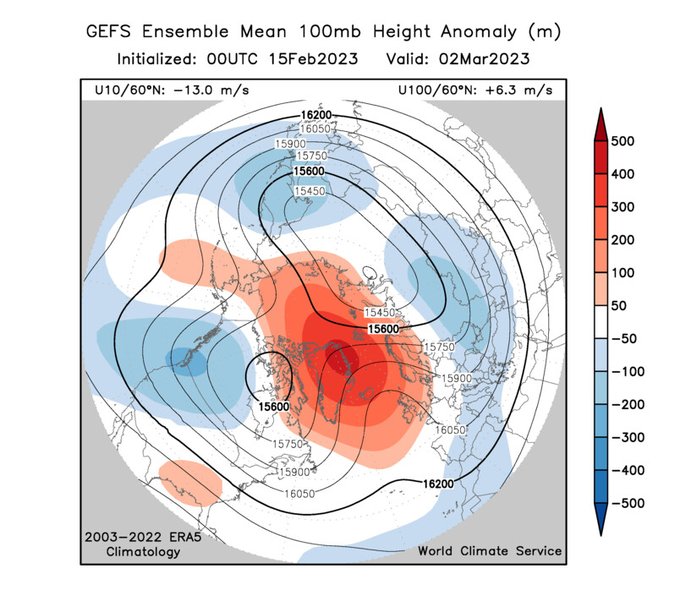
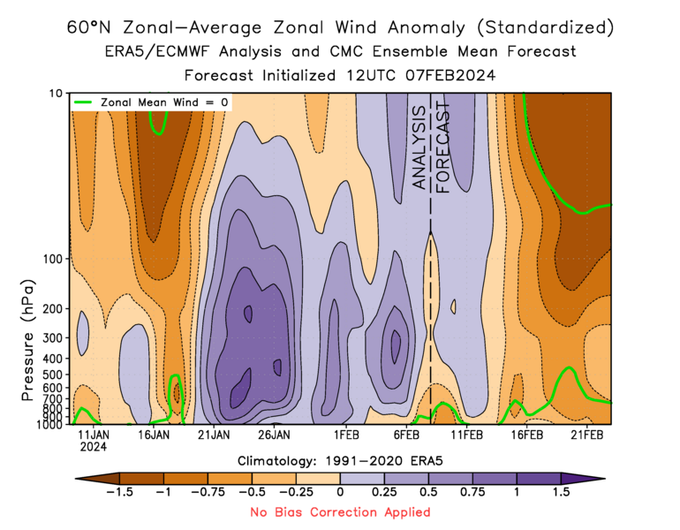
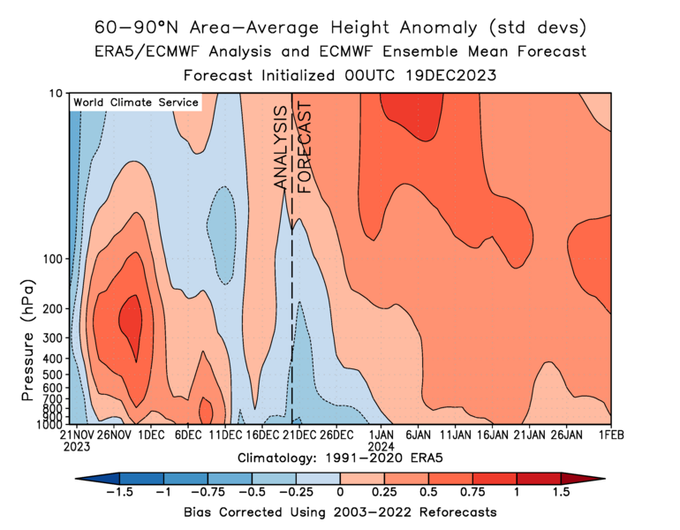
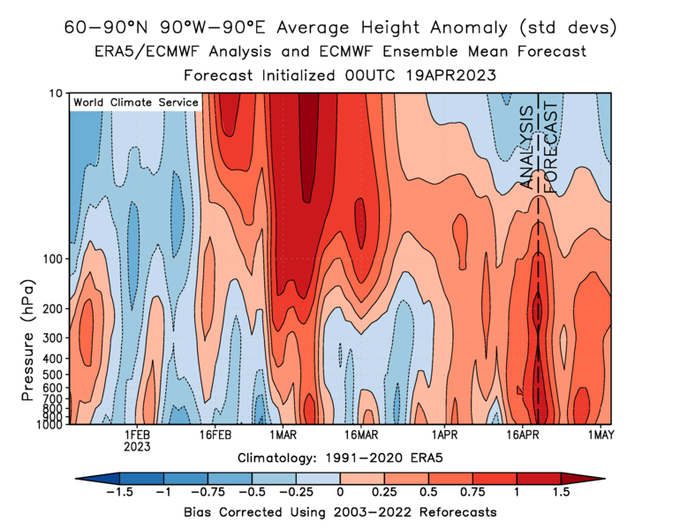
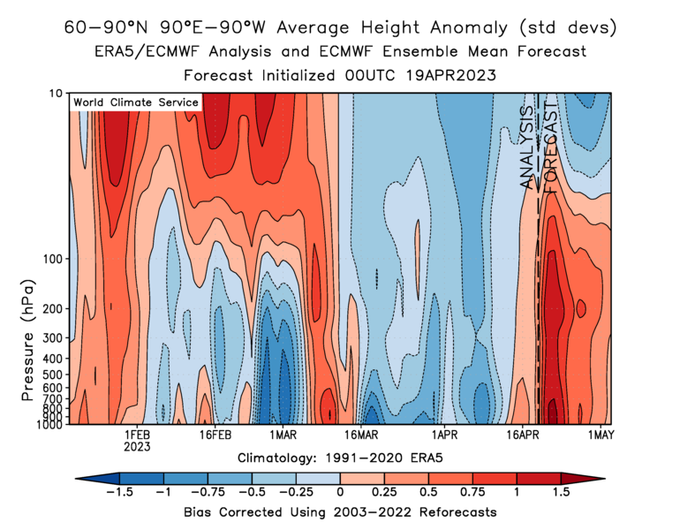
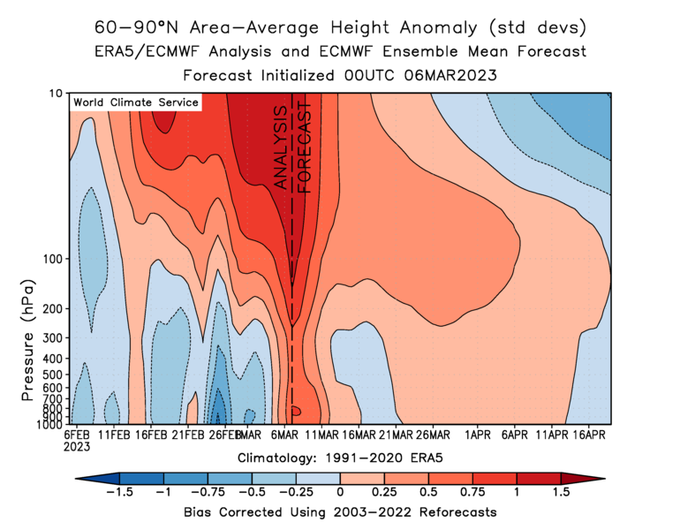
The polar cap height forecast illustrates the "bottom up" nature of the impending disruption to the polar vortex (i.e. high-latitude blocking) - lower troposphere first, then upper troposphere and lower stratosphere. The 100mb vortex may be record-weak 10 days from now.
9
29
102
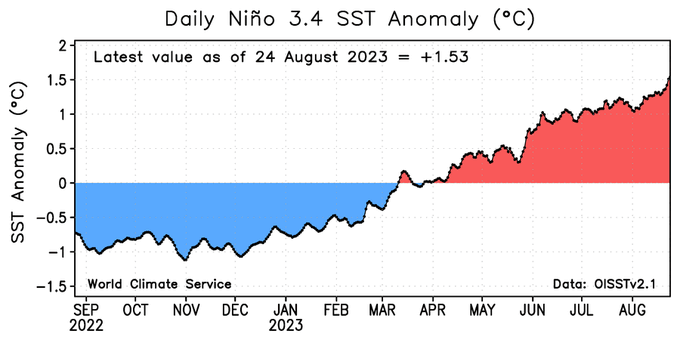
There it is: Niño3.4 SSTs more than 1.5°C above normal - the typical SST definition of a "strong" El Niño.
The latest round of surface warming is the result of Niño-like patterns emerging in the tropical atmosphere at last: subsidence over Indonesia, reduced Pacific trade winds.
14
37
101
Remarkable forecasts of a rapid transition to El Niño in today's
@CopernicusECMWF
model update. The ECMWF is no longer a warm outlier.
It's tempting to say the models are overconfident, but the spring predictability barrier is mostly behind us. So El Niño it is - but how strong??
6
37
100
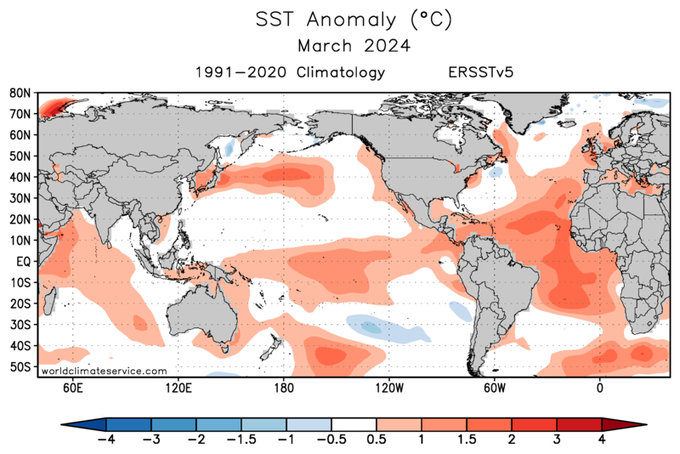
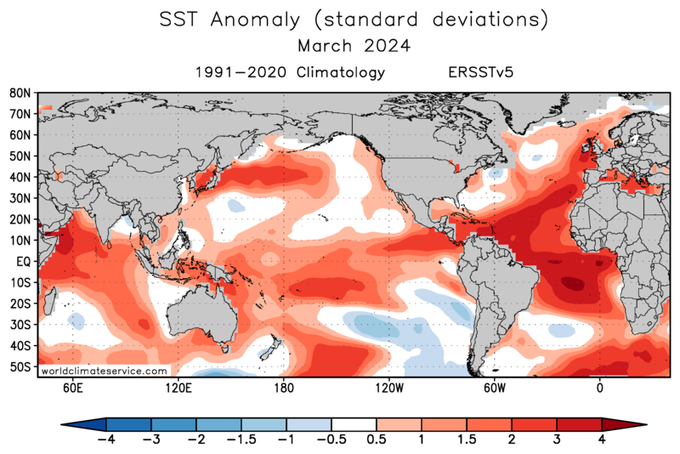
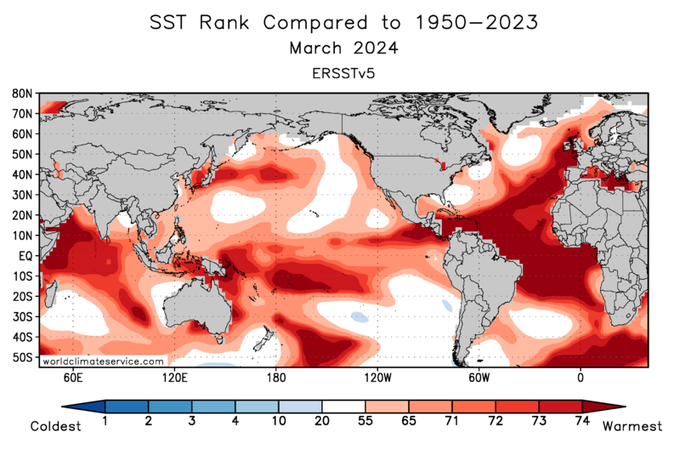
With El Niño waning, the Atlantic warmth is once again indisputably the most significant oceanic warm anomaly on the planet. Amazing extent of record high March SSTs.
NW Indian Ocean warmth is also highly anomalous (+IOD persisting).
8
26
103
As others have noted, the EPO index is close to an all-time record negative value, reflecting the extreme Alaska/NW Canada ridge. Winters following a negative EPO extreme in November show an interesting signal: negative AO/NAO in 6 of 8, but NOT the most recent two (14-15, 17-18)
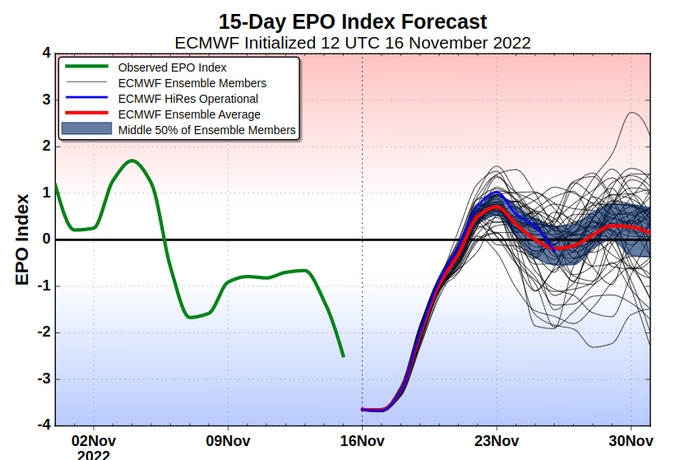
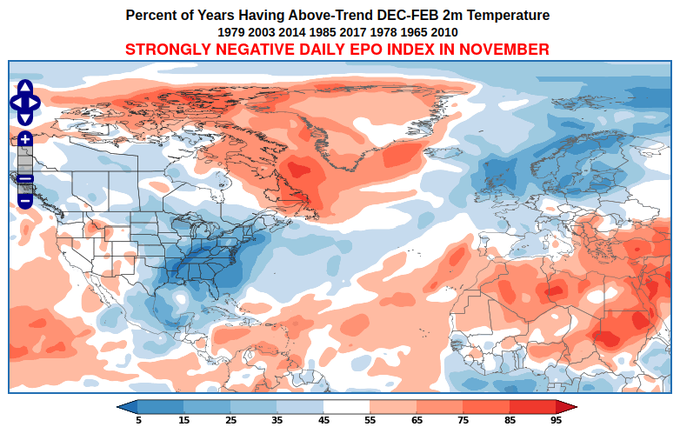
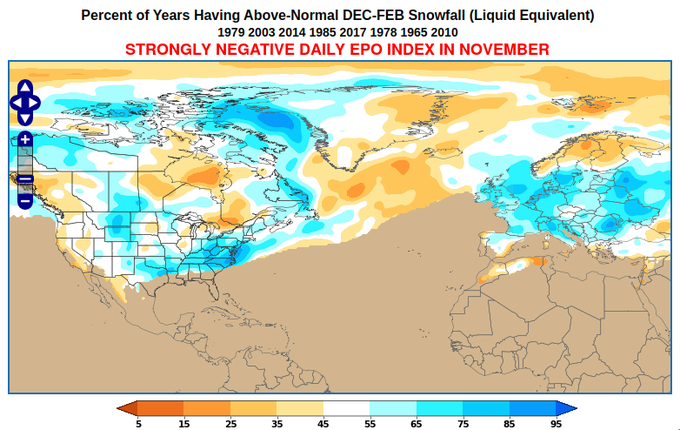
8
23
97
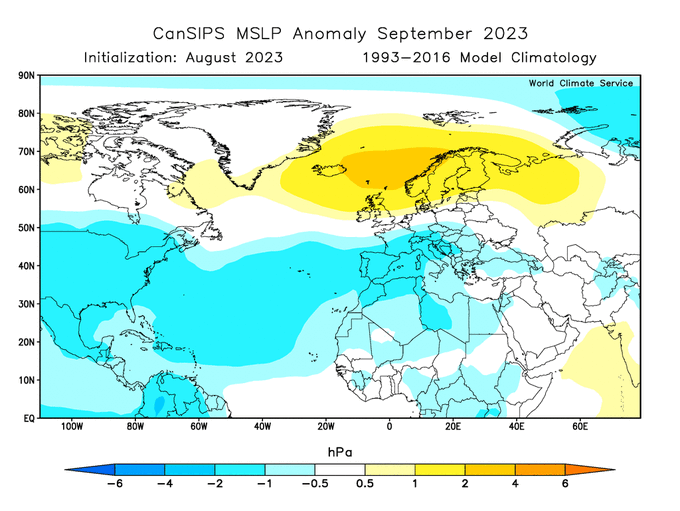
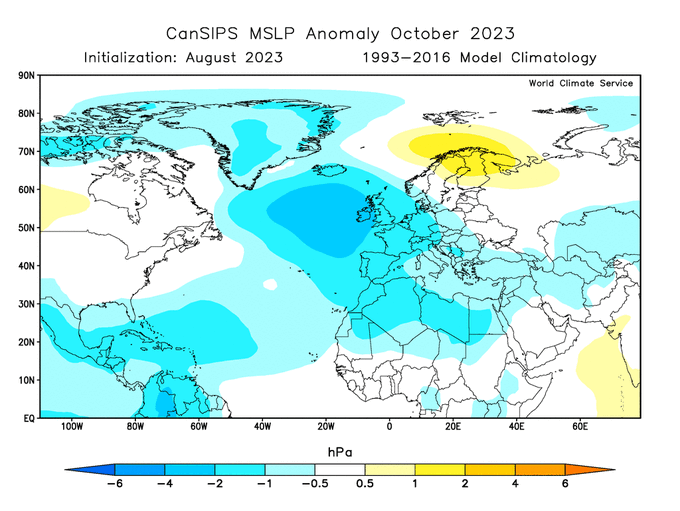
Interesting to see the persistence of high pressure over northernmost Europe in September through December, according to today's CanSIPS update. This is not particularly characteristic of El Niño, except perhaps in October.
As for January and February...
7
11
100
The monthly CanSIPS update shows even more rapid Niño3.4 warming this summer, reaching +1.5°C by August. This would be rare territory: only 4 years since 1950 reached this "strong El Niño" SST threshold by August (1965, 1987, 1997, 2015).
10
38
97
ECMWF going all in with the stratospheric vortex breakdown in the next 10 days. With 13 days of 60°N 10mb wind reversal, this would be in the upper tier of mid-winter
#SSW
events - only 8 other winters since 1950 have seen longer easterly spells (ERA5, Dec-Feb)
4
21
97
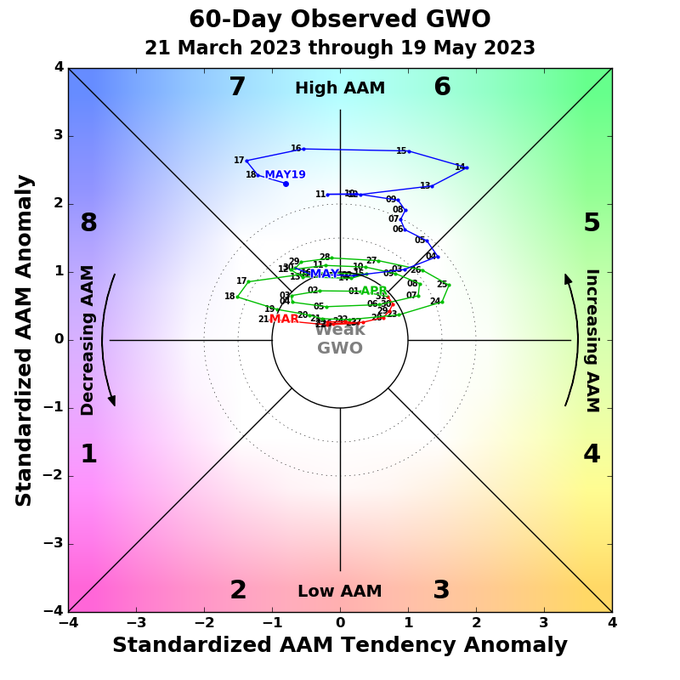
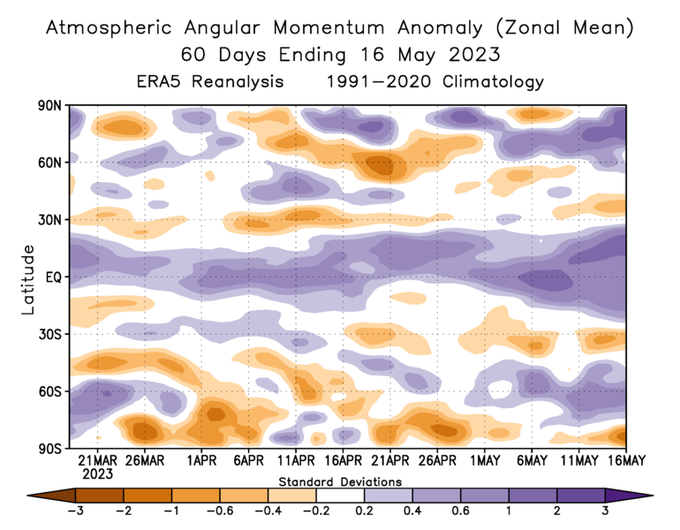
Overheard last week: "El Niño is coming on strong but the atmosphere is still La Niña".
In reality, global AAM* has become exceptionally high in the last 10 days. High AAM is characteristic of El Niño's atmospheric component.
*AAM = atmospheric angular momentum
6
37
97
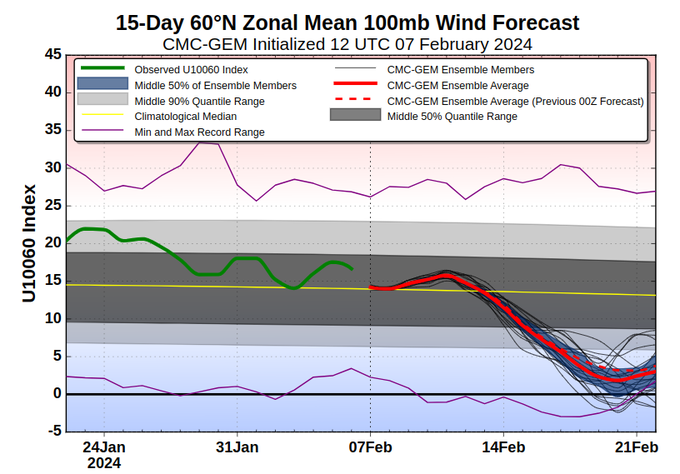
00Z GEFS showing the stratospheric vortex disruption working its way down to the lower stratosphere and upper troposphere by the beginning of March. Could the 60°N wind reversal reach 100mb? The last time this happened in winter was Feb 2010.
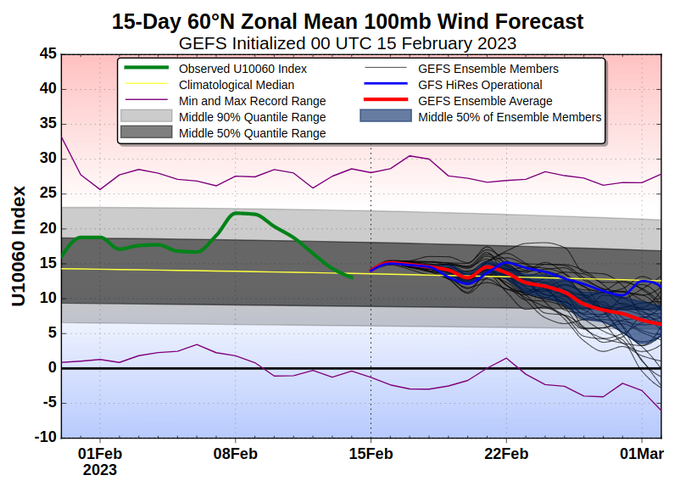
3
29
94
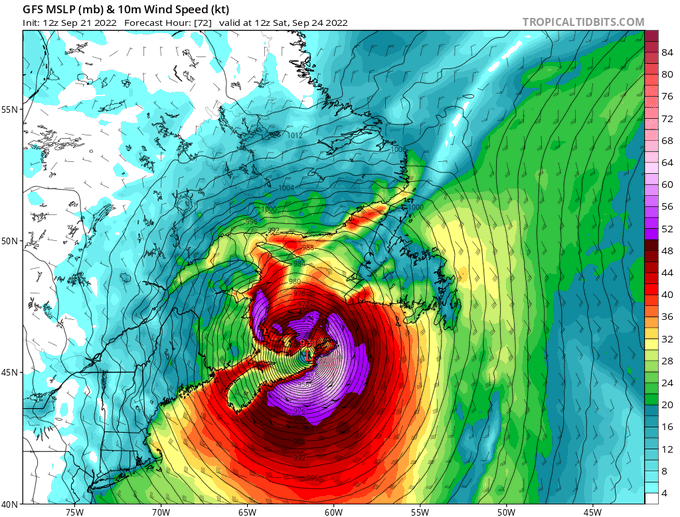
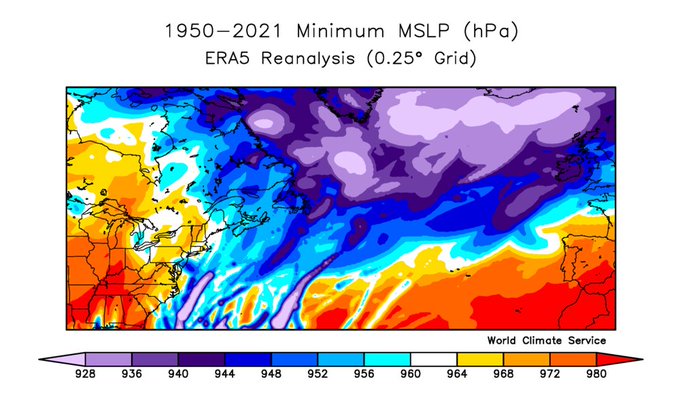
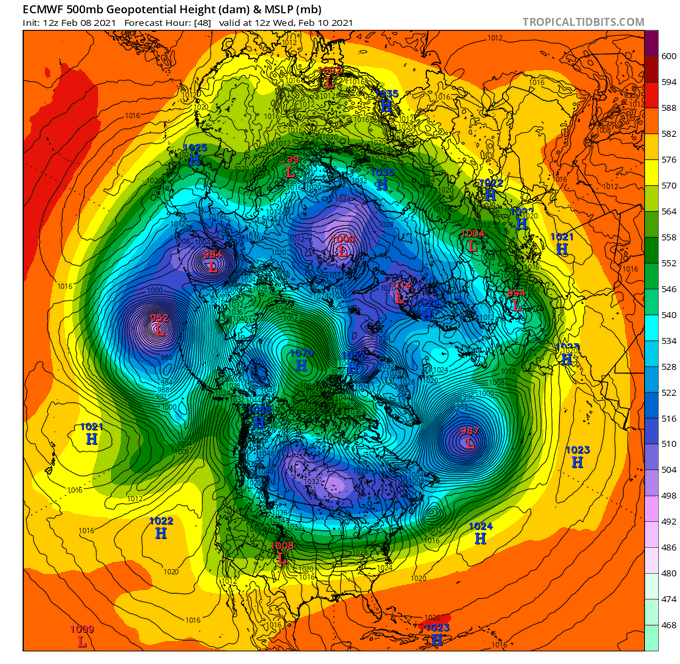
Less than 72 hours out now, the GFS maintains a very extreme 930mb
#Fiona
landfall in Nova Scotia. This would obliterate the record lowest MSLP for the province (1950-present), which is 952mb according to ERA5 (Jan 21, 2000 and Dec 19, 1963). Forecast map via
@TropicalTidbits
2
33
94
La Niña has seen remarkable intensification into N Hem spring: the April bivariate ENSO index (SOI+Niño3.4 SST) of -1.8 is one of the lowest monthly values in the last 30 years (only exceeded by 2010-11). Notice too very unusual warmth around India, NW Pacific, and British Isles
5
31
97
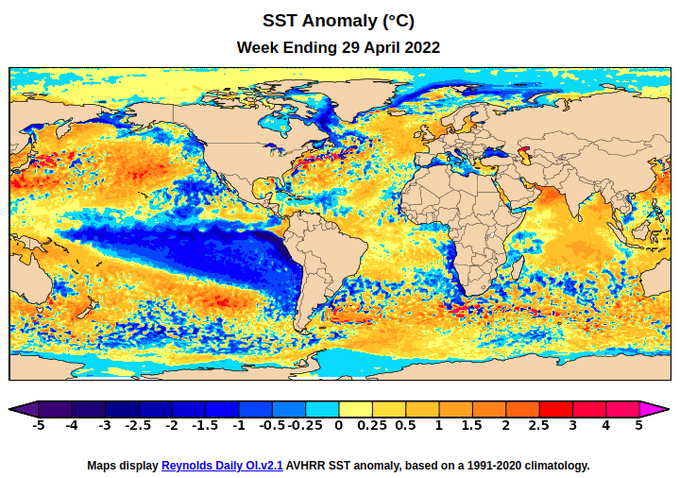
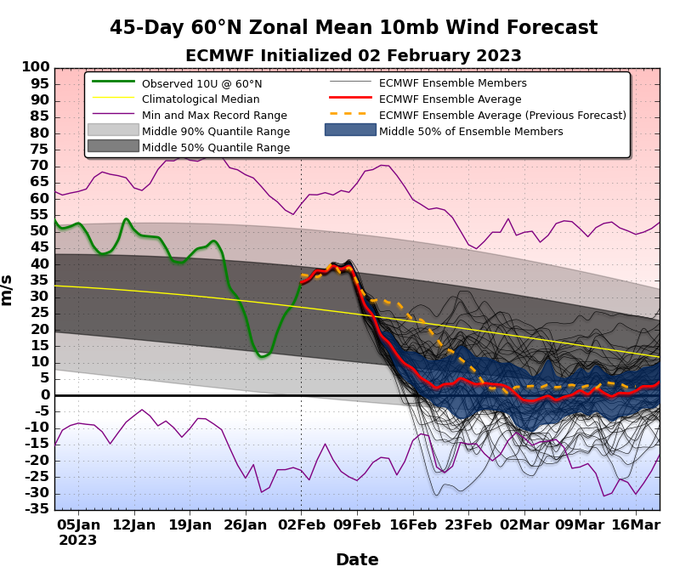
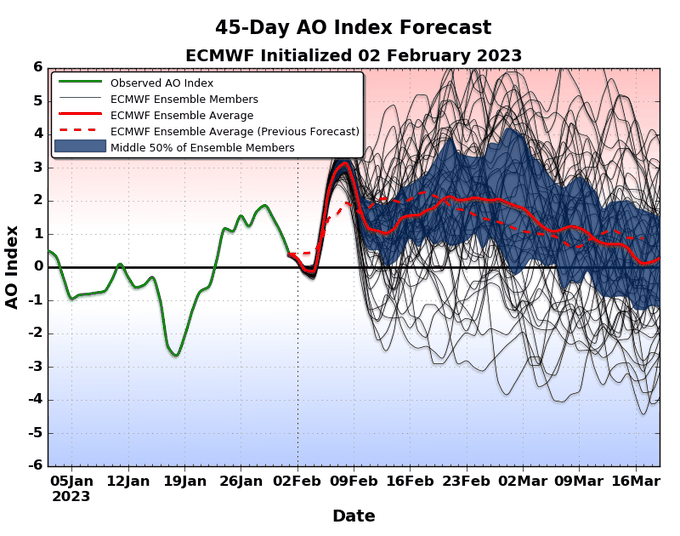
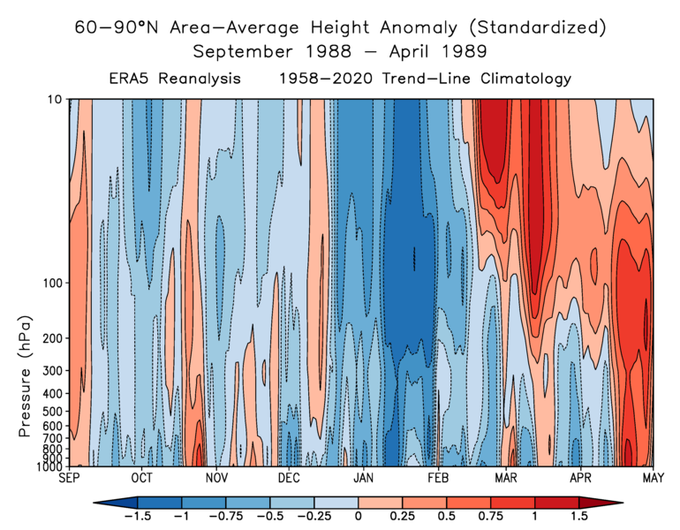
A striking stratosphere-troposphere disconnect in the latest EC46 forecast: most members show a major PV disruption in the stratosphere, but the surface AO index remains positive for weeks.
A classic historical example of this is Feb 1989: the positive AO lingered into mid-April.
6
19
94
Latest CanSIPS is sticking with a Greenland blocking signal for the upcoming winter. A little more west-based than last month's forecast, but still notable.
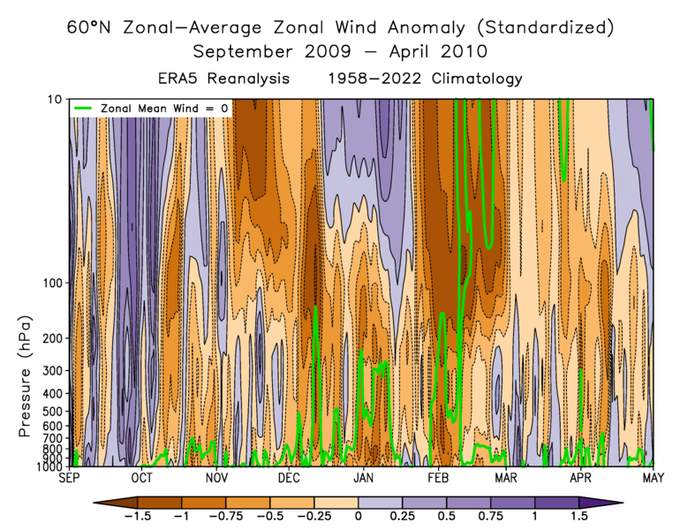
2009-2010 would be the obvious analog for a highly blocked winter during El Niño. But model skill is small! Stay tuned.
6
18
95
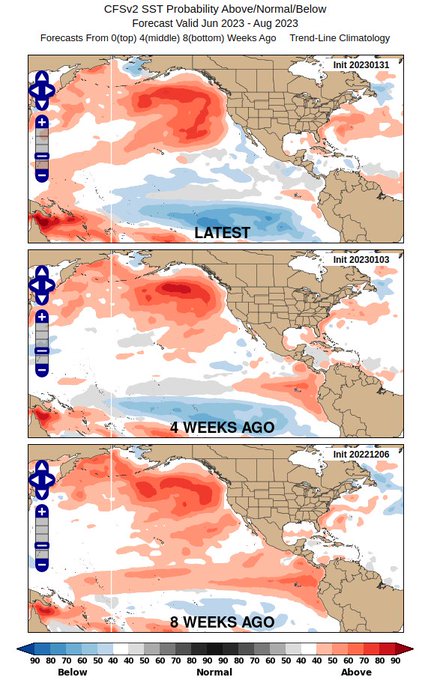
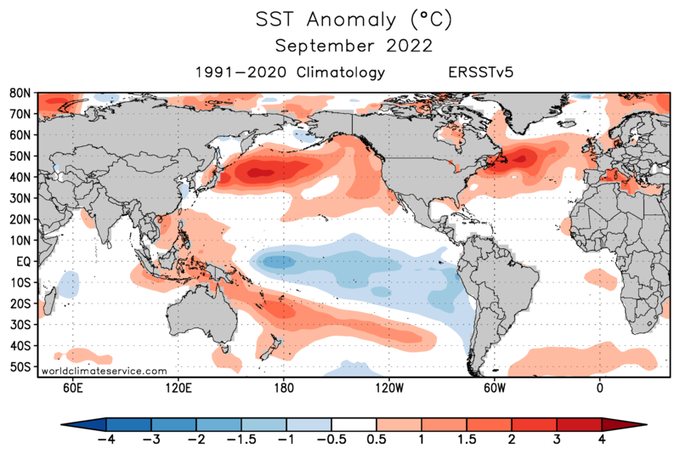
No real signs of the negative PDO dissipating as El Niño strengthens.
In 1972 - the only reasonable analog to date - the negative PDO quickly shifted to neutral in July/August as the N Pacific circulation responded to El Niño. But the models claim this won't happen in 2023.
4
28
96
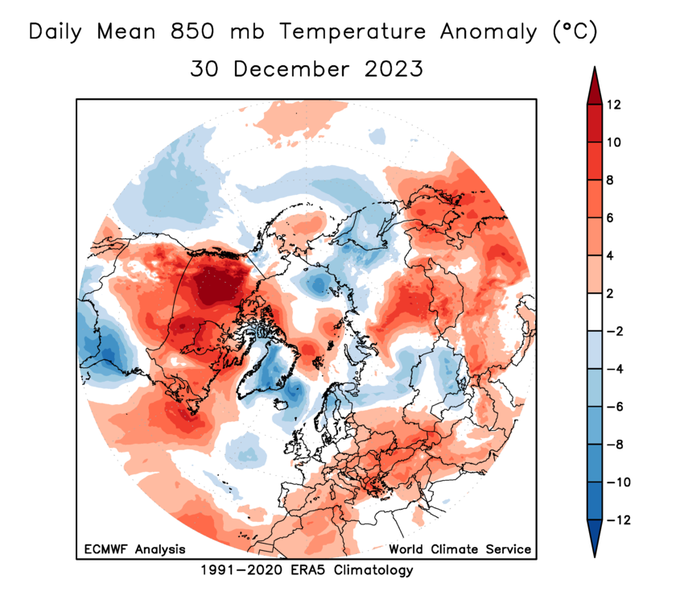
It's striking to see extreme warmth in the southeastern USA as well as western Europe while the Arctic Oscillation is negative; these two regions typically show the opposite "response" to the AO phase. Only the East Asia cold fits the canonical -AO pattern at the moment.
3
29
93
Just a slight change in the latest CanSIPS forecast for February. Happy New Year!
7
15
92
One month to go until the big ECMWF upgrade.
101 members in the daily subseasonal forecast! 😍
Compare new (parallel) versus old (current) from Thursday's run.
4
21
92
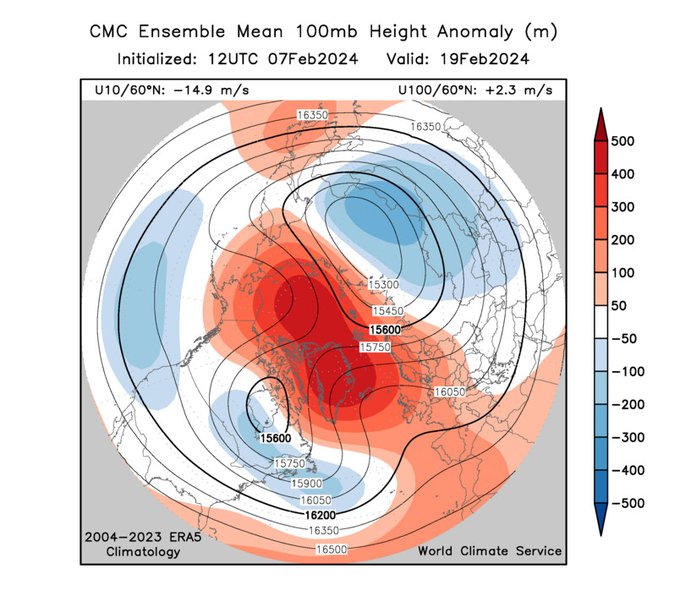
Impressive stratospheric action in today's 12Z Canadian: nearly half of the ensemble reverses the 60°N zonal flow all the way down to 100mb.
The last time the 100mb 60°N wind reversed in winter was during the February 2010 SSW.
4
25
93
I'm sure others have noted that the November pattern from North America to Europe was very similar to the historical precursor for strongly negative NAO winters
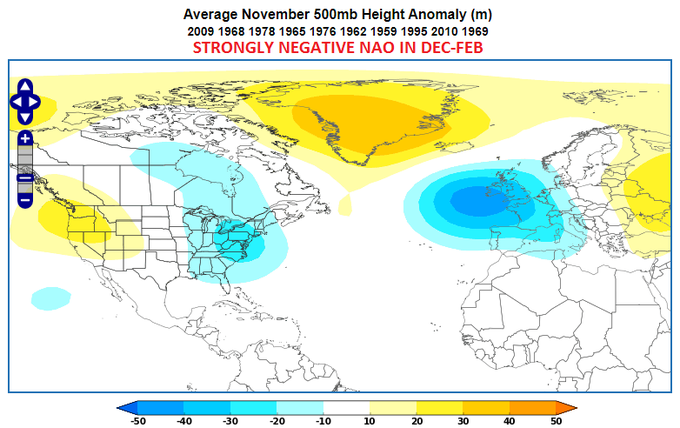
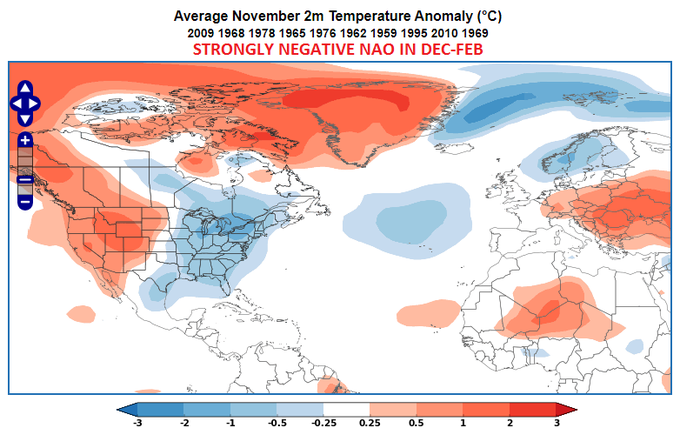
6
24
91
Latest CanSIPS: a quick transition to El Niño by mid-summer, and now with a robust El Niño through next winter.
If El Niño does become the dominant player, it will tend to favor a cool, wet summer for the northern U.S. and wet for western Europe (big changes from recent years).
9
30
90
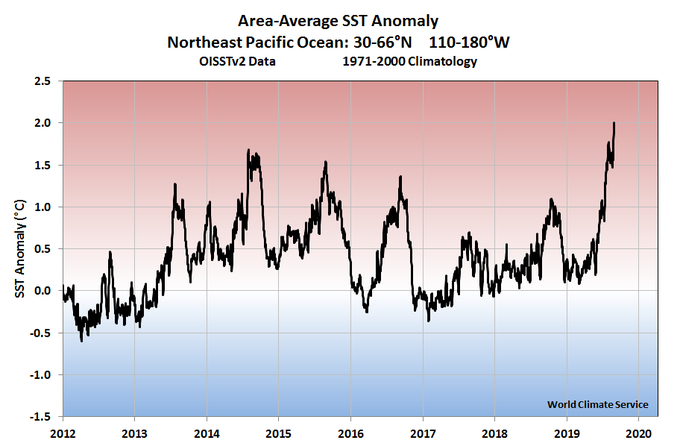
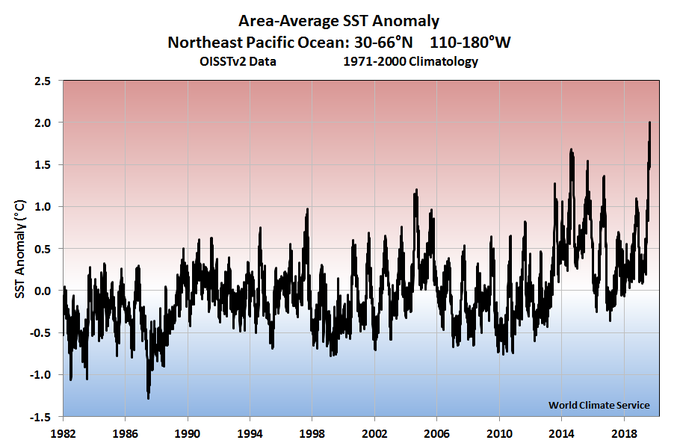
As of yesterday, northeast Pacific area-average SSTs are more than 2°C above normal, according to
@NOAANCEIclimate
OISSTv2 daily data. This is well above the peak warmth of the "warm blob" years (2013-2016). It's been a remarkable run up since May.
7
55
86
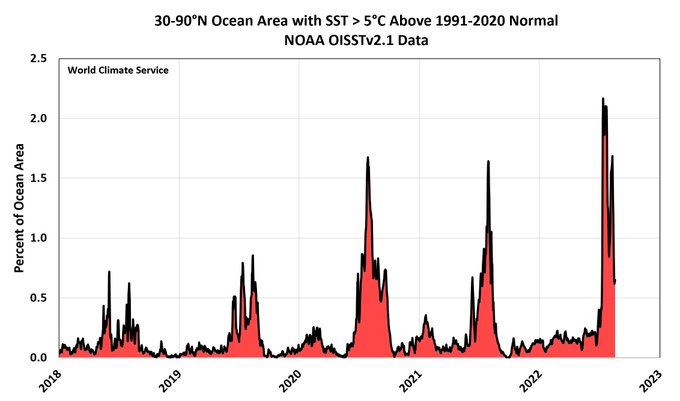
N Hemisphere oceans have seen some astonishing warmth this summer, despite the ongoing La Niña. Last month, SSTs exceeded +5°C above normal over more than 2% of the 30-90°N ocean area on some days - the most extensive +5°C anomalies in the OISST data (since 1982)
#MarineHeatwave
4
27
90
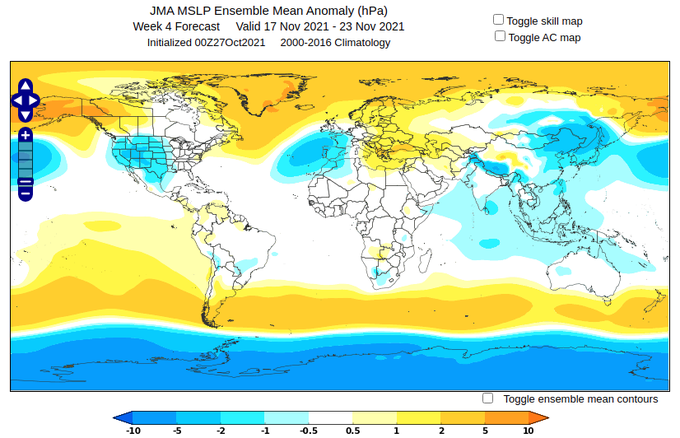
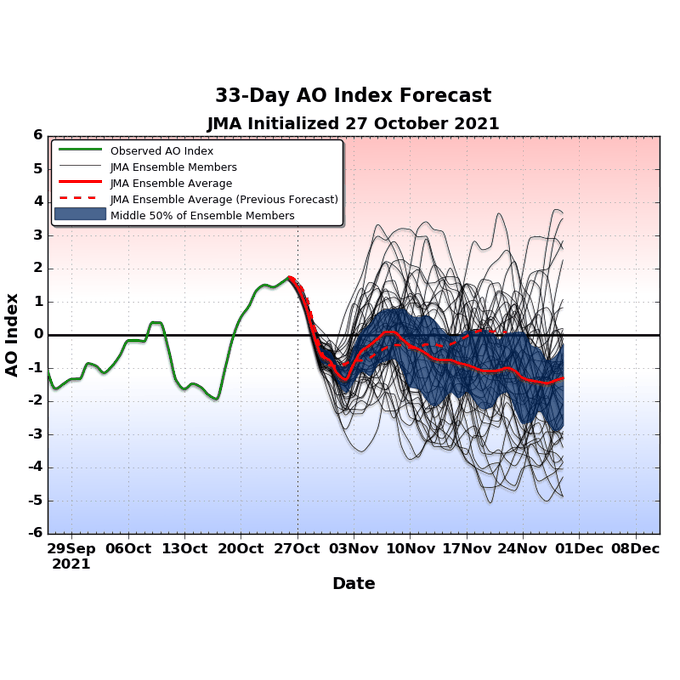
Yesterday's subseasonal JMA outlook shifted significantly towards more Arctic blocking (negative AO index) by mid-November. Calibration is running now on tonight's ECMWF-extended forecast - how will it compare?
4
20
85
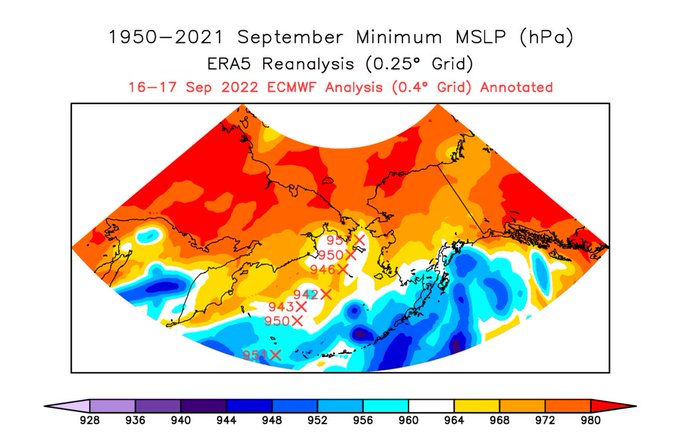
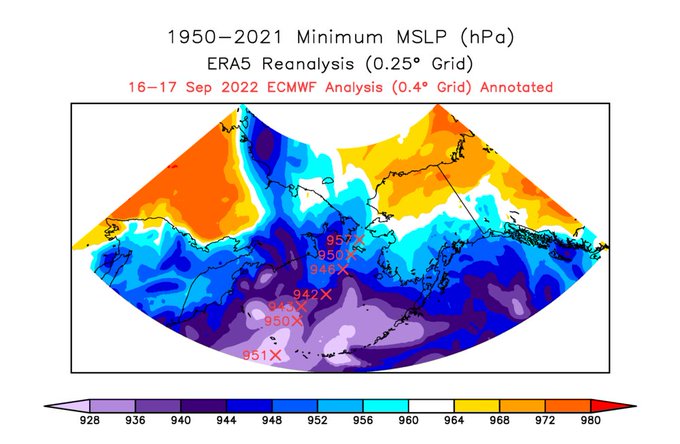
The storm affecting western Alaska today had easily the lowest MSLP (1950-present) for September in the northern Bering Sea, and based on ECMWF analyses it even beat winter/all-time records along part of its track. (To be confirmed when ERA5 data is in)
@AlaskaWx
@NWSFairbanks
0
26
88
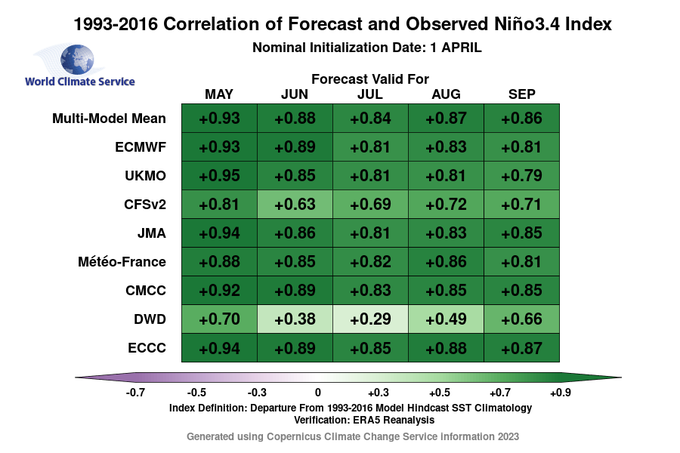
The latest ECCC/CanSIPS forecast is, shall we say, "on board" with the idea of a strong El Niño later this year. Wow.
ECCC Niño3.4 skill is good - perhaps the best of the seasonal models - and the spring predictability barrier is past.
12
38
88
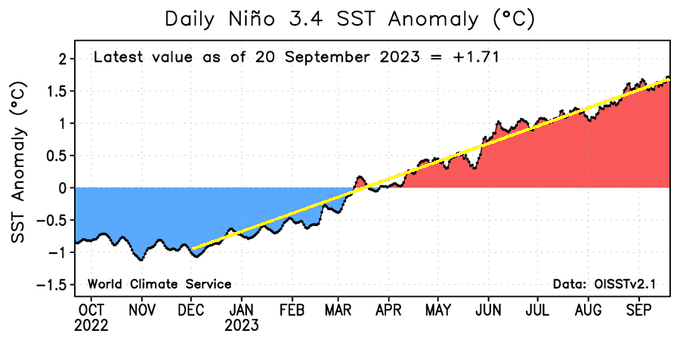
From a "big picture" perspective, the climb in Niño3.4 SST anomalies has been quite relentless since late last year: about 2.5°C of anomaly warming in 10 months.
This is not unusual as a major El Niño emerges. In 1997, Niño3.4 rose 3°C in 10 months. In 2009, 2.5°C.
1
21
87
With an active tropical Atlantic in the ECMWF seasonal, I was curious* about where/when the storms develop in the model.
Animation shows ensemble-max wind gust by week for July-October.
*Caveat: NOT for operational use - this only shows the most extreme outcomes in the ensemble
6
8
86
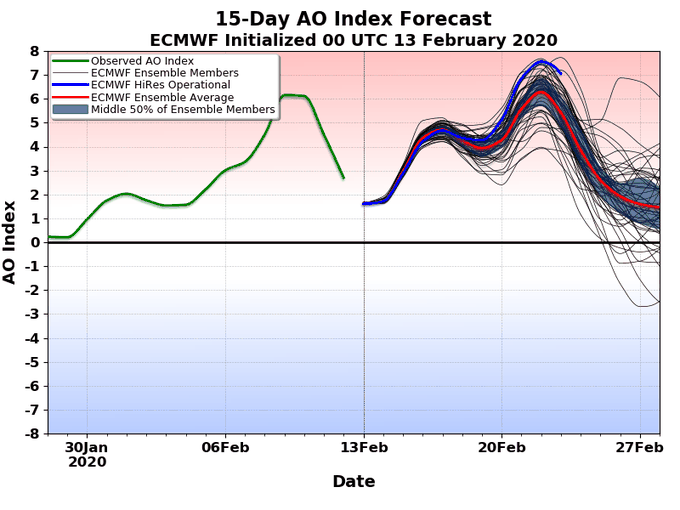
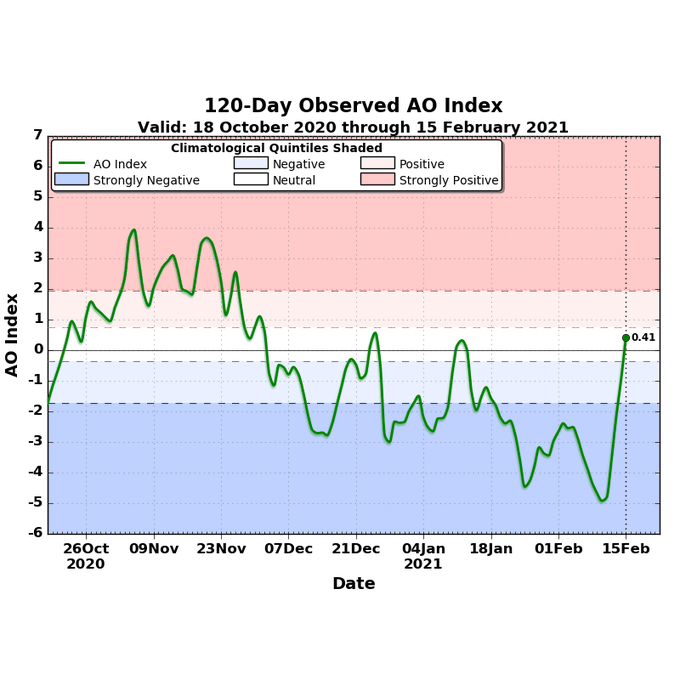
This is getting ridiculous - peak AO index values in recent ECMWF HRES (10-day) runs:
Feb 12 00Z +6.4
Feb 12 12Z +7.3
Feb 13 00Z +7.6
We've capitulated and expanded the scale on our AO graphics to accommodate the extreme.
1950-present record (set 3 days ago) is +6.3
5
24
82
Lots of mentions of winter 1984-85, given expected similarities of the December pattern. Here's an animation of 10mb heights: the stratospheric PV split on Jan 1, and it took until mid-Feb to recover. Extreme January cold in Europe, and "freeze of the century" in Florida...
4
21
85
Remarkable collapse of the negative PDO phase as warm SST anomalies are wiped out to the east of Japan.
The models expect a negative PDO to persist through winter, however.
7
16
86
Interesting to see some EC46 members with a U10/60 reversal (sudden stratospheric warming) in early December. This would be a rare event for the time of year - last occurring in 1998.
October's Météo-France seasonal model hinted at this, and interestingly skill is rather good.
6
22
85
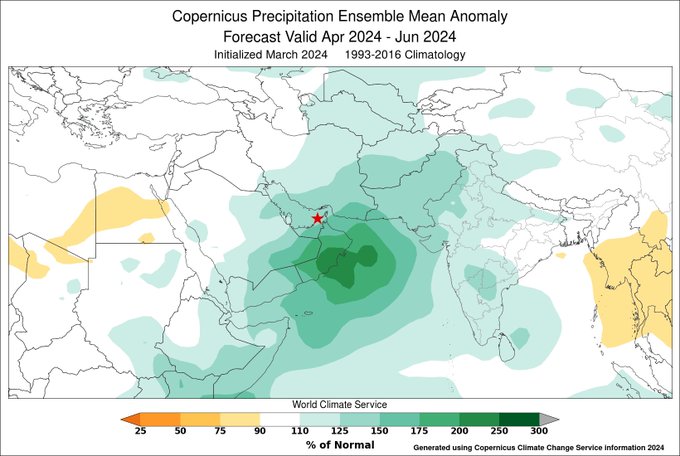
Looks like this seasonal forecast from last month verified in just one day (
#Dubai
flooding)
3
10
84
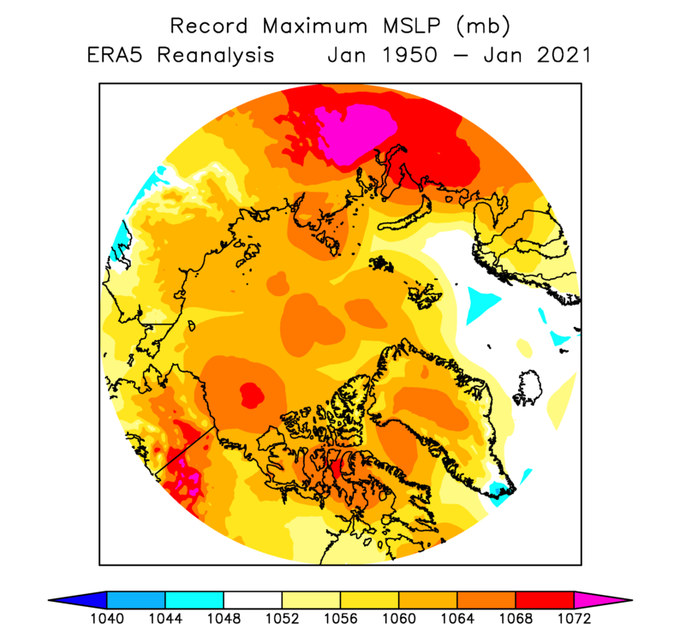
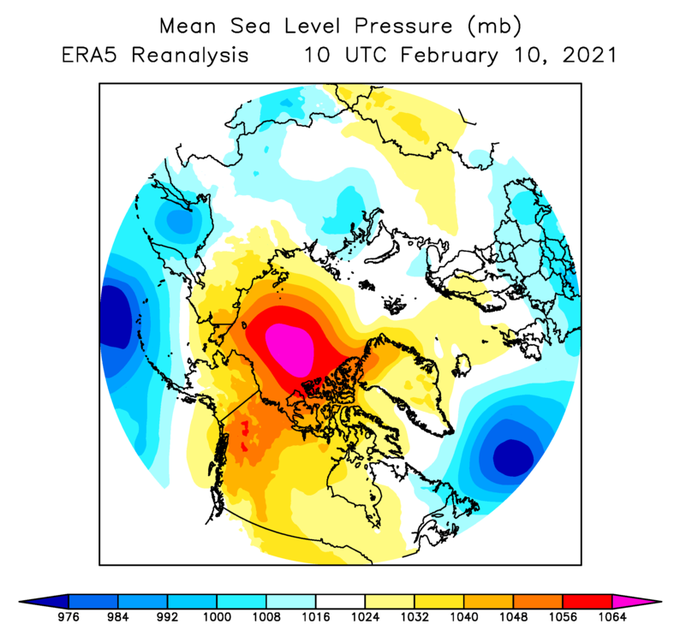
Models show the current 1060+ mb high north of Alaska strengthening to about 1070mb by Wednesday - this would break the ERA5 record for high pressure over the Arctic Ocean (1950-present). The current ERA5 record is 1068.6mb on Jan 5, 1970. Forecast image from
@TropicalTidbits
4
23
79
Phase 6-7 MJO and a weak stratospheric polar vortex: now that's interesting. Extended GEFS has been pointing this way for the MJO since late December. Here's a quick analog perspective on potential impacts:
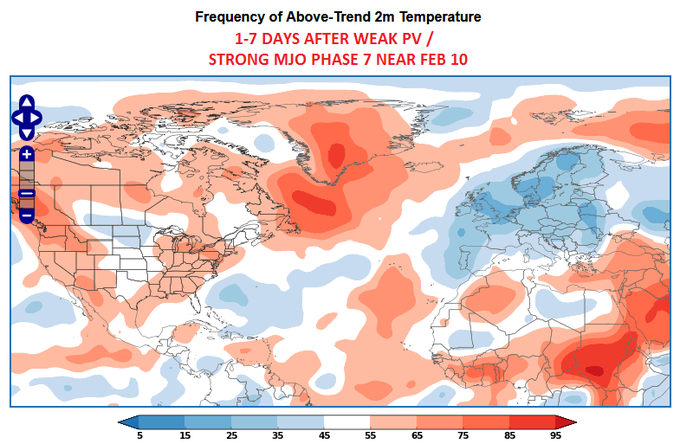
4
18
79
Lots of interest in the stratosphere in recent weeks, as the models ebb and flow with their predictions of vortex weakening.
If we find the top historical analogs to last night's EC46 "polar cap height" forecast, it turns out 8 of 10 saw a SSW event in the next few weeks.
1
21
79
And that's it - the end of a very prolonged and significant La Niña. One for the history books.

1
28
78
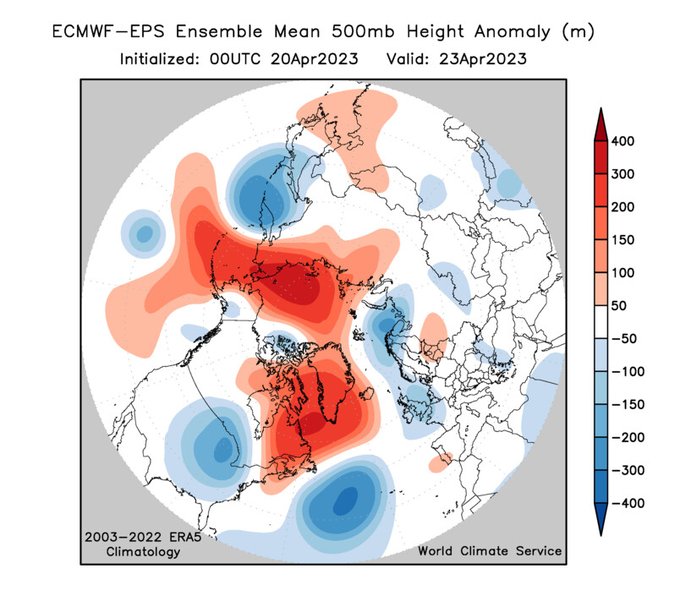
The April NAO index of -2.0 was the most negative on record (our calculation, EOF method). Blocking was heavily focused on the Atlantic sector, leading to rare cold in parts of Europe - unlike winter, which saw broader Arctic blocking and a -AO (more than -NAO) signal.
0
21
77
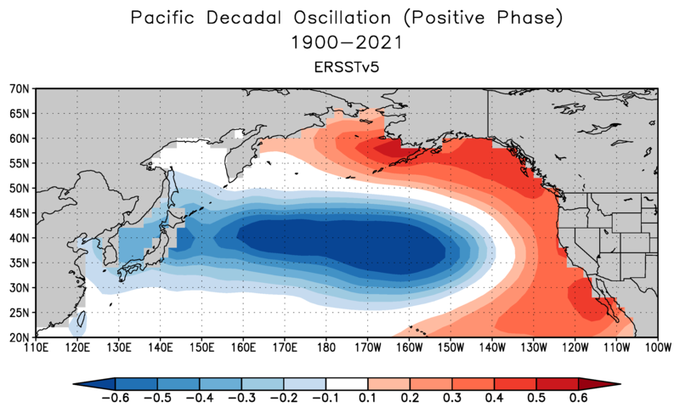
The PDO index remains significantly negative despite widespread warmth near the west coast of N America. How can this be? The answer is the *very* warm water east of Japan is dominating the index calculation: the western PDO loading is far more -ve than the eastern loading is +ve
2
22
77
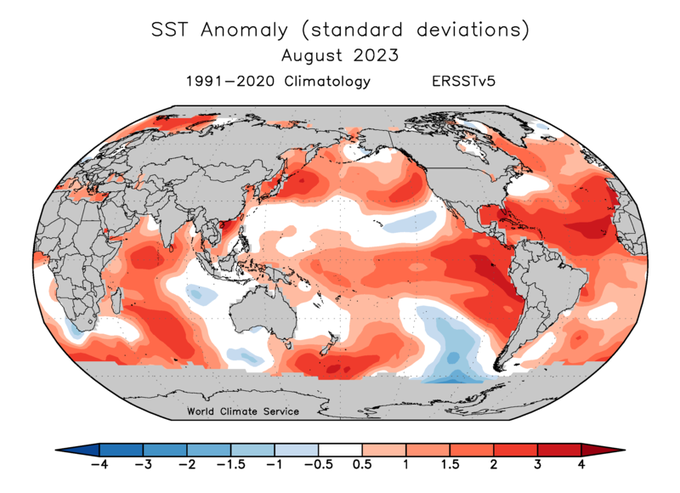
August SSTs show numerous areas of very unusual warmth relative to a 1991-2020 baseline, including:
- Enormous Atlantic + El Niño warm pool
- Record warmth near Japan
- Western Indian Ocean (positive IOD emerging)
- SW Pacific south of New Zealand
- Arctic (Barents Sea)
4
29
76
Judging from the CanSIPS update, this month's seasonal models may finally stabilize with their El Niño forecasts, rather than trending stronger yet again.
The CFSv2 also looks unchanged for ENSO this summer - but the North Pacific has a much more negative PDO in recent runs.
10
11
75
The July Niño3.4 SST anomaly came in at +1.0°C (ERSSTv5, 1991-2020 baseline).
This is about 0.3-0.4°C behind what the seasonal model consensus indicated in late spring... "strong El Niño by late summer" was too aggressive.
But the big picture is unchanged, warming resumes soon.
6
16
73
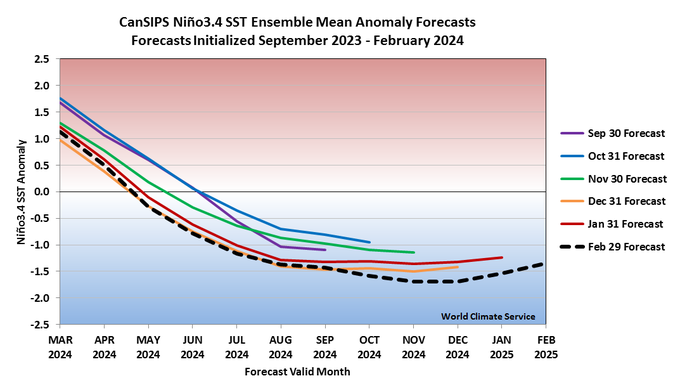
The latest CanSIPS forecast again shows La Niña re-intensifying into N Hemisphere winter - no surprise, given the current round of intensification/easterlies in the tropical Pacific.
3
21
73
Perhaps no surprise at this point, but this month's CanSIPS summer forecast is much wetter for NW Europe. Surprisingly cool temperatures across northern Europe too: it's unusual to see seasonal mean temps near or below the old 1981-2010 climate in these models.
2
20
71
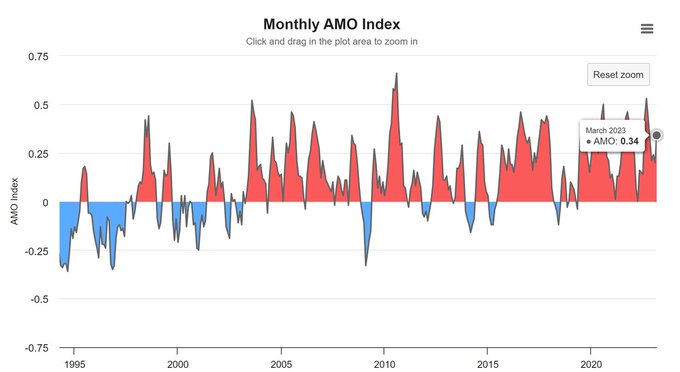
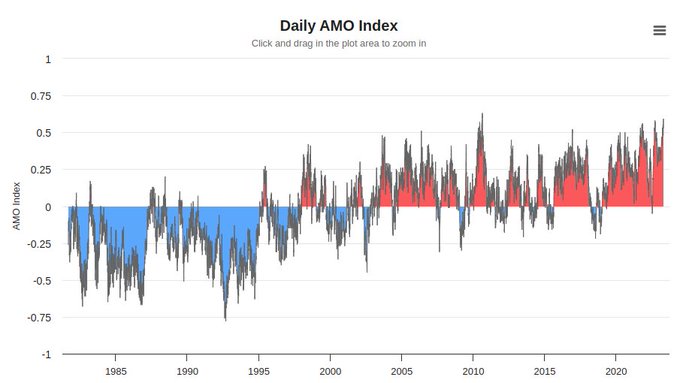
For those who follow the AMO index (not currently updating at NOAA/PSL), we added monthly and daily AMO data to our product, calculated independently.
March AMO value +0.34, the highest for March since 1945. Interestingly the mid-1940s was a multi-year La Niña period as well.
3
20
73
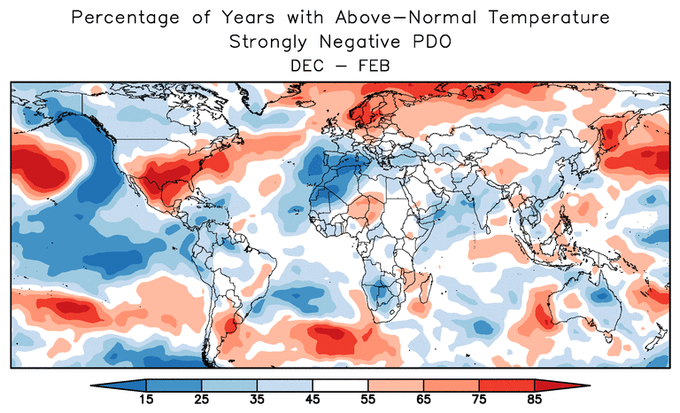
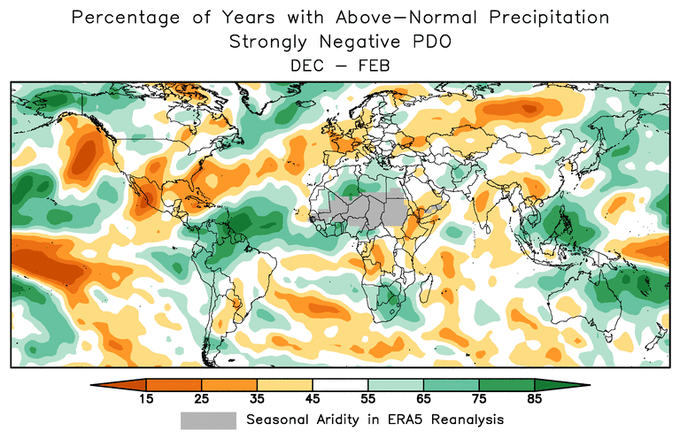
Dramatic SST changes in the North Pacific in October took the PDO index down to -2.2, the lowest since 2011.
Negative PDO winters have distinct tendencies around the Northern Hemisphere, closely related to La Niña influences of course.
1
20
70
If we look at the Atlantic/European side of the Arctic, the negative NAO/AO phase now occurring seems clearly connected to the February stratospheric vortex disruption. Surface impacts 2+ months later!
The Pacific side, on the other hand, has seen a trough for the past month.
3
20
71
Here we are 20 days after the sudden stratospheric warming onset, and the high-latitude lower-atmosphere response appears to be peaking right now.
The relatively predictable negative AO phase after these events is a key reason why we follow the winter stratosphere so closely.
1
25
74
This isn't the whole story of course, but the now-strongly positive IOD certainly favors a more westerly pattern for northern Europe in early winter: warm, wet, and windy.
Contrast El Niño winters with +IOD versus near-neutral IOD:
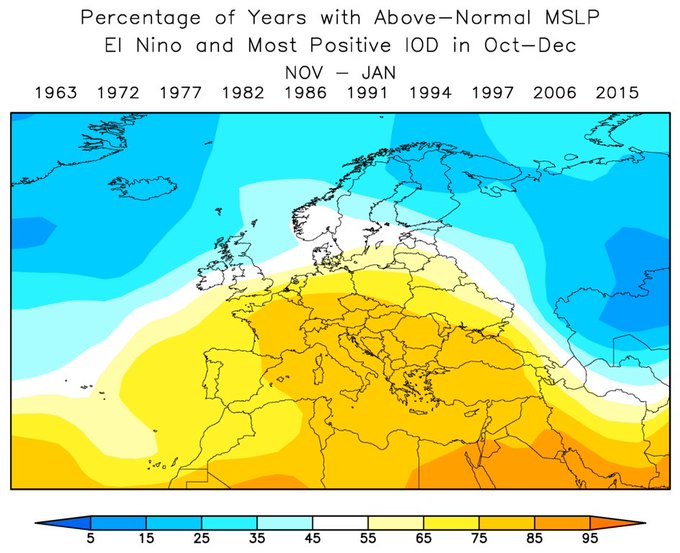
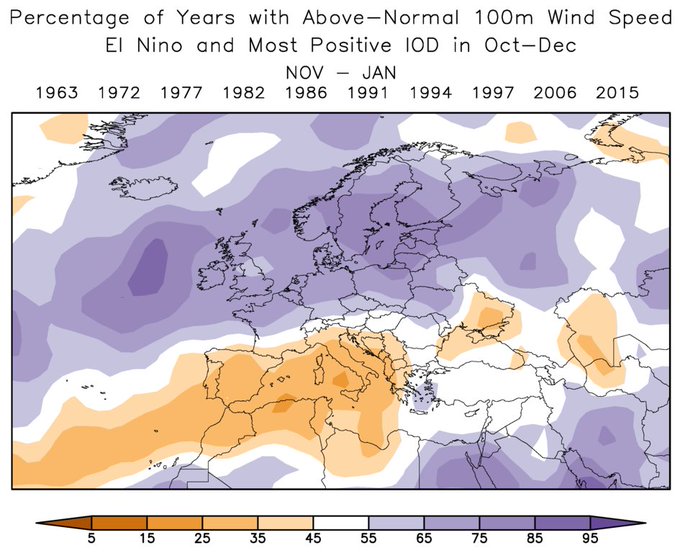
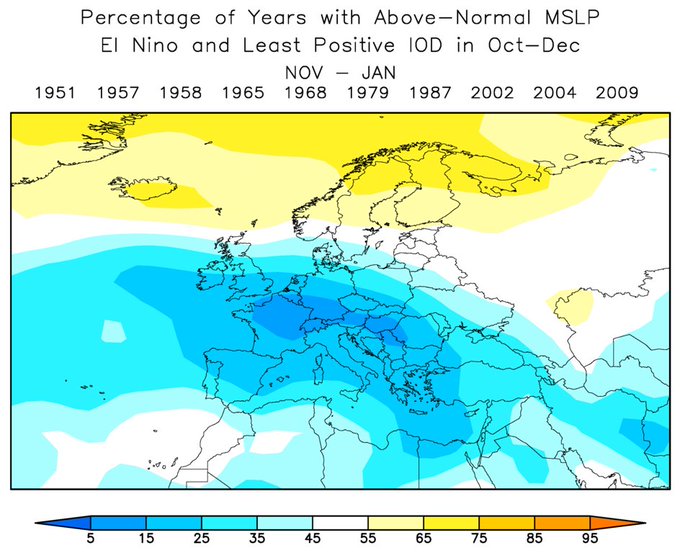
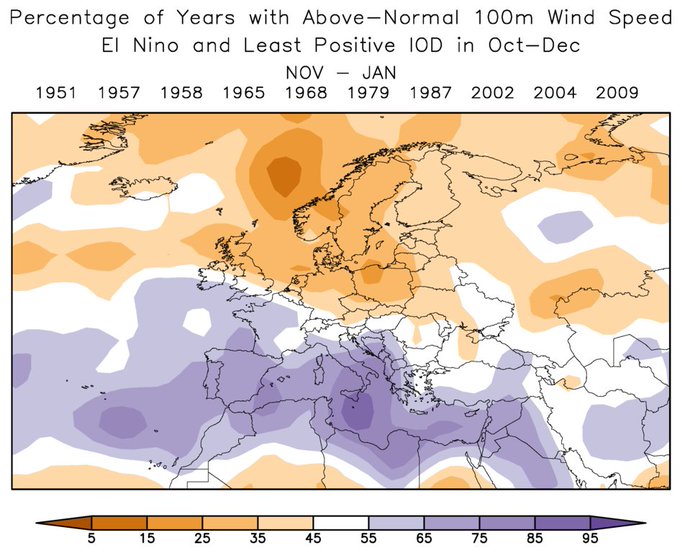
2
19
73
Last night's EC46 forecast suggests a more sustained El Niño-like pattern of wind and convection across the equatorial Pacific in May.
Currently we're seeing the second major westerly wind burst of the ENSO transition, but eventually the El Niño circulation will become dominant.
6
20
71
Last week's Arctic high pressure did verify as the strongest on record over the Arctic Ocean in the
@CopernicusECMWF
ERA5 data (1950-present): 1068.8mb at 10 UTC on Feb 10. This is directly linked to the strongly negative Arctic Oscillation and U.S. extreme cold outbreak.
Models show the current 1060+ mb high north of Alaska strengthening to about 1070mb by Wednesday - this would break the ERA5 record for high pressure over the Arctic Ocean (1950-present). The current ERA5 record is 1068.6mb on Jan 5, 1970. Forecast image from
@TropicalTidbits
4
23
79
1
39
72
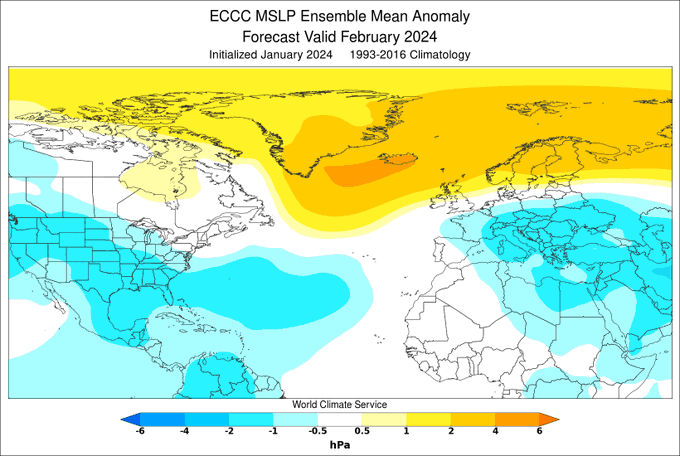
Looking at tonight's extended-range forecast, I'd say the seasonal model guidance from earlier in the month (released today by
@CopernicusECMWF
) has been "overtaken by events". The German model was a lonely outlier with a negative AO phase for January (now looking quite likely).
5
10
71
Something's amiss with the just-released NMME forecast - the multi-model SSTs are cooler than any of the component models across the North Pacific. The central N Pacific (and east Atlantic) should be much warmer.
4
13
70
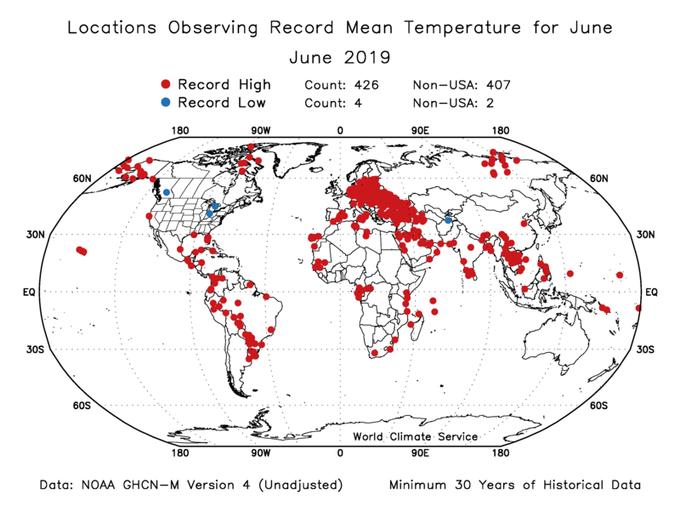
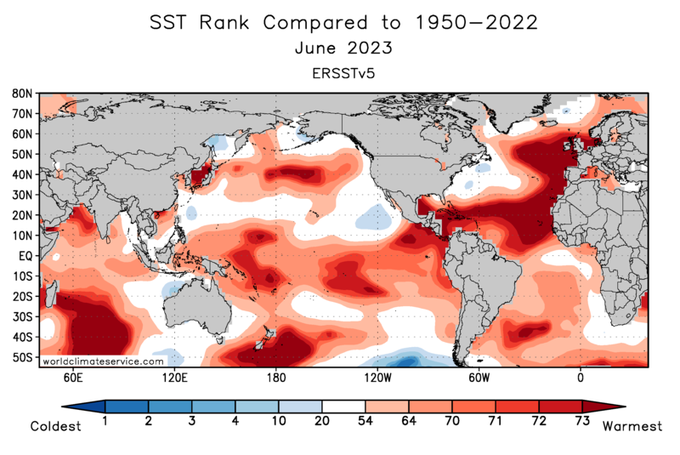
Out of 5478 sites worldwide with at least 30 years of data, only 4 reported a record low monthly mean temperature last month. In contrast, over 7% of sites observed their warmest June on record. GHCN-M data courtesy of
@NOAANCEIclimate
3
53
71
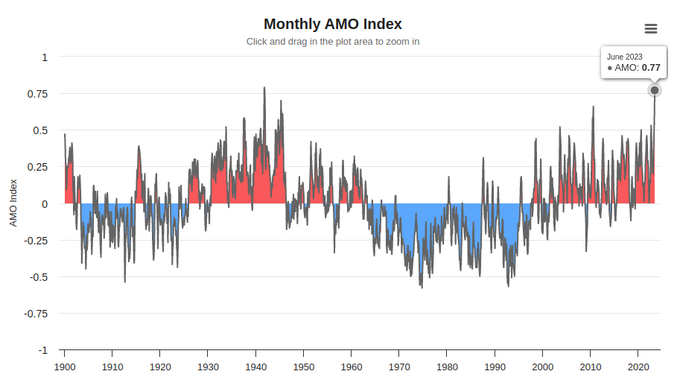
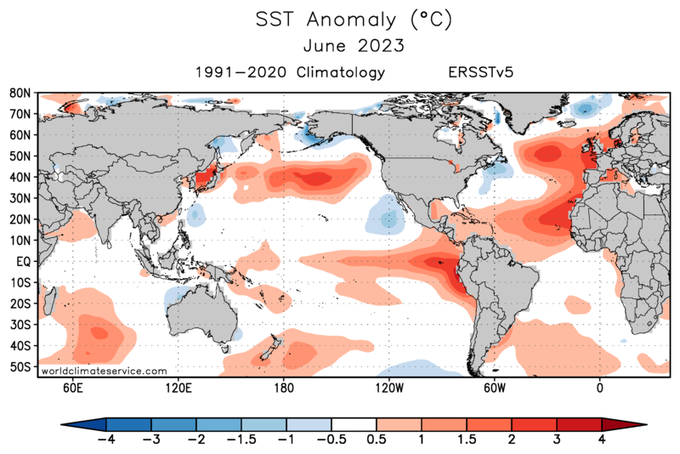
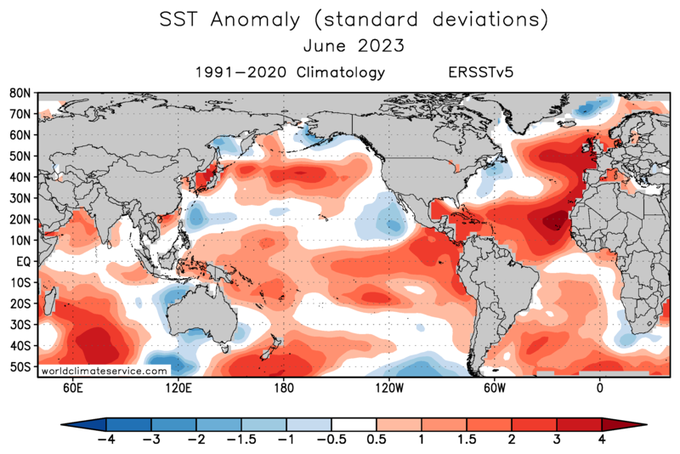
With El Niño emerging, the western tropical Pacific was no longer record warm in June... but the main SST story is of course the record warmth in the Atlantic.
The June AMO index of +0.77 is exceeded only by October 1941. (Our calculation. Note that the AMO is detrended.)
1
16
71
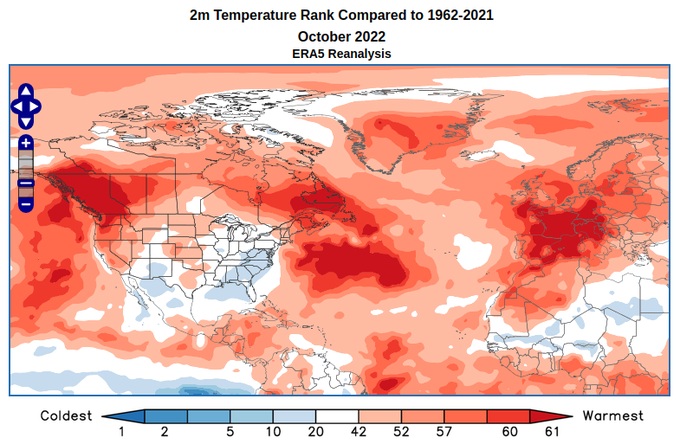
October was the warmest in at least 60 years for large parts of western/southwestern Europe and both western and eastern Canada, according to
@CopernicusECMWF
ERA5 data. In contrast, cool areas did not generally break into the coldest 10 for the 60-year history. Remarkable warmth
1
42
71
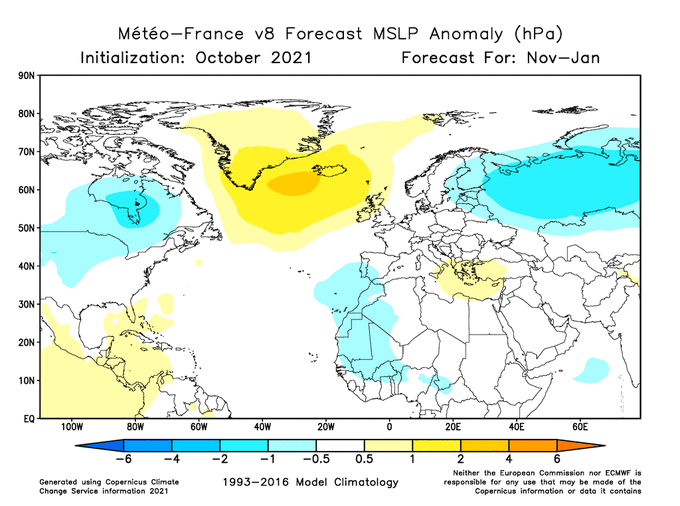
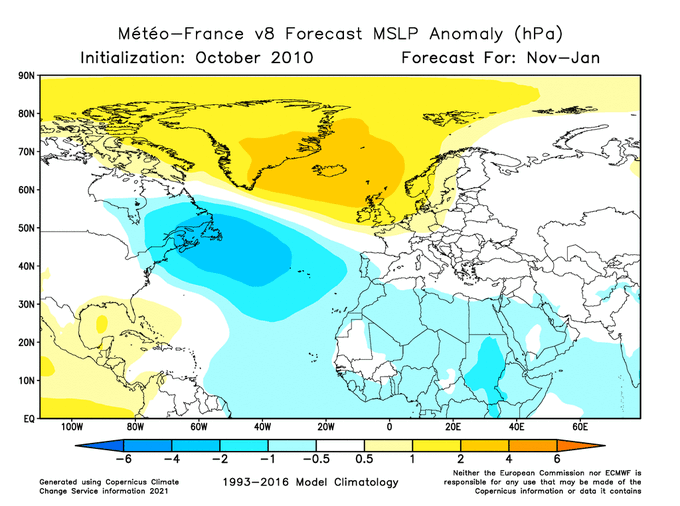
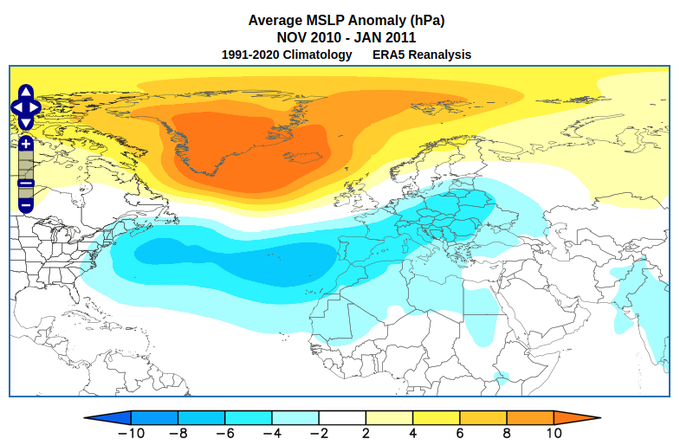
While most seasonal models are showing a generally mild, westerly regime this winter in Europe, the
@meteofrance
model differs, with a negative NAO phase in Nov-Jan. In hindcast mode this model did quite well in 2010, anticipating that notoriously blocked La Niña winter. (1/3)
2
11
70
The August SST-based AMO index from
@NOAA_ESRL
came in at +0.44, the 4th highest since 1950. The only higher August values came after significant El Niño episodes in the previous winter (1998, 2010, 2016), unlike this year. The western Atlantic in particular is extremely warm.
2
25
70
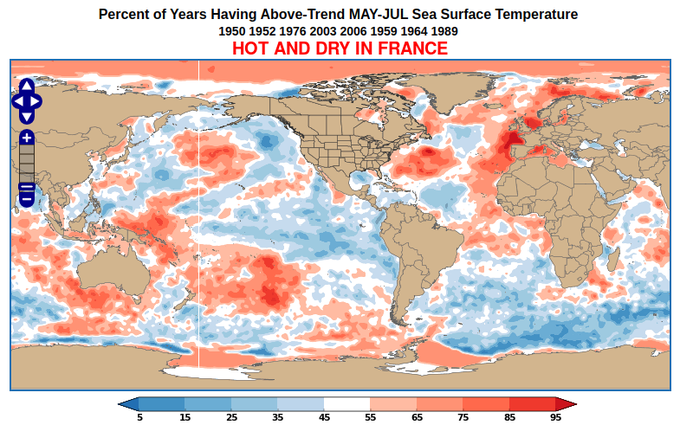
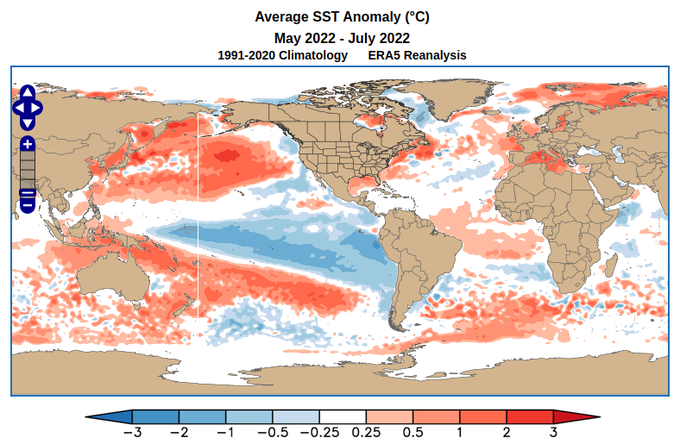
There will be volumes of research on the causes of this summer's heat and drought in Europe. Looking at past years with hot+dry May-July in France, SSTs show some similarity to this year in the Pacific (La Niña, -PDO) but nowhere near the North Pacific warmth we're seeing now.
4
20
67
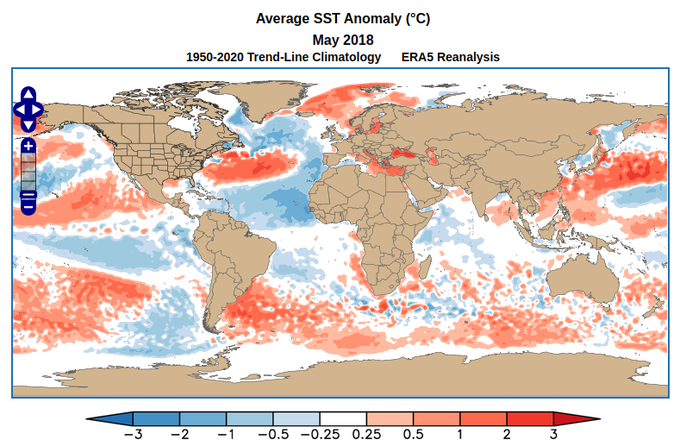
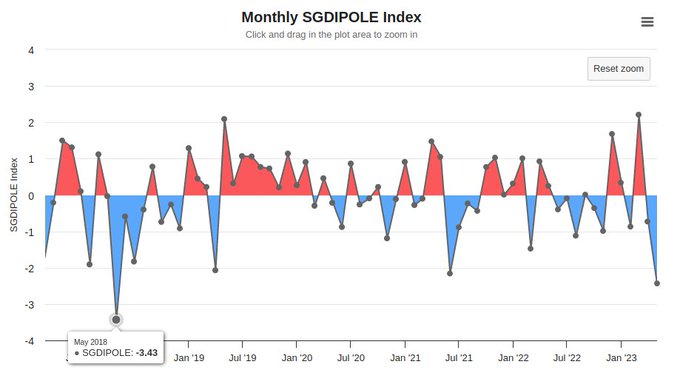
The Scandinavia-Greenland Dipole (of
@SimonLeeWx
) was strongly negative in May, after being strongly positive in March.
Since 1950, the only year with a similar reversal was 2018, but Atlantic SSTs could hardly be more different between the two years. This is very interesting.
5
14
69