
Tom Jenkins
@Tom__Jenkins
Followers
2K
Following
3K
Media
306
Statuses
2K
Researcher in molecular ecology and genomics 🦇🦞🪸. Creator and maintainer of #mapmixture R package. Founder of TJ Data Visualisation.
Exeter, England
Joined August 2016
My freelance data visualisation consultancy business goes live today!. Please have a look at my website below and get in touch to discuss a project. I build user-friendly, professional-looking web applications, dashboards and interactive maps and charts.

0
1
6
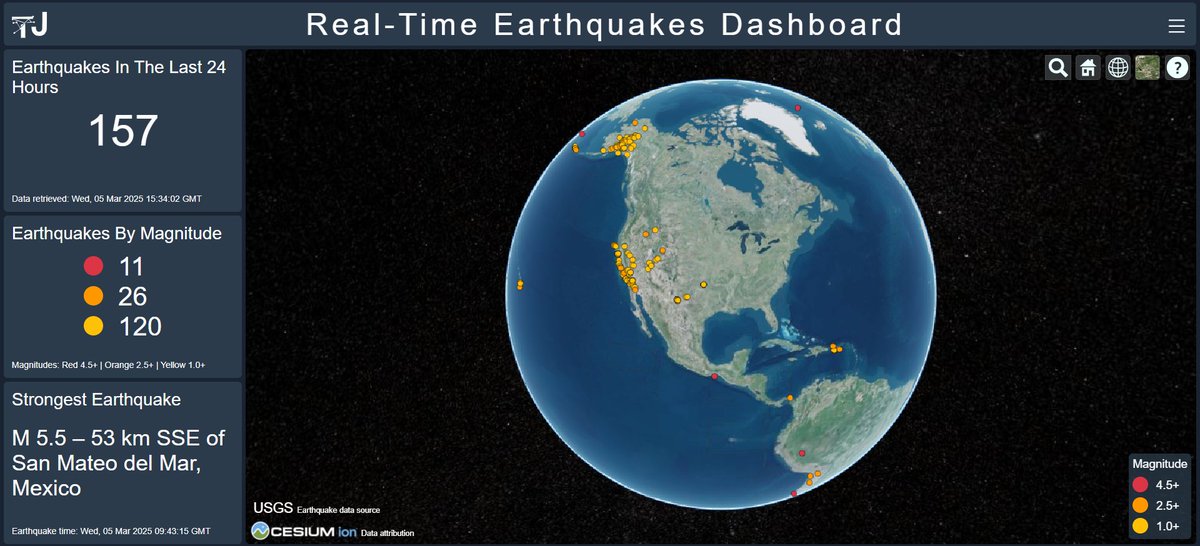
Explore real-time earthquakes in the last 24 hours or last week with this interactive dashboard. #earthquake #earth
0
0
1
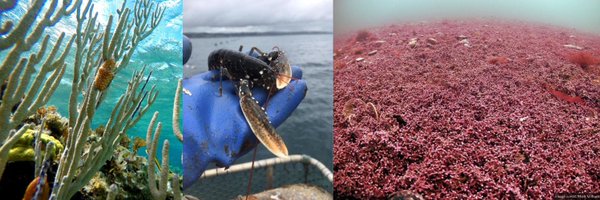
RT @Uni_of_Essex: We're so proud of @Dr_MTaylor of @EssexLifeSci as she leads an @SchmidtOcean and @oceancensus expedition to the remote #S….
0
12
0
I think I’d like a future job in app or dashboard development, because I really enjoy it!. Here is my attempt at a Real-Time Earthquake Dashboard using US Geological Survey and Cesium APIs.

0
0
3
Test data can be found here:. And the R package GitHub and CRAN pages here:.
0
0
0
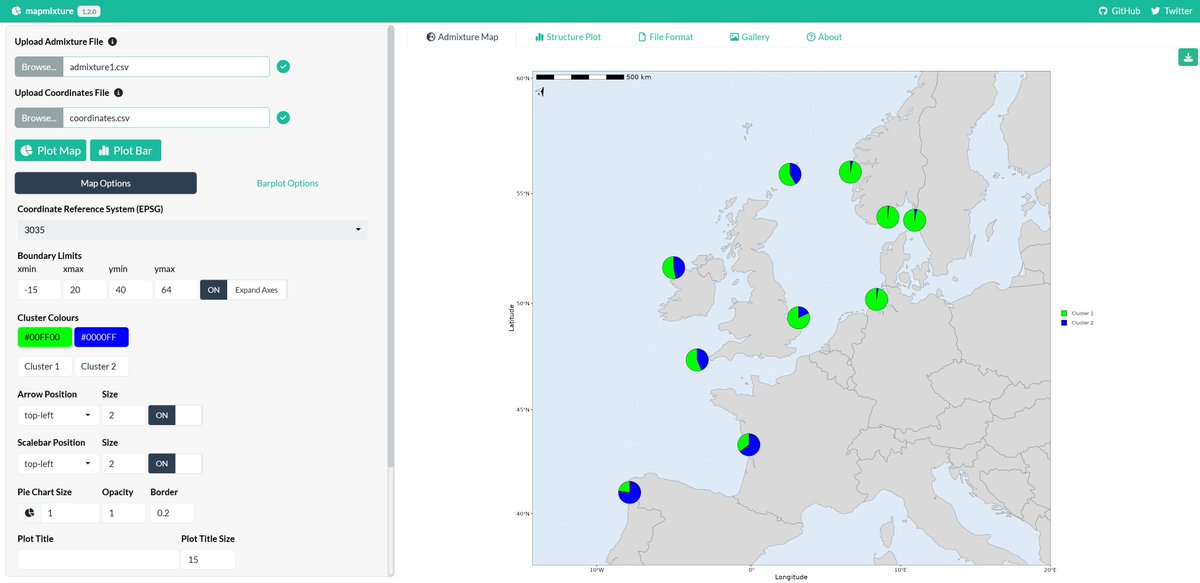
#mapmixture Shiny app. User feedback has highlighted the utility of this app for teaching admixture and doing interactive demos in lectures / practicals. Please give it a try!. • updated to version 1.2.0 (same as R package).• faster load times.
1
0
3
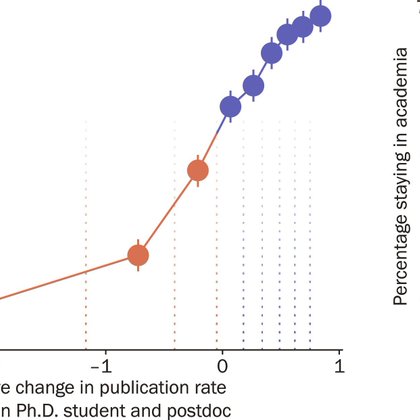
RT @maxplanckpress: More than 40 percent of #postdocs leave academia. Those who landed a coveted faculty position were more likely to have….
pnas.org
Postdoctoral training is a career stage often described as a demanding and anxiety-laden time when many promising PhDs see their academic dreams sl...
0
530
0
#mapmixture news: . Version 1.2.0 release includes option to plot pies of different sizes, and preserving the individual input order on the structure plot. Install from CRAN with install.packages("mapmixture").

0
2
9
Citation:. Jenkins TL (2024). mapmixture: an R package and web app for spatial visualisation of admixture and population structure. Molecular Ecology Resources, 24: e13943. DOI: 10.1111/1755-0998.13943.
0
0
3
#mapmixture R package plea:. If you have used mapmixture in your study, please could you cite the paper describing the package in your manuscript. It really does help to show that people are actively using it in their research and analyses!.

onlinelibrary.wiley.com
The mapmixture R package and interactive web app are tools to aid visualisation of admixture and population structure in geographic space. The purpose of mapmixture is to enable and encourage...
2
31
94
RT @R_Graph_Gallery: 🚨 Stop chasing the p-value!. Increasing your sample size will always yield a significant result. Even for trivial dif….
0
322
0
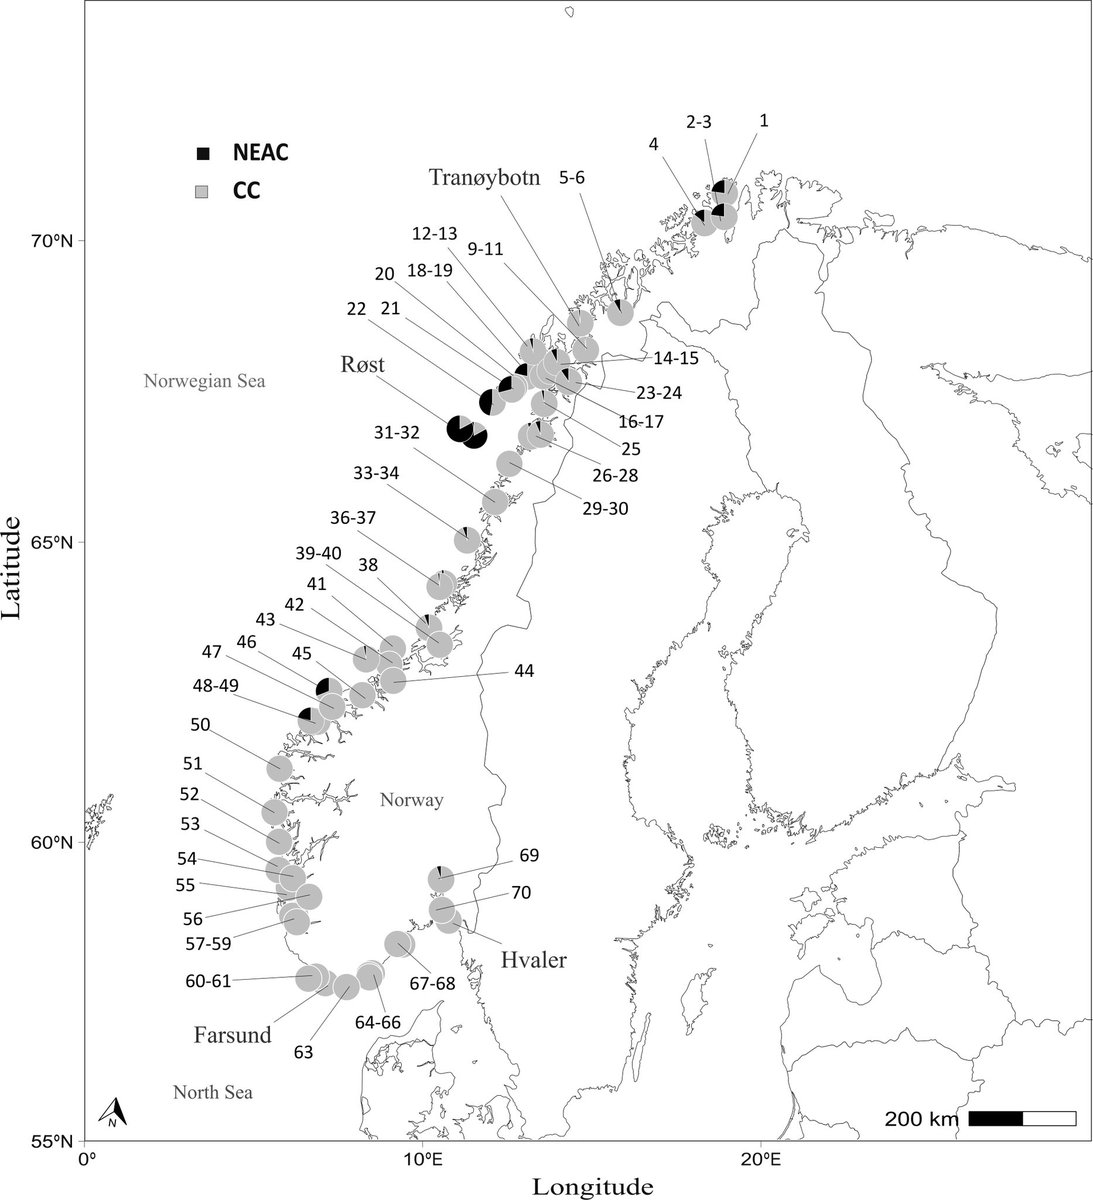
Great to see #mapmixture being used for maps other than admixture. This study used the R package to plot proportions of a sample with species ecotype X, and allele frequencies of cod across sites in Norway.

0
0
6
RT @alexraeder1: Window to stop decline of England’s nature closing fast, watchdog says
theguardian.com
Office for Environmental Protection calls for urgent action after finding government is falling short on most targets
0
4
0
RT @kat_clayton1: Paper from Christmas Island fieldwork is OUT !.Salinity does not affect late-stage in-egg embryonic, or immediate post-ha….
0
4
0
RT @socialseas: Can we address the issue of seafood sector labour shortages in 2025?. PLEASE TAKE THIS SHORT SURVEY [20 mins] if you work o….
0
11
0
RT @molecology: New in ME by @josephine_paris, @dr_andyking, @patbhamilton, @jcatchen, & @Fish_Genomics. RADseq & RNAseq reveal the basis o….
0
7
0
RT @oceansresearch: We’re hiring a 3-year #postdoc in statistical ecology in #Seattle. Apply your statistical skills to conservation & natu….
0
65
0
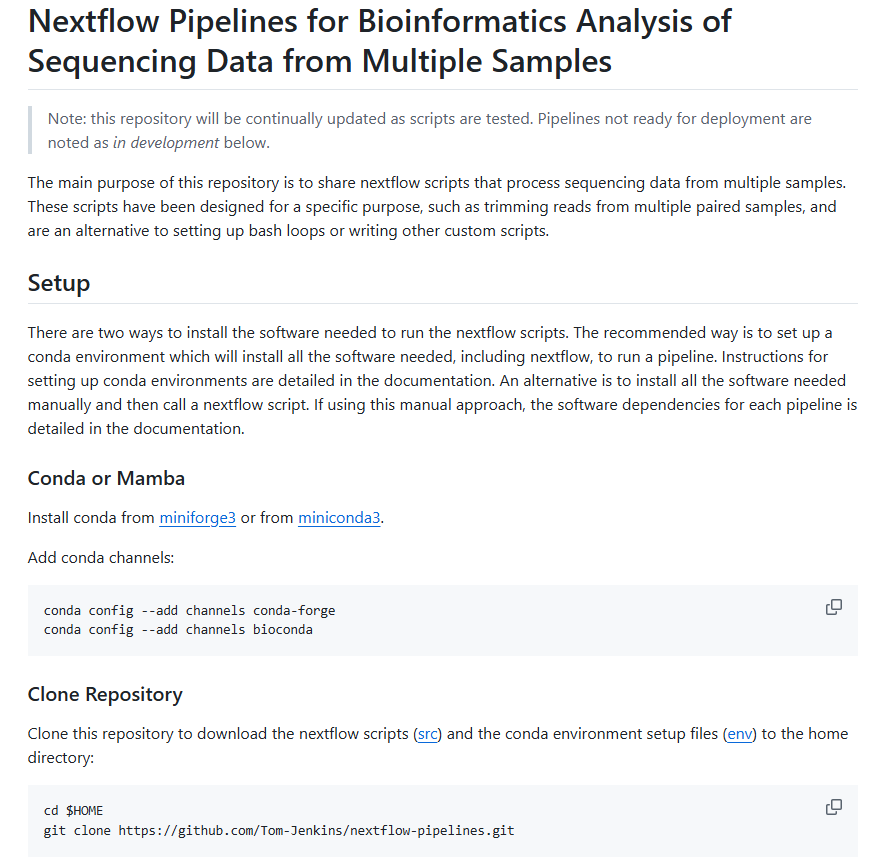
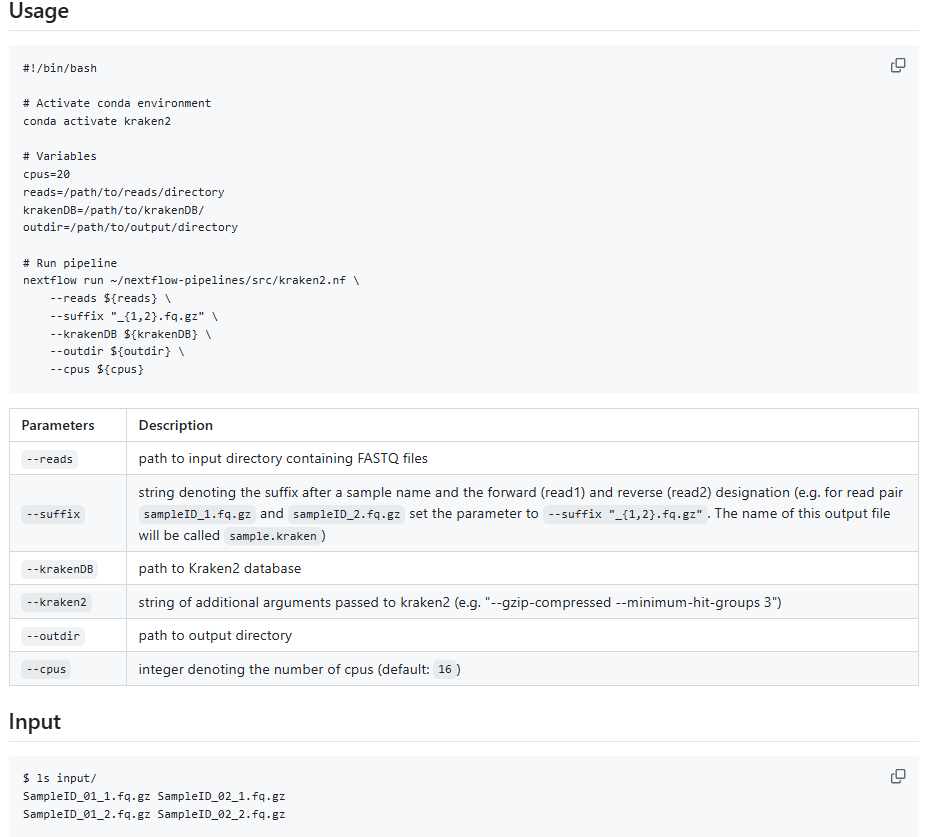
Pipelines with easy conda setup have been tested and are ready to try out, now with customisable input parameters. They are a simple alternative to bash loops or other means to run paired reads through routine bioinformatics tasks. Feedback welcome!.
0
2
6
RT @Tom__Jenkins: #mapmixture news:. version 1.1.4 release includes some extra options to customise the admixture map and structure plots.….
0
8
0
RT @donaldmcknight2: The informal poll results are in, & as I feared, most people are running ANOVAs in #R with functions that can give hig….
0
200
0