

Research Figures
@ResearchFigures
Followers
71
Following
45
Media
12
Statuses
28
Scientific Illustration Service for Academics 📊 🖌 💡 We create research graphics for publications, presentations, outreach and more.
Tipperary, Ireland
Joined October 2020
Research Figures is a scientific illustration service specialising in custom-made graphics for academic publications and articles. Take a look at our portfolio https://t.co/pHQfp6b7Zi
1
0
0
An #AppreciationPost today for @ResearchFigures who helped us with this remarkable logo representing our research interests and reflecting our #EDI goals of building a sustainable, inclusive and diverse research group. #ThankYou
1
2
5
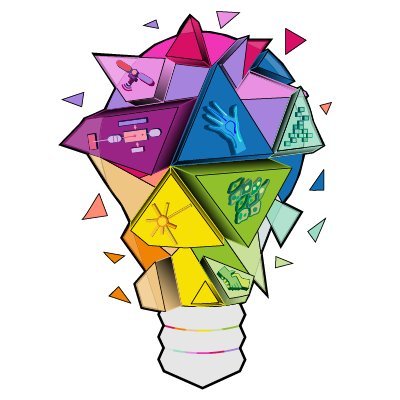
We have had an incredible 2022 and we have a new logo for 2023 and beyond. Tq to @ResearchFigures for the collab. Like the symbolism of a light bulb and motivated to build a mindful and inclusive community, we are looking forward to a fantastic 2023! 🎇🎇🎇 1/8 🪡🧵
3
2
13

🥳💡NEW LOGO💡🥳 Thank you @ResearchFigures 🤩
We have had an incredible 2022 and we have a new logo for 2023 and beyond. Tq to @ResearchFigures for the collab. Like the symbolism of a light bulb and motivated to build a mindful and inclusive community, we are looking forward to a fantastic 2023! 🎇🎇🎇 1/8 🪡🧵
0
3
10

Happy Valentine's Day! Here is a single heart muscle cell (cardiac myocyte)--which itself is shaped like a little heart--as seen through a microscope. #cardiotwitter #CellBiology #SciArt
17
383
1K

So proud of our new, amazing logo for the @ForensOMICS team! Thanks @ResearchFigures for doing such a great job! We are all in love with it! #UKRIFLF
2
1
10
DNA in the nuclei of four cancer cells photographed through a microscope. #CellBiology #Microscopy #SciArt
7
106
724
0
3
5

Back with her second in a series, @courtmarchese7 curates her favorite examples of #information #design and #dataviz that aids in the public understanding of #COVID19
https://t.co/ybYEsWVyHC
#DataVisualization #publichealth
0
13
42

This work by @fcrameri is critical to effectively communicating science! Understanding how a colour palette represents your data, or how it can introduce bias, should be a major consideration when visualising data. Colour maps: https://t.co/mpUoiOYnPy
#scientificrainbow
0
2
3

"The prospect of routinely seeing visual encodings in & alongside text is very exciting for people who love #DataVisualization " If this sounds like you, check out @alecbarrett 's review of @rkbrath 's new book, Visualizing with Text, in Nightingale. https://t.co/bG115TT1zY
1
4
25
Another Academic Avatar, our very own Dr Pete Griffith - Quaternary Scientist and Illustrator 🧐🌿🖌️
0
1
1
Trying out some Academic Avatars this week Here’s @SharkDevocean @seismic_kiwi We’ll add some more examples to our website soon! If you’d like an avatar in the meantime DM or email us 🙂contact@researchfigures.com They cost €30 and we can customise them however you like! 🖌️
0
2
0