
Professor Hugh Akston
@ProfessorAkston
Followers
6K
Following
18K
Media
4K
Statuses
10K
I have a strong math, CS & radiology background for a clinician. I teach understanding medical statistics/EBM.
Joined August 2020
I haven't made this chart for a few months as when I did the x-axis some years back I thought the insanity would stop by 2025. I was wrong. No end in sight to excess-non-COVID mortality*: 805K. ACM excess: 1.85M.ENCNC @ home: 581K.ENCNC @ med. fac.: 404K. *chart in reply

If you died of COVID, you died in a medical facility, likely jabbed, boosted and God-only-knows-what-TF-else you got. CMS fee-bump grift all-the-way-down. There are many orthogonal ways to measure excess natural-cause-non-COVID mortality (ENCNC). The signal is unmistakable

5
43
99
Methods: the relative index chart shows the abrupt divergence in the relationship between UCoD and MCoD brought into stark relief over the 25 year monthly data corresponding to the moment of The Guidance issued to that effect from the CDC. We leverage this highly correlated


0
0
8
Using long-standing, highly-correlated relationships between cancer UCoD (died of) and MCoD (died with) we estimate the extend of excess cancer mortality concealed under other ICD codes:. MCoD Excess: 123K.UCoD Excess: 100K. methods and replication of relative index chart in


Concealment of Cancer Mortality under other ICD codes continues at the behest of specific agencies. Beware he who would deny you access to information, for in his heart he dreams himself your master.

3
28
72
Hey @rustyrockets, 2020 called. Please catch up.

@rustyrockets The first actual hypothesis on this is outlined here:.
5
17
117
RT @ProfessorAkston: @WarClandestine Arrgghhhh. still with the "origins" @WarClandestine, @DNIGabbard?. People have been "dying of COVID"….
0
1
0
Hi @combatcarl8, as we look at our estimates of excess cancer mortality across the pooled age-groups (second chart), we are incorporating the negative excess cancer mortality of. say. the 85+ group (first chart) that died early of cancer and other causes, here 33K of negative


@CombatCarl8 Not sure what you are asking. But, PFE will give way to the intrinsic rise in cancers in those who would not have gotten cancer without the mRNA vaccine, yes. That cohort is already in elevated cancer, however, that fact is simply concealed in part by the PFE. This will only

0
0
3
Working independently and using different methods, we have two estimates at 100K and 120K excess that bracket the 111K excess estimate from TES. The signal is clear and has been present for years from several analysts. Hard to believe they haven't pulled the jabs off the market

Remember:. Cancer mortality/treatment/diagnosis are currently showing a slight upward signal with mild acceleration. Avoid terms like skyrocketing, soaring, exploding, or booming - these only provide ammunition for those looking to dismiss legitimate concern as disinformation.
12
169
356
I still find estimating U55 excess cancer mortality to be tricky and model dependent, but there is no denying the signal over the 20 years of prior data. Using two different methods that track each other well, we find ~5.5K excess deaths in that age-group that shows no evidence

🚨 Cancer up 44.2% in 0-54 age bracket. 🚨. This is 7,500 more deaths and 13%-pts higher since we ran this chart 19 weeks ago. A persistent break in the well-established downtrend in this mortality prior to 2021. We are just gonna twiddle our thumbs and let this happen. 🤨

5
3
18
If @elonmusk can't fix it that should tell us all something: "they" are going to do what they're going to do. All we can do is prepare.

"Nothing stops this train" is not a cynical view at all. It's an acknowledgement to not stress about what you cannot control and what is nearly inevitable, so that you may instead focus more constructively on things you can control and that can be changed.
1
1
7
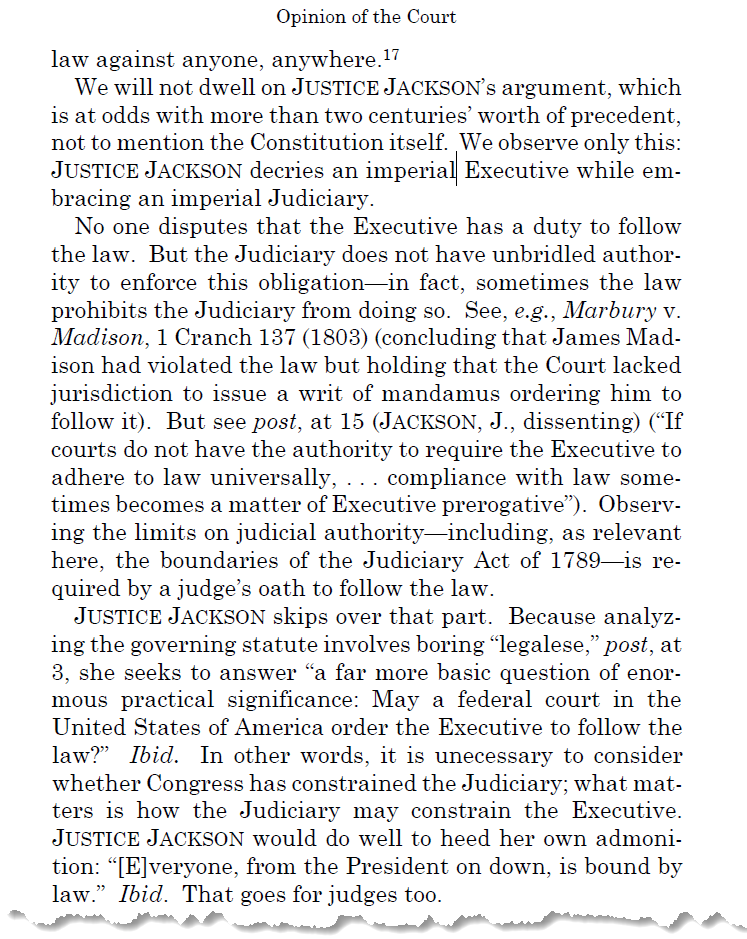
Looks like someone is getting tired of dealing with her and she still won't STFU. Her picture should be in the @Wikipedia entry for Dunning-Kruger. 🤣. "JUSTICE JACKSON, however, chooses a startling line of at- tack that is tethered neither to these sources nor, frankly, to any


0
2
3
RT @Kevin_McKernan: I confess to being concerned that they would rotate this panel with more @SenBillCassidy cronies but I know @RetsefL @M….
0
169
0
RT @ProfessorAkston: The Z-scores are one measure of deviation from trend, giving a sense of "is this deviation within reasonably expected….
0
2
0
RT @ProfessorAkston: @EthicalSkeptic Non-PFE estimates at ~1.3M, conservative (50% of 52WMA non-PFE excess) baseline adjusted PFE estimate….
0
13
0
No one needed to anything. Old account. Note the date:


No one needed the COVID shot.
3
0
10
Perhaps some initial IXX circulatory mortality may have been blamed on COVID or "more afraid of dying of COVID than dying" and staying at home.*. Yet the continued, 3+ years of unabated divergence and rise of both imputed UCoD and MCoD mortality from flat/nearly zero "COVID"


The rise in cardiac deaths between covid waves clearly begins after the vaccines. Vaccines which cause intravascular inflammation, heart inflammation and scarring. Yet, apparently it's baffling and we should blame diet and exercise.

1
10
14
The Z-scores are one measure of deviation from trend, giving a sense of "is this deviation within reasonably expected random variation, or is this maybe something else?". We see 10+ years of history from 2009 - 2020 with Z-scores largely centered around zero, but nudging 2 in

1
2
4
In this pair of charts we show one method of performing a PFE baseline adjustment to our combined well-fitting model (0.87) with cumulative excess and z-score estimates. A one-liner for understanding PFE may be thought of as:. "If you have 100 people in a room and 5 die per

@USMortality That is why we use z-scores, to index the variance inside a cohort against past history. A sigma across a defined range is a z-score. A z-score of 1 or 2 can be explained by happenstance. A z-score or sigma of 12 however, cannot be dismissed by rhetorical address. It is a

2
4
8
While we're using completely different methods for excess cancer deaths, we're getting the same sign and similar magnitudes. As my estimates do not correct for PFE, and in this all-age-group-pooled estimate, the magnitude is reduced by negative excess in heavily PFE'ed groups,

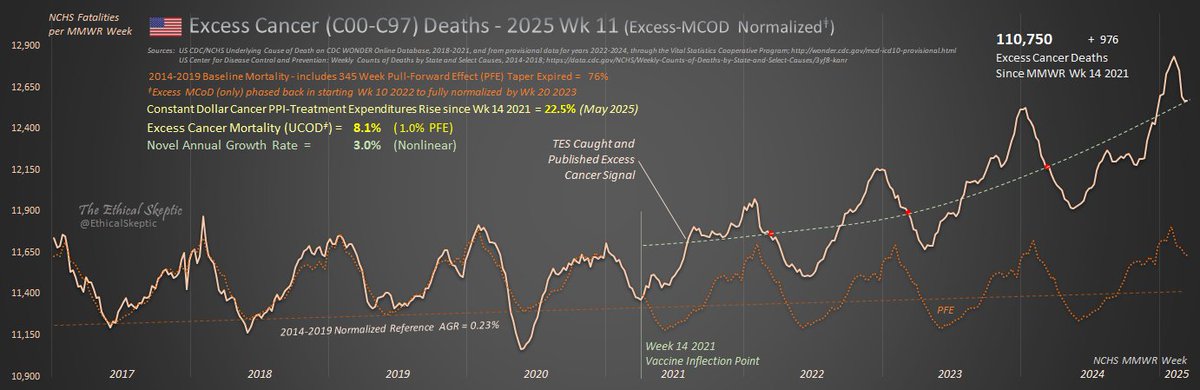
These are the actual cancer deaths by week for the US. 1. I have corrected NCHS/CDC data collection errors here, in coordination with NCHS/CDC analysts (who are not allowed to make such corrections in the data). 2. I have added back the MCoD 'hidden cancer deaths' that the

7
89
239
There are many points to make here with these ASMR-style analyses that fail to correct for #2 (below), nor acknowledge, let alone correct for #3 (below). A decrease in the rate of decrease can be an inflection over trend and may point to excess. 2. I have added back the MCoD

Look at this. Even the graph-grifter trolls get the same young cancer inflection with the vaccine rollout as I get in my DFT charts, and as well the PFE dip in the 85+ ages. Even cheating, with quashed high school graphs, annualized and shorted figures, hiding part of the cancer

1
10
39
Scott and those like him will make the same mistakes next time as well, as he thinks this was some sort of "bet" with winners and losers. We all lost. He sees this as some sort of "heuristics" vs. "fancy analytics" dichotomy. No. Seen through the Bayesian lens, "don't trust

1
6
21