

Nadieh Bremer
@NadiehBremer
Followers
47K
Following
18K
Media
2K
Statuses
11K
Award-winning Data Visualization Designer | Founder of Visual Cinnamon | Graduated Astronomer ✨ | Author of "CHART" & "Data Sketches" | 🇳🇱
Arnhem, The Netherlands
Joined January 2011
📈 Data Visualization.🎨 Data Art.💻 Generative Art . I ❤️ creating it all!. Here's some of my favorite (client & personal) projects over the past years, incl Scientific American, Google, Sony Music, The New York Times, UNESCO & more. All my work & art 👇 .

14
22
184
RT @Datawrapper: 📚 Ready for the next book club discussion? We are!. 📆 On August 18th at 4pm UTC, we’ll be diving into "CHART" by @NadiehBr….
www.datawrapper.de
We’re very excited to announce the next book for our book club: Read “CHART” by Nadieh Bremer with us!
0
2
0
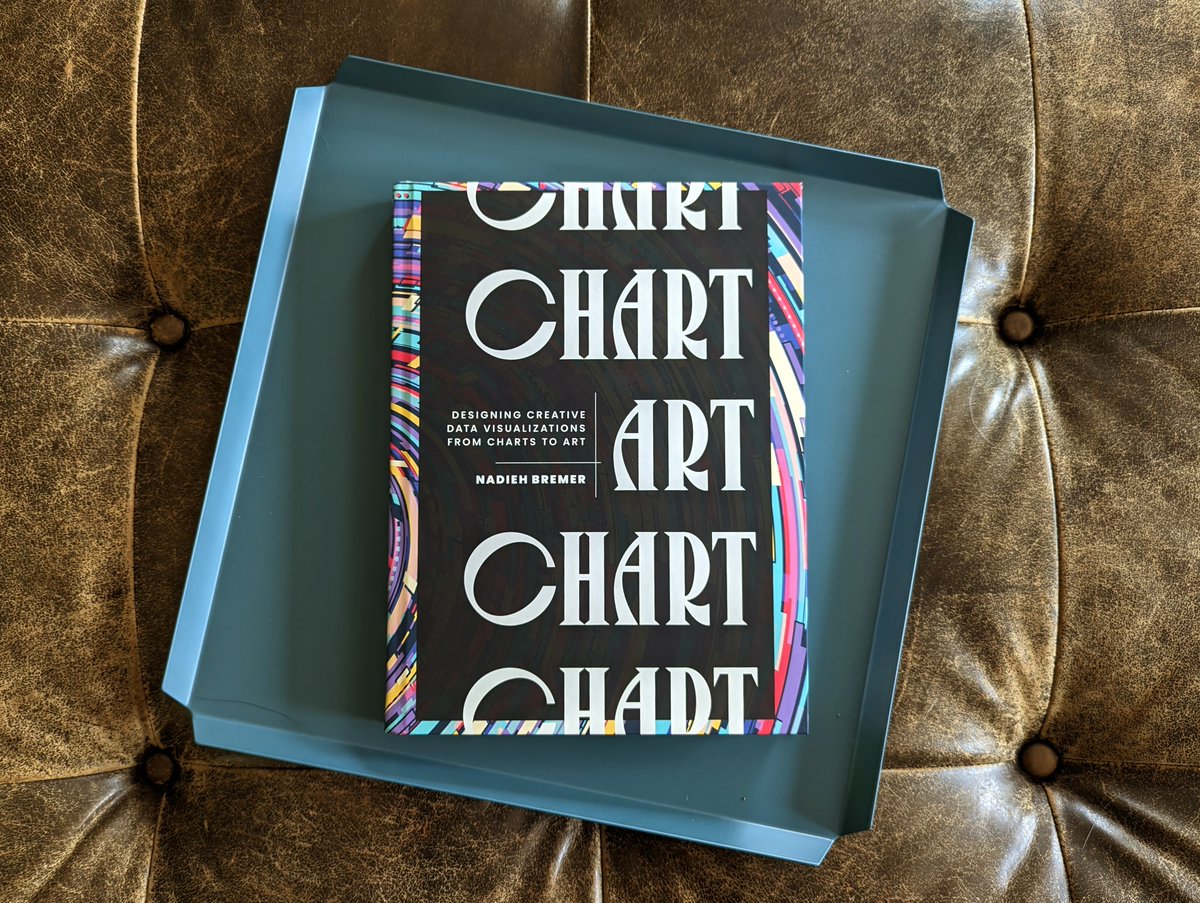
So happy to also see the proper (i.e. not printed by Amazon. in B&W. ) version of CHART appearing on people's doorsteps :D.

Look what just arrived! Congrats, @NadiehBremer—your new book is gorgeous & positively brimming with ideas for anyone who loves #dataviz. Two words: highly recommend!

2
2
51
(PS: If you've ordered via Amazon longer than 2-3 days ago, you probably got a print-on-demand incorrect version of the book, probably in black and white. I'll also talk about this, but in short, you'll want to order a replacement, as the one you have is "defective").
0
0
1
As I do not yet have my own copy of the book, in case any of you have received it already, I would LOVE it if you could send me some photos of how it looks, so I can share these during the party as well! 🤗 . Hopefully see you tomorrow!

2
0
1
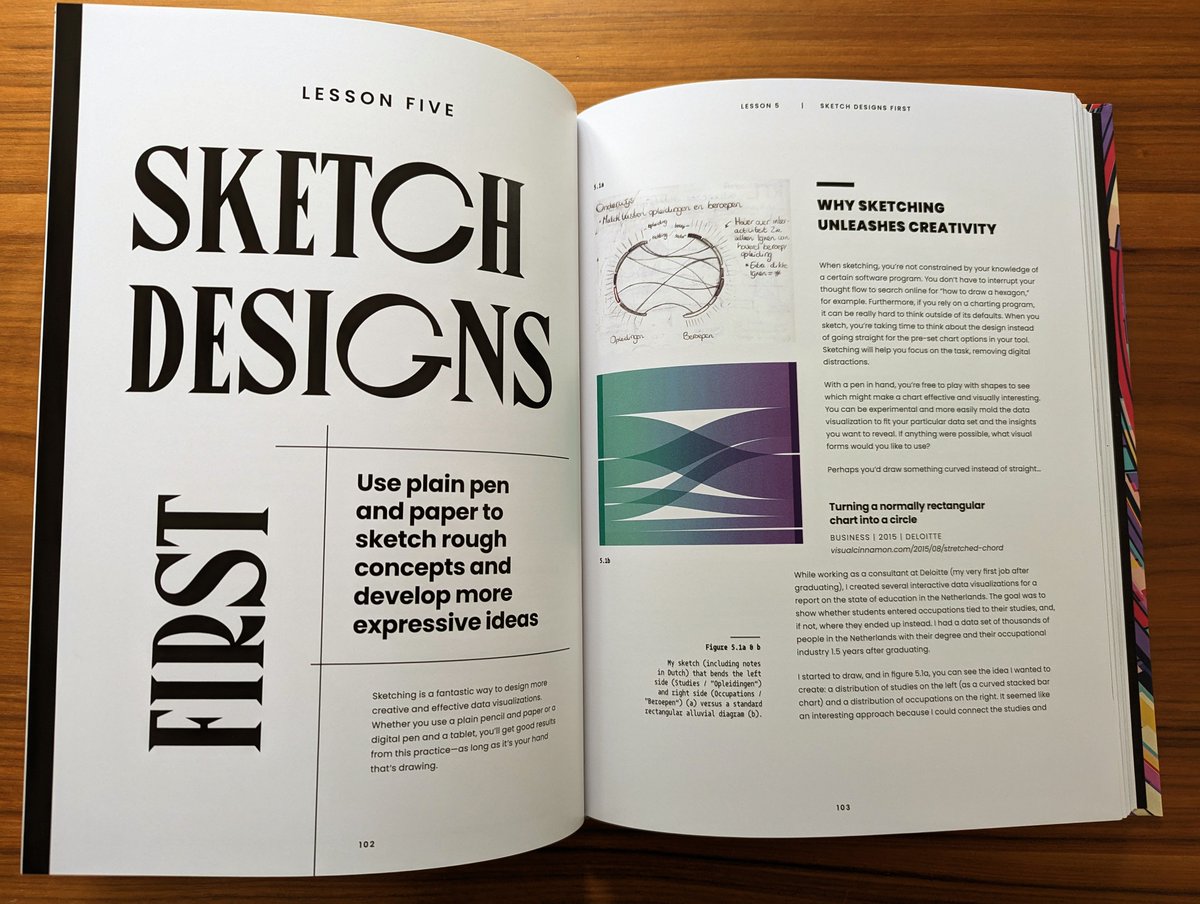
I'll show you more from the book's inside, talk about the different lessons, and Julie Brunet will make a guest appearance and show never-before-seen works in progress on the design of the book. And you're free to ask questions of course!

1
0
0
As CHART began as a keynote talk for Outlier conference in 2023, it felt fitting to have a little (virtual) launch party as Outlier is happing this week as well.

1
0
0
ICYMI but "CHART: Designing Creative Data Visualizations from Charts to Art" is officially released and I'm having a virtual launch party tomorrow at Outlier conference 🎉 Come join me tomorrow at June 11th, at 09:30 PST / 12:30PM EDT / 18:30 CEST! 😃 🧵👇

2
3
31
📣 NEW WORK! . Making the invisible visible. I'm thrilled to share the data art system I created for the @EnvDefenseFund that reveals how much methane was added to the atmosphere for each year that you've been alive. Create your personal Methane circle:

3
8
41
It’s #TimeForCH4nge ✨. Excited to speak at the launch of the European Civil Society Observatory on Methane, revealing a new data art system I created!. Exploring how data, science & art can drive action to cut methane & slow #GlobalWarming. 🔗 Register

0
1
15
RT @EnvDefenseEuro: It’s #TimeForCH4nge ✨. 📆 On April 7, Civil Society across Europe is mobilising to tackle methane & pull the emergency….
0
2
0


It's apparently been over a year, but I just published a newsletter again! Read about several of the new projects I've released since then (and then there's the new book of course, minor thing ;) ).


1
2
13
It's been a _very_ long time, but I finally wrote an extensive full design creation blog post again! 🙌 . You can read about all the ups and downs, what worked, when it spectacularly failed, of trying to create the GitHub Top Contributor network here:


1
12
69
Working on a new project where I want to take these rings and make them flow together a bit as if each ring is made from gas & interacts (along its edges) with the next ring(s). Now starting an hour-long Fluid Simulation video by The Coding Train 😃💪. Any info is appreciated! 🙏

1
2
15
RT @vuejs_berlin: Hey #vuers 👋 .These extraordinary speakers (@TejasKumar_, @NadiehBremer, @kosamari, @KrasimirTsonev, @RowdyRabouw, and @….
0
5
0
Here is the visual/network result for the other repositories that the top contributors of the much larger Terraform repository have all worked on: #dataviz #github #terraform
3
13
69
📣 NEW WORK - Part II! 📣 . Another GitHub-focused visualization. This time revealing the top contributors to any repository (example = PDF.js) and the other projects they’ve worked on, highlighting synergies across repos:
0
28
111
The example repository used reveals how all contributors have had a hand in shaping PDF.js, but shines a little spotlight on the work of Jonas Jenwald and Tim van der Meij, who Mozilla has awarded ORCA for their contribution to PDF.js 🙌


0
0
1
I collaborated with @ajbouh, who created ORCA, the Open Retrospective Compensation Agreement. Where businesses share a part of their revenue with the contributors of the open-source projects they use (read more about it here: . 👇.

newproducts.mozilla.org
1
0
3