
Datawrapper
@Datawrapper
Followers
27K
Following
6K
Media
876
Statuses
5K
Enrich your stories with charts, maps, and tables – interactive, responsive, and on brand. Questions? Write us: [email protected]
Berlin, Germany
Joined February 2012
Our recent move to a new office was good news for our co-CEO David's commute time! In his Weekly Chart, he explores what a "normal" German commute looks like. 🏢 🚶.

datawrapper.de
In this Weekly Chart, we look at the times and distances people commute in Germany.
0
0
2
💡 New to Datawrapper or wondering if it’s the perfect fit for your projects? There's still time to join today's webinar! . Happening at 12pm EDT / 6pm CET, we’ll cover everything you need to know to get started. Don’t miss out—secure your spot here 👇

streamyard.com
Just starting out with Datawrapper, or curious about whether it’s the right tool for your work, research, or personal projects? This webinar is for you! You’ll learn what Datawrapper’s all about, and...
0
1
2
From the political slant of large language models (and the people who make them) to a week of uncertainty in French government — this week's Data Vis Dispatch has it all in pictures! 📈 .


1
0
3
Mozart learned to read music before actual words. No wonder he had an exceptionally productive musical career. In her Weekly Chart, our product specialist Guillermina looks into the life of the legendary composer. 🎶 🎼 .

datawrapper.de
Hi, it’s Guillermina here, product specialist at Datawrapper! This week, I invite …
0
1
3
Mini line charts? Country flags? Custom highlights? Yes! You can do all that in a Datawrapper table. 🤩 . In this video, you'll learn how to turn raw data into a clean, interactive, and visually engaging table:

1
0
1

“We’re building advanced American manufacturing for solar and storage. Partnering with @PalantirTech allows us to quickly and effectively build a supply chain that creates U.S. jobs and stays ahead of the changing legislative landscape,” says T1 Chairman & CEO @_danielbarcelo.

0
3
17
Learn about debatable maps and discover charts on energy, heat, politics, and more in this week’s edition of the Data Vis Dispatch! 📊 .


0
3
17
You just signed up to Datawrapper and opened it for the first time? In this beginner-friendly video, we'll give you a first tour through Datawrapper. 📹 You can watch it here:
0
0
4
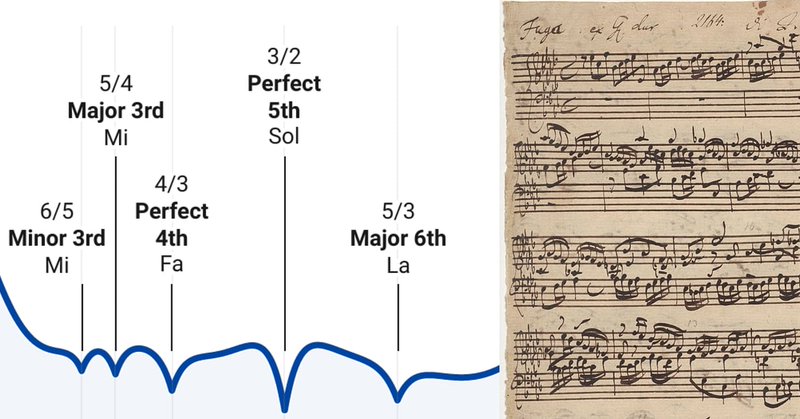
This week, our visualization engineer Luc dives into the concept of dissonance. Time to dust off your knowledge of music theory (and maybe physics too), or get ready to learn! 🤓 🎶 .
datawrapper.de
In this Weekly Chart, we visualize the concept of dissonance.
0
0
5
🌇 Learn all about the weather and it’s consequences (both good and bad) in our latest Data Vis Dispatch. You’ll also find charts about sports, migration, and AI in there! 📊.


0
0
10
🔍 New to Datawrapper or curious about its features? Join us next Tuesday (August 26) for an introductory webinar at 12pm EDT / 6pm CET! . Learn how to get started and see if it’s the right tool for your data projects. You can sign up here 👇
streamyard.com
Just starting out with Datawrapper, or curious about whether it’s the right tool for your work, research, or personal projects? This webinar is for you! You’ll learn what Datawrapper’s all about, and...
0
0
5
🤩 The book club is starting in just 5 minutes! . Join the discussion here: . Not able to join? No worries! You'll still have access to the discussion and the book club information here 👇

datawrapper.de
We’re very excited to announce the next book for our book club: Read “CHART” by Nadieh Bremer with us!
0
0
2
🎉 Today's the day! We are finally discussing "CHART" by @NadiehBremer! . You can join us here at 4pm UTC: . 👉 Find more info on our blog:
datawrapper.de
We’re very excited to announce the next book for our book club: Read “CHART” by Nadieh Bremer with us!
0
4
9
Datawrapper's design team is always working to make our app more elegant, intuitive and easy to use — and as a product designer, that's exactly what Moritz does best. Read about his design experience and his love of boxing and botanical gardens on our blog! 🌵.
0
0
6
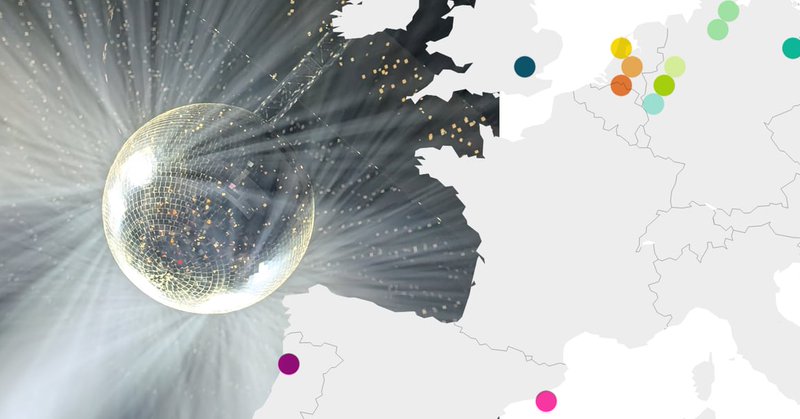
This week, our developer Toni brings us along to concerts and festivals around Europe. If you're looking for some music inspiration, make sure to click through and explore the map. 🪩 🧑🎤.
datawrapper.de
In this Weekly Chart, we join Toni on a tour of concerts and festivals around Europe.
0
0
1
Choropleth maps are one of the most powerful ways to show geographic patterns in your data. 🌍 In this new tutorial, you'll learn how to create, customize, and publish one in Datawrapper. ✨ You can watch it here:

1
0
6
📣 We have some spots left for today's webinar at 12pm EST/6pm CET about maps! 🌎 . Learn how to create them with Datawrapper, how to make them beautiful, and more. You can register here 👇

streamyard.com
Are you already familiar with Datawrapper and interested in exploring its advanced features for creating maps? This webinar is for you! Join us to dive deeper into the world of Datawrapper maps. Join...
1
0
3
📊 This week’s Data Vis Dispatch features visualizations about Europe’s wildfires, mushroom maps, tariff analyses, and opinions about Italian food! 🍝.


0
2
15
Tables might look relatively simple—but can be one of the most powerful tools in your dataviz toolbox. In this video, you'll learn what’s special about Datawrapper tables and how to get the most out of them. 📺.
0
0
2
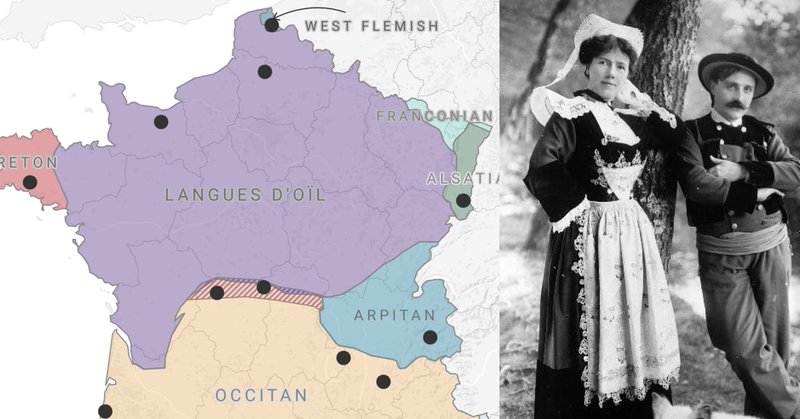
In this Weekly Chart, our Head of Customer Success Margaux tells you all about France's regional languages, from their history to traditional songs and recipes. Click through to the map and hear for yourself! 🇫🇷 🗣️ .
datawrapper.de
In this Weekly Chart, we take a look at regional languages in France.
0
0
2
🗞️ In the latest Data Vis Dispatch, we’re taking a trip from Texas to Germany and all around the world, looking at coffee, the environment, and happy songs in trying times! 📊.


0
2
9