Jörg Menche
@MencheLab
Followers
871
Following
1K
Media
64
Statuses
226
Vienna, Austria
Joined April 2018
Interested in network visualizations that are not just pretty, but actually mean something? Check out our new paper @NatComputSci: https://t.co/OvlYC0UK3c
@CeMM_News @MaxPerutzLabs @univienna (1/n)
nature.com
Nature Computational Science - Networks offer a powerful visual representation of complex systems. This study introduces network visualizations that are easy to interpret and can help explore large...
2
21
70
Finally, we would like to thank our host institutions @MaxPerutzLabs, @univienna and @CeMM_News, and of course the @WWTF for funding. (n/n)
0
0
3
All credits go to the amazing @ChrisHuetter who made it all happen. Originally trained in architecture, she dared to embark on an entirely different adventure with us on this project. This is her explaining it herself: https://t.co/nUnn90T4Am (10/n)
1
1
6
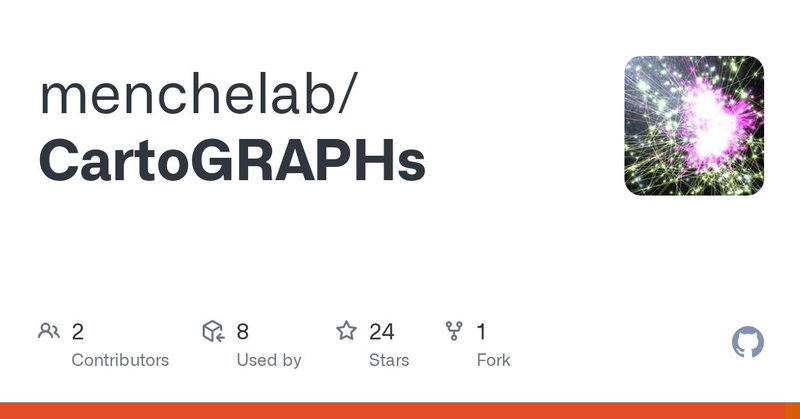
I hope that the wide #NetSci and #dataviz community will find our method as useful as I do. All our code is public https://t.co/7sLAzmNCHr and there’s also a little webtool https://t.co/nPsS0vVG2c. (9/n)
github.com
Contribute to menchelab/CartoGRAPHs development by creating an account on GitHub.
1
0
2
Our method can be used both to explore unknown network characteristics, as well as to accurately depict known ones. For example, I struggled for years to visually depict disease modules in the interactome. This can finally be done systematically! (8/n)
1
0
4
Finally, we would like to thank our host institutions @MaxPerutzLabs, @univienna and @CeMM_News, and of course the @WWTF for funding. (n/n)
0
0
0
(n+1 / n) I should use twitter more often, I still don't know how threads work 🙄
0
0
2
All credits go to the amazing @ChrisHuetter who made it all happen. Originally trained in architecture, she dared to embark on an entirely different adventure with us on this project. This is her explaining it herself: https://t.co/nUnn90T4Am (10/n)
0
0
1
I hope that the wide #NetSci and #dataviz community will find our method as useful as I do. All our code is public https://t.co/7sLAzmNCHr and there’s also a little webtool https://t.co/nPsS0vVG2c. (9/n)
github.com
Contribute to menchelab/CartoGRAPHs development by creating an account on GitHub.
1
0
2
Our method can be used both to explore unknown network characteristics, as well as to accurately depict known ones. For example, I struggled for years to visually depict disease modules in the interactome. This can finally be done systematically! (8/n)
1
0
1
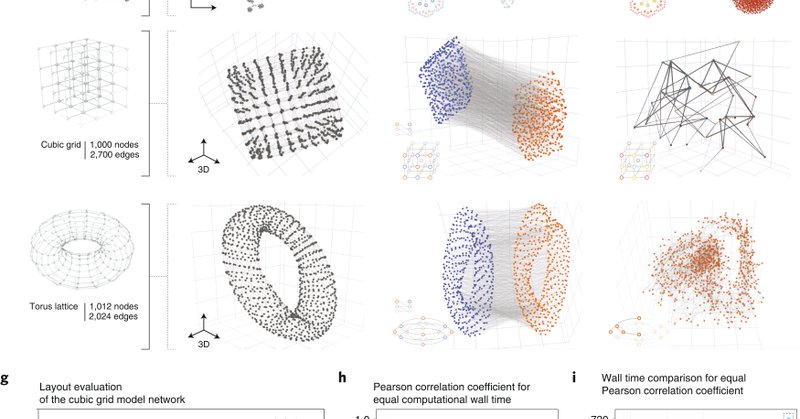
We propose a series of layouts emphasizing various network characteristics that can be structural (e.g. node centrality), but also functional. One can choose pretty much anything. And since we know exactly what the node positions mean, we can finally interpret the layouts. (7/n)
1
1
5
We use a pretty simple trick allowing us to directly encode any quantity we like into node positions: dimensionality reduction! There are widely used algorithms for this, they are fast and can map anything onto various 2D and 3D geometries. (6/n)
2
0
5
#2 Interpretability. In conventional layout algorithms, it’s often hard to tell what exactly is driving the position of a node (see Mark Newman above!). Our work offers a solution to this. (5/n)
1
0
2
#1 Size. The space on a computer screen or a piece of paper is just very limited. Displaying large networks will always be tough there. Not so in Virtual Reality, where you can blow a network up to the size of a cathedral and be right in the middle. https://t.co/Rv5dgOcjlz (4/n)
1
0
4
At the same time, networks provide a super intuitive visual representation for often very complicated data. So how can we defeat the hairball and leverage the full power of network visualizations? I think the solution has two key aspects: (3/n)
1
0
4
I am particularly fond of this work, as it offers a solution to a problem that has been bugging me since my PhD: The hairball! Mark Newman put it perfectly in his classic review: (2/n)
1
0
6

CeMM Adjunct PI Jörg Menche (@MencheLab / @MaxPerutzLabs / @univienna) & his team have developed a multiplex #network that will help identify causative genetic defects more easily & predict possible consequences to improve treatments of #RareDiseases ➡️ https://t.co/rgYeXzNWsM
1
5
28
Finally, we would like to thank our collaborators for joining us on this adventure! We couldn’t have done it without Vanja and her team from the @Lab_Nagy. We are also grateful to our fantastic institutions @CeMM_News @MaxPerutzLabs and funding agency @WWTF (n/n)
1
0
8
All credits go to the amazing @izebuphamalai who performed this extensive tour de force of crunching dozens of datasets, extracting millions of interactions, thousands of diseases … This is what we looked like when we finally submitted the paper (10/n)
2
0
14
More generally, our approach represents a network-based strategy for identifying and integrating the most relevant datasets for a particular biological application. (9/n)
1
0
3