
Man Games Lost NBA
@ManGamesLostNBA
Followers
1,727
Following
41
Media
188
Statuses
989
How injured is YOUR team? Providing NBA injury analytics and visualizations to 23 NBA teams. Nathan Currier, PhD and .
Montréal, Québec
Joined February 2015
Don't wanna be here?
Send us removal request.
Explore trending content on Musk Viewer
Kendrick
• 647325 Tweets
Drake
• 549975 Tweets
Rio Grande do Sul
• 266814 Tweets
Madonna
• 186475 Tweets
Ole Miss
• 105733 Tweets
Nicki
• 99088 Tweets
Sony
• 86192 Tweets
Porto Alegre
• 67484 Tweets
Star Wars
• 67286 Tweets
Hope Hicks
• 45926 Tweets
ウズベキスタン
• 44098 Tweets
#David69
• 36467 Tweets
Leclerc
• 31960 Tweets
#الاتحاد_ابها
• 30486 Tweets
Helldivers 2
• 23474 Tweets
Mark Hamill
• 21785 Tweets
Luton
• 21054 Tweets
日本優勝
• 19128 Tweets
Keyshia
• 17973 Tweets
みどりの日
• 15007 Tweets
Verstappen
• 14898 Tweets
David Raya
• 14802 Tweets
McLaren
• 11589 Tweets
Lando
• 10928 Tweets
Getafe
• 10041 Tweets


Pinned Tweet

Mr. Leonsis, you know that's not a good position to be in for the stats on my site. Next update on Friday.

We are number 1: Wizards have missed the most games to injury so far this season. (Gortat sat last night, too.)
1
5
9
1
1
10
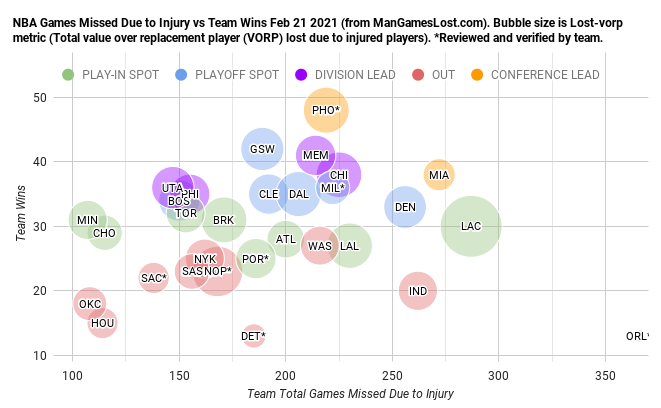
NBA top 5, impact on teams by players lost to injury (Lost-vorp metric, lost value over replacement player)
1 PHO
2 PHI
3 CLE
4 WAS
5 BOS
7
40
293
NBA top 5, impact on teams by players lost to injury (Lost-vorp metric, lost value over replacement player)
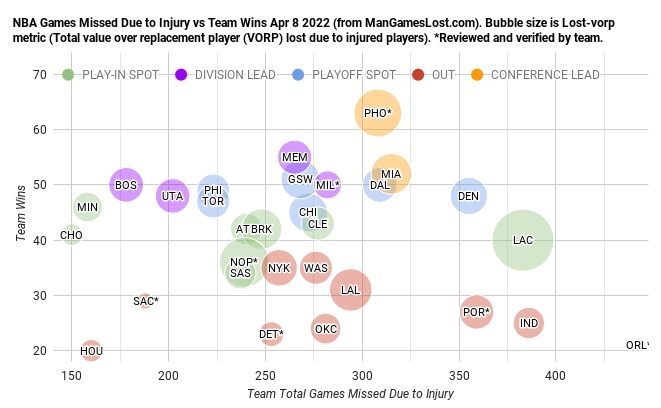
1 LAC
2 NOP
3 PHO
4 MIA
5 BRK
5
30
255
NBA top 5, most games missed by injured players and health protocols
ORL 113
MIL 79
MEM 75
MIA 74
CLE 67
6
50
240
NBA top 5, impact on teams by players lost to injury (Lost-vorp metric, lost value over replacement player)
1 PHO
2 LAL
3 NOP
4 PHI
5 CHI
3
46
210
NBA top 5, impact on teams by players lost to injury (Lost-vorp metric, lost value over replacement player)
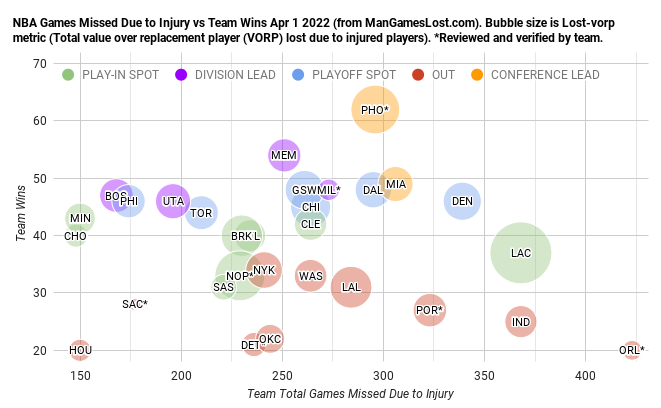
1 LAC
2 NOP
3 PHO
4 LAL
5 BRK
4
45
193
NBA top 5, most games missed by injured players and health protocols
ORL 305
LAC 229
MIA 222
DEN 201
LAL 192
11
36
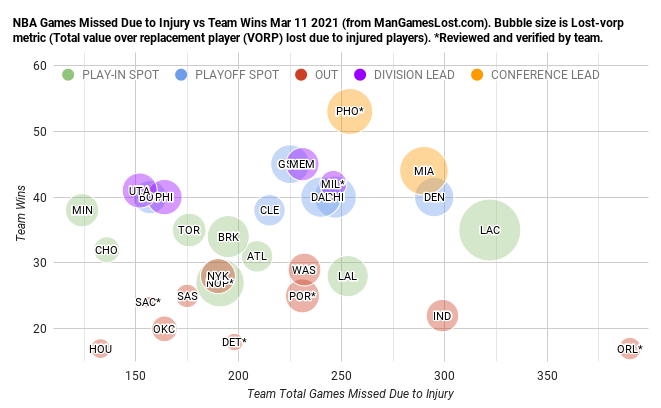
189
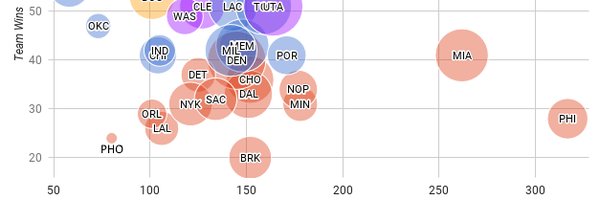
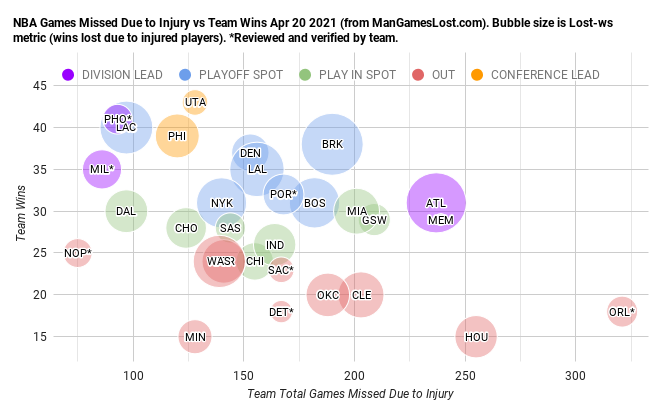
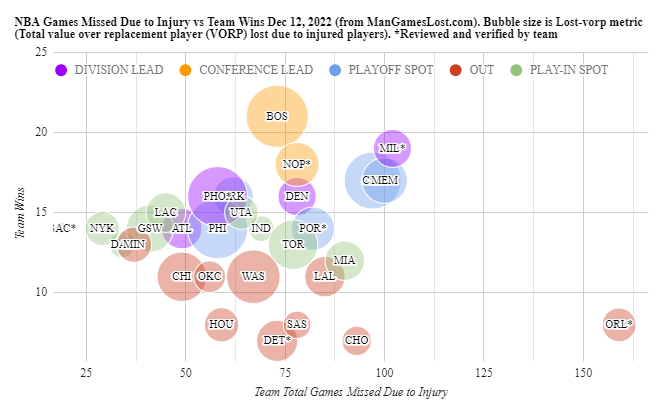
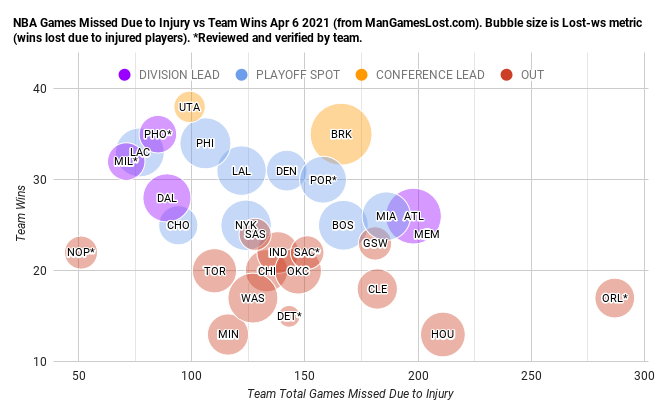
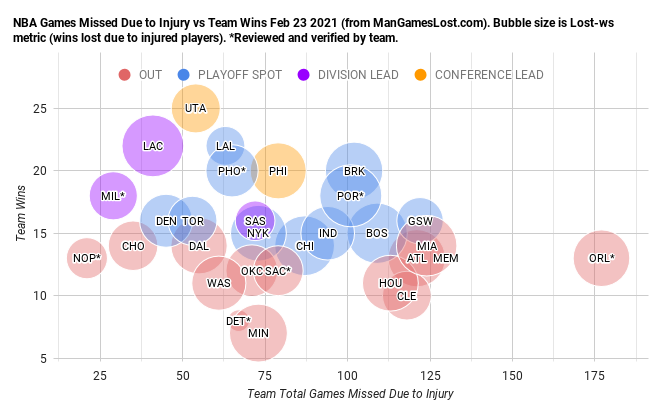
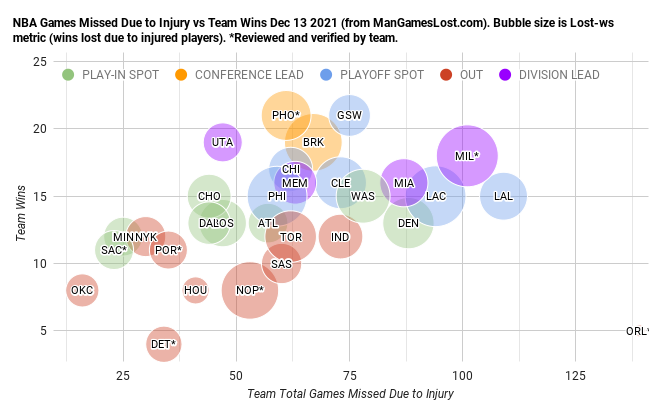
NBA injury plot. Games missed by injured players and health protocols versus team wins. Bubble size represents cumulative quality of players lost for games (Lost-ws metric)
10
44
165
If the Orlando Magic stopped playing basketball today it would take the Oklahoma City Thunder over 311 more games to catch them in number of games missed by injured players
1
45
116
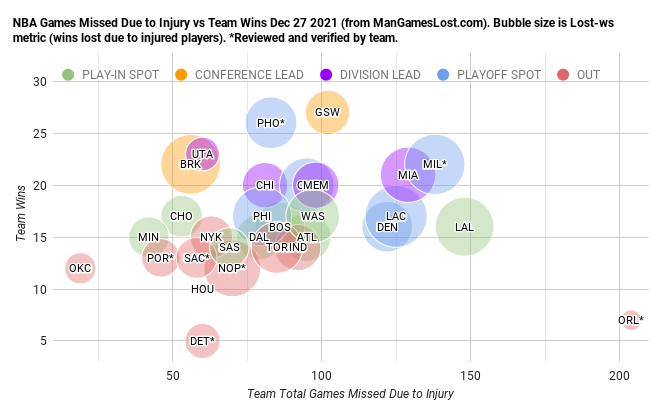
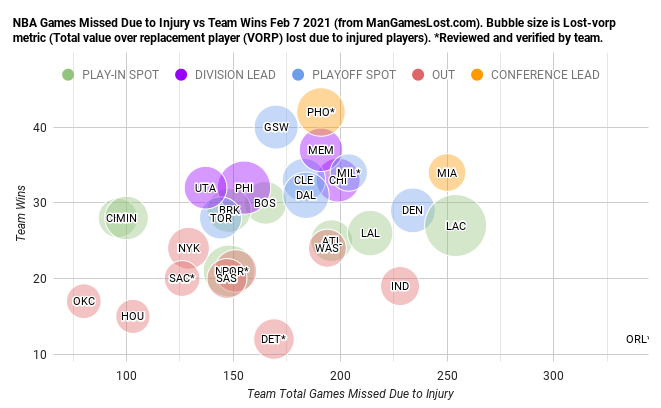
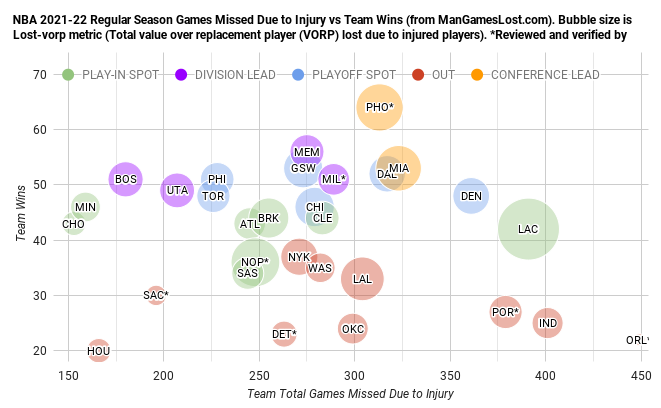
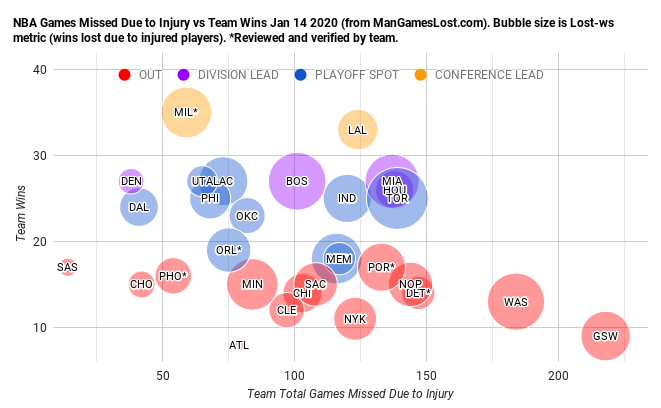
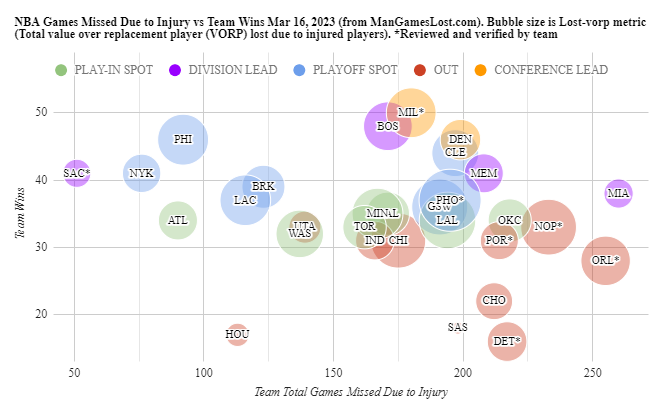
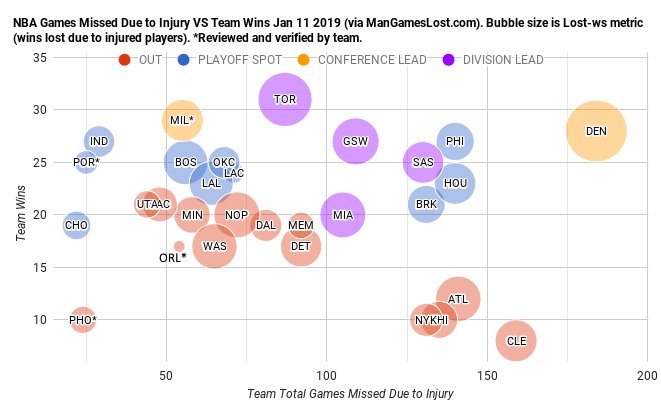
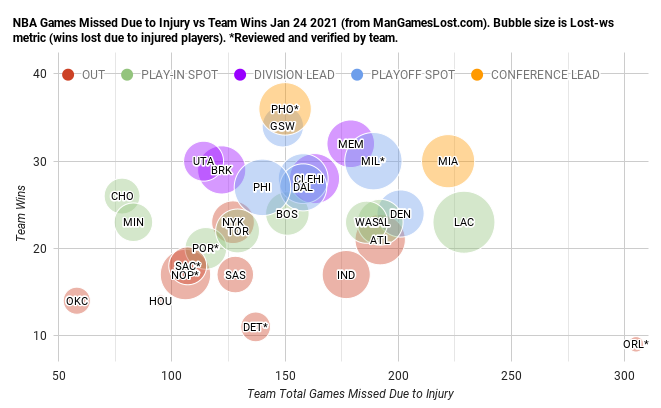
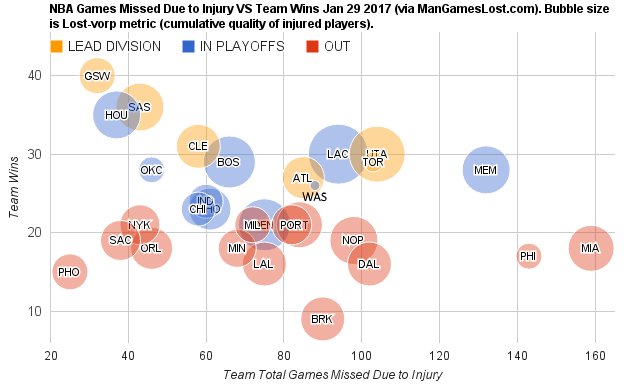
NBA injury plot. Games missed by injured players versus team wins. Bubble size represents cumulative quality of players lost (Lost-ws metric)

9
26
106
NBA top 5, wins lost due to injured players and health protocols (Lost-ws metric, lost win shares due to injured players)
1 LAC 13.52 wins lost
2 MIL 11.12
3 PHI 10.80
4 MIA 9.32
5 PHO 9.01
7
26
98
NBA top 5, wins lost due to injured players (Lost-ws metric, lost win shares due to injured players)
1 TOR 6.41 wins lost
2 BOS 5.79
3 WAS 5.11
4 MIA 4.58
5 GSW 4.36
4
42
97
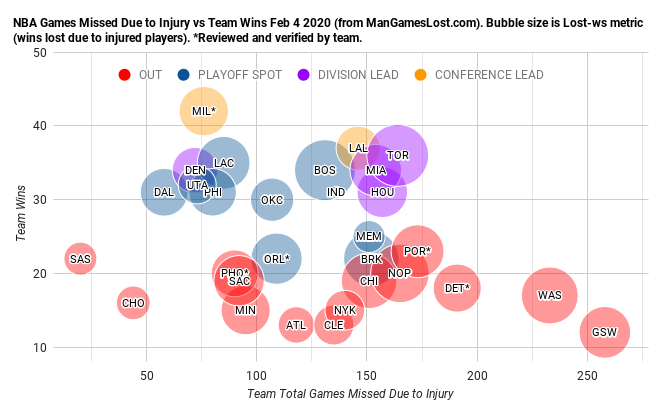
NBA top 5, wins lost due to injured players (Lost-ws metric)
1 UTA (9.0 wins lost)
2 TOR (8.6)
3 DEN (8.4)
4 MEM (7.6)
5 MIA (7.2)
4
77
85
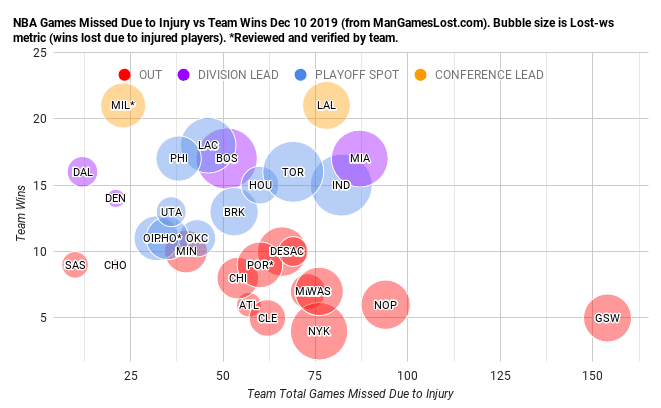
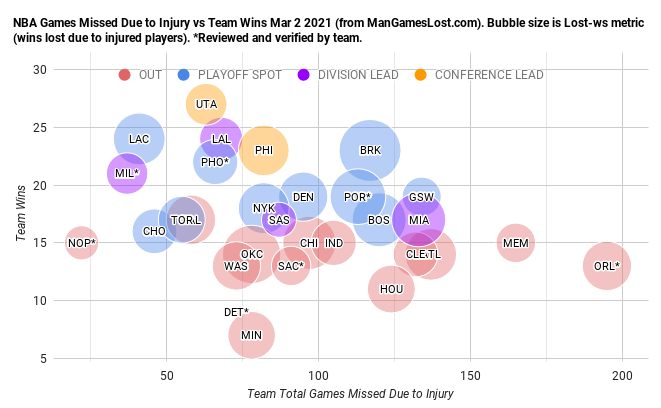
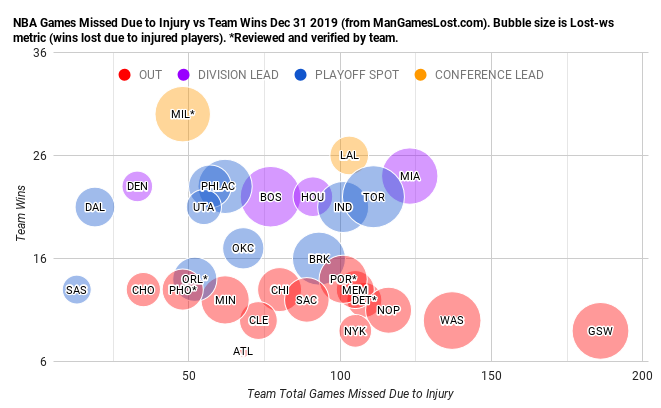
NBA injury plot. Games missed by injured players versus team wins. Bubble size represents cumulative quality of players lost (Lost-ws metric)

4
17
73
NBA top 5, most games missed by injured players and health protocols
ORL 174
CLE MEM MIL 110
MIA CHO 103
1
26
76
NBA top 5, most games missed by injured players and health protocols
ORL 196
CLE 135
MEM 129
CHO 127
MIA 126
2
16
71
Utah Jazz and Golden State Warriors lead NBA in injury impact this season by Lost-ws metric (14.4 and 11.9 potential wins lost due to injured players). Sacramento Kings and Brooklyn Nets are least impacted by injuries this season
3
38
61
From yesterday, NBA top 5, impact on teams by players lost to injury (Lost-vorp metric, lost value over replacement player)
1 LAC
2 NOP
3 PHO
4 BRK
5 CHI
3
8
64
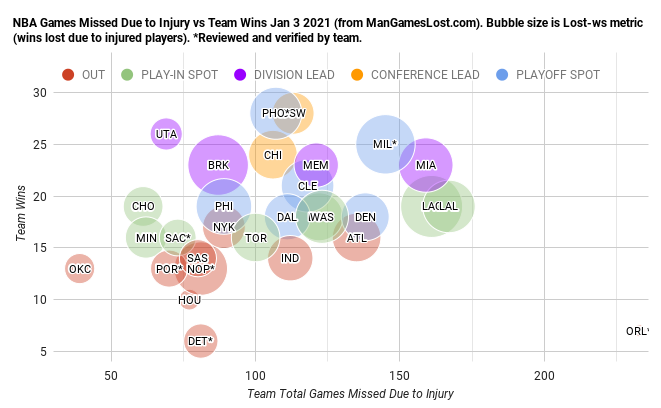
NBA top 5, wins lost due to injured players (Lost-ws metric, lost win shares due to injured players)
1 LAC 8.12 wins lost
2 MIL 7.51
3 BRK 7.30
4 PHI 7.14
5 LAL 7.06
1
16
60
NBA injury plot. Games missed by injured players versus team wins. Bubble size represents cumulative quality of players lost (Lost-ws metric)
5
14
60
NBA injury plot. Games missed by injured players and health protocols versus team wins. Bubble size represents cumulative quality of players lost for games (Lost-ws metric)

5
6
60
NBA top 5, most games missed by injured players.
ORL 177
MEM 130
MIA 124
GSW 122
ATL 121
0
20
51
NBA injury plot. Games missed by injured players and health protocols versus team wins. Bubble size represents cumulative quality of players lost (Lost-ws metric)
5
5
42
If the Orlando Magic stopped playing basketball today it would take the Oklahoma City Thunder almost 350 more games to catch them in injuries, but they've only won 2 more games

0
20
44
@BarcaPlsFkinWin
I track games missed due to injury and health protocols. I don't track games missed due to stupidity.
3
0
43
NBA top 5, wins lost due to injured players (Lost-ws metric, lost win shares due to injured players)
1 POR 4.20 wins lost
2 LAC 4.16
3 MIA 3.89
4 BOS 3.83
5 CHI 3.71
1
10
36
NBA top 5, wins lost due to injured players (Lost-ws metric, lost win shares due to injured players)
1 TOR 8.56 wins lost
2 BOS 8.22
3 NOP 7.31
4 WAS 6.75
5 CHI 6.29
GSW penalized in this metric simply because Thompson hasn't played this season
3
14
39
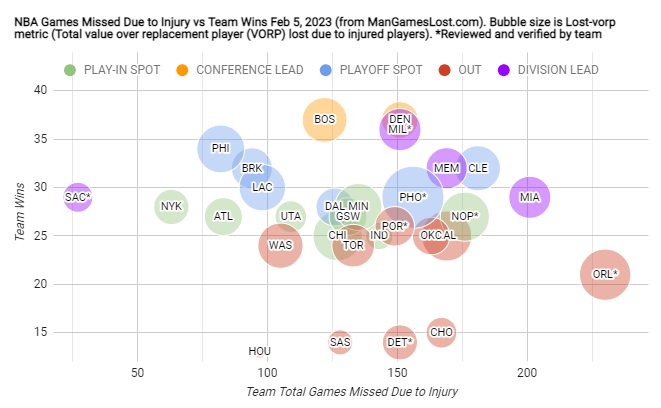
NBA injury plot. Games missed by injured players and health protocols versus team wins. Bubble size represents cumulative quality of players lost for games (Lost-ws metric)
0
16
36
Plot of total games missed by injured players for each team versus team wins. Bubble size is the cumulative quality of players lost by Lost-ws metric.
The
@PelicansNBA
did something pretty remarkable

0
20
35
NBA top 5, most games missed by injured players.
ORL 119
LAL 96
MIL 85
LAC 84
MIA 73
1
13
34
New Orleans Pelicans and Phoenix Suns are most injured teams in the NBA to this point of the season. Portland Trailblazers and Oklahoma City Thunder have been healthiest so far.

2
20
32
NBA top 5, wins lost due to injured players (Lost-ws metric)
1 UTA (8.07 wins)
2 DEN (7.71)
3 MIA (6.58)
4 TOR (6.57)
5 MEM (6.31)
4
27
30
From yesterday, NBA top 5, most games missed by injured players and health protocols
ORL 366
LAC 287
MIA 272
IND 262
PEN 256
2
12
28
For those asking.
Teams and games missed due to Covid protocol
ATL55
BOS65
BRK38
CHI51
CHO35
CLE48
DAL48
DEN22
DET29
GSW18
HOU16
IND20
LAC34
LAL34
MEM33
MIA23
MIL26
MIN34
NOP9
NYK45
OKC20
ORL38
PHI45
PHO14
POR18
SAC42
SAS26
TOR22
UTA0
WAS24
1
5
29
NBA injury plot. Games missed by injured players versus team wins. Bubble size represents cumulative quality of players lost (Lost-ws metric)

0
6
26
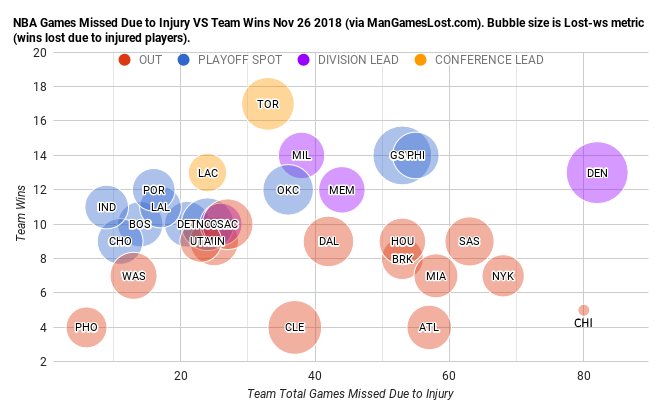
NBA top 5, impact on teams by players lost to injury (Lost-vorp metric)
1 UTA
2 MEM
3 BOS
4 HOU
5 BRK
1
25
22
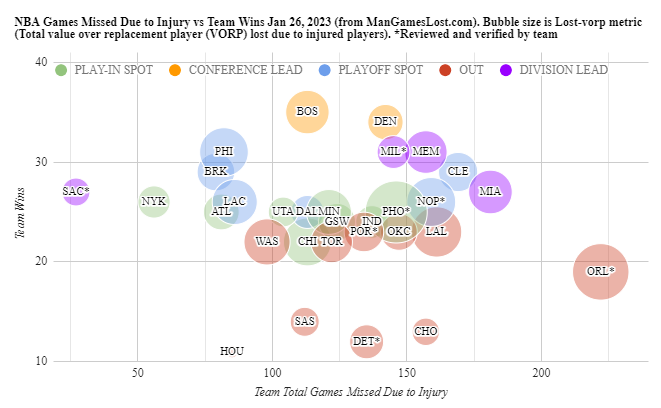
NBA top 5, impact on teams by players lost to injury (Lost-vorp metric, lost value over replacement player)
1 PHO
2 ORL
3 LAL
4 NOP
5 PHI
0
4
23
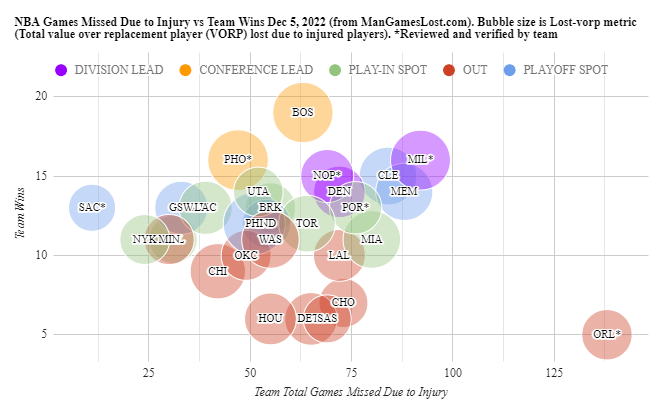
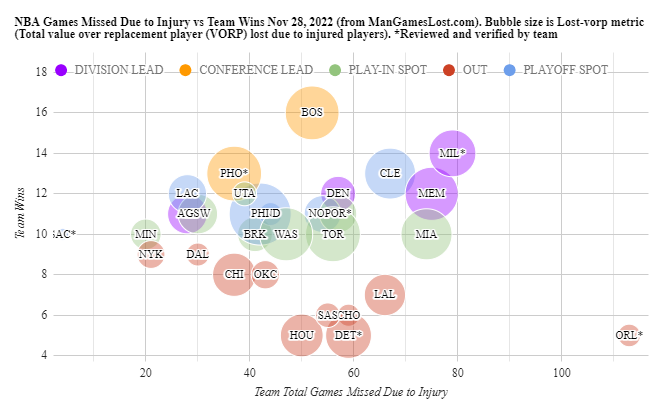
NBA injury plot. Games missed by injured players and health protocols versus team wins. Bubble size represents cumulative quality of players lost for games (Lost-vorp metric)
1
5
24
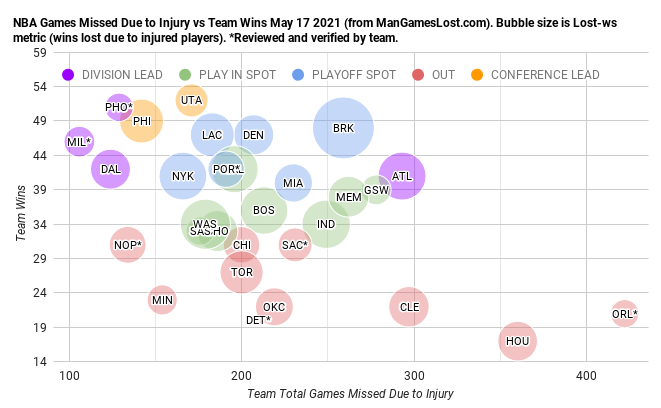
NBA top 5, wins lost due to injured players (Lost-ws metric, lost wins due to injured players)
1 UTA 12.9 wins lost
2 GSW 12.8
3 SAS 11.9
4 LAC 11.1
5 MEM 10.4
1
12
19
NBA injury plot. Games missed by injured players and health protocols versus team wins. Bubble size represents cumulative quality of players lost for games (Lost-ws metric)
1
5
22
Plot of NBA injuries (x-axis) versus Team Wins (y-axis). Bubble size represents quality of players lost
2
22
20
NBA season-end injury plot. Games missed by injured players and health protocols versus team wins. Bubble size represents cumulative quality of players lost for games (Lost-ws metric)
2
3
20
NBA top 5, most games missed by injured players and health protocols
ORL 138
MIL 92
MEM 88
CLE 84
MIA 80
3
6
20
NBA top 5, impact on teams by players lost to injury (Lost-vorp metric, lost value over replacement player)
1 PHO
2 GSW
3 PHI
4 WAS
5 CLE
2
5
19
NBA top 5, impact on teams by players lost to injury (Lost-vorp metric)
1 UTA
2 LAC
3 DEN
4 BOS
5 SAS
1
14
19
NBA top 5, wins lost due to injured players (Lost-ws metric, lost win shares due to injured players)
1 BRK 9.96 wins lost
2 ATL 7.79
3 PHI 6.32
4 NYK 6.16
5 BOS 6.01
1
8
19
NBA top 5, wins lost due to injured players (Lost-ws metric)
1 UTA (9.4 wins lost)
2 DEN (9.1)
3 TOR (8.3)
4 MIN (7.4)
5 MEM (7.4)
1
8
19
Team protocol absences
ATL 55
BOS 65
BRK 38
CHI 51
CHO 35
CLE 48
DAL 48
DEN 22
DET 29
GSW 18
HOU 16
IND 20
LAC 34
LAL 34
MEM 33
MIA 23
MIL 26
MIN 34
NOP 9
NYK 45
OKC 20
ORL 38
PHI 45
PHO 14
POR 18
SAC 42
SAS 26
TOR 22
UTA 0
WAS 24
0
5
18
NBA top 5, most games missed by injured players and health protocols
MIA 260
ORL 255
NOP 233
OKC 218
DET 217
1
3
18
NBA injury plot. Games missed by injured players versus team wins. Bubble size represents cumulative quality of players lost (Lost-ws metric)
1
7
17
If the Orlando Magic stopped playing basketball today it would take the Sacramento Kings 490+ games to catch them in number of games missed by injured players

0
10
18
NBA injury plot. Games missed by injured players versus team wins. Bubble size represents cumulative quality of players lost (Lost-ws metric)
5
8
18
NBA injury plot. Games missed by injured players versus team wins. Bubble size represents cumulative quality of players lost (Lost-ws metric)

0
1
16
NBA injury plot. Games missed by injured players versus team wins. Bubble size represents cumulative quality of players lost (Lost-ws metric)
4
11
16
@BenzTheRulez
No. I started off the season counting him, but then later decided I don't track games missed due to stupidity.
2
0
15
NBA top 5, impact on teams by players lost to injury (Lost-vorp metric, lost value over replacement player)
1 PHO
2 NOP
3 CHI
4 LAL
5 ORL
0
3
13
NBA injury plot. Games missed by injured players versus team wins. Bubble size represents cumulative quality of players lost (Lost-ws metric)
0
8
14
NBA bottom 5, least games missed by injured players
HOU 52
OKC 69
PHO 78
GSW 79
SAS 93
0
12
14
NBA top 5, wins lost due to injured players (Lost-ws metric, lost win shares due to injured players). If Klay Thompson had any stats this year GSW would jump to
#1
1 TOR 10.51 wins lost
2 BOS 10.04
3 CHI 9.04
4 NOP 8.43
5 BRK 8.43
3
4
13
NBA injury plot. Games missed by injured players and health protocols versus team wins. Bubble size represents cumulative quality of players lost for games (Lost-ws metric)
0
6
13
NBA injury plot. Games missed by injured players and health protocols versus team wins. Bubble size represents cumulative quality of players lost for games (Lost-vorp metric)
1
5
13
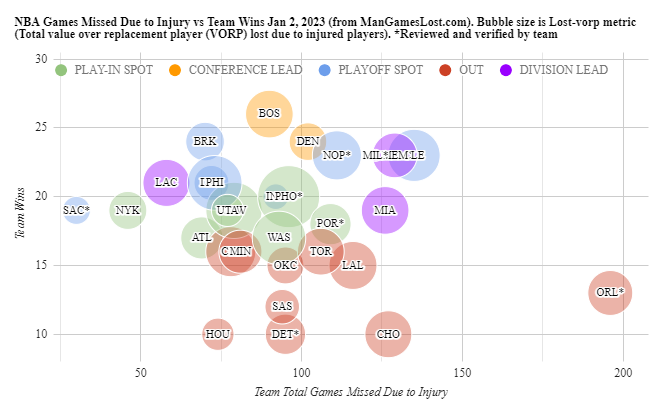
NBA top 5, impact on teams by players lost to injury (Lost-vorp metric, lost value over replacement player)
1 PHO
2 PHI
3 LAL
4 CLE
5 NOP
3
8
13
From yesterday, NBA top 5, wins lost due to injured players (Lost-ws metric, lost win shares due to injured players)
1 LAC 10.16 wins lost
2 BRK 9.56
3 MIL 9.11
4 PHI 7.65
5 MIA 7.21
2
3
13
NBA top 5, impact on teams by players lost to injury (Lost-vorp metric, lost value over replacement player)
1 PHO
2 NOP
3 CHI
4 GSW
5 LAL
1
9
12
NBA top 3 player injury impact to team (by Lost-vorp metric)
1 Chris Paul (21 games)
2 George Hill (25 games)
3 Blake Griffin (19 games)
0
1
12
NBA top 5, most games missed by injured players.
ORL 97
LAL 81
LAC 74
MIL 73
PHI 62
1
2
12
NBA injury plot. Games missed by injured players versus team wins. Bubble size represents cumulative quality of players lost (Lost-ws metric)
4
3
10
NBA top 5, wins lost due to injured players (Lost-ws metric, lost win shares due to injured players)
1 TOR 11.23 wins lost
2 BOS 10.54
3 BRK 9.61
4 CHI 9.01
5 NOP 8.95
1
4
12
NBA injury plot. Games missed by injured players and health protocols versus team wins. Bubble size represents cumulative quality of players lost for games (Lost-ws metric)
2
5
12
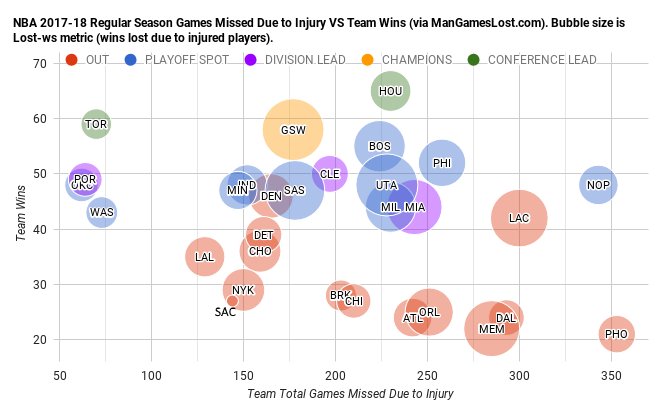
NBA injury plot. Teams top left = playoffs and/or led division. Teams bottom right = golfing. Except Grizzlies.

1
14
11
NBA top 5, most games missed by injured players.
ORL 403
HOU 334
ATL 283
CLE 274
GSW 264
0
0
6
NBA injury plot. Games missed by injured players versus team wins. Bubble size represents cumulative quality of players lost (Lost-ws metric)
3
5
10
NBA injury plot. Games missed by injured players and health protocols versus team wins. Bubble size represents cumulative quality of players lost for games (Lost-vorp metric)
2
1
9
NBA top 5, wins lost due to injured players (Lost-ws metric, lost win shares due to injured players)
1 TOR 11.31 wins lost
2 BOS 10.59
3 BRK 9.85
4 CHI 9.44
5 NOP 8.95
5
1
9
NBA injury plot. Games missed by injured players versus team wins. Bubble size represents cumulative quality of players lost (Lost-ws metric)
1
3
10
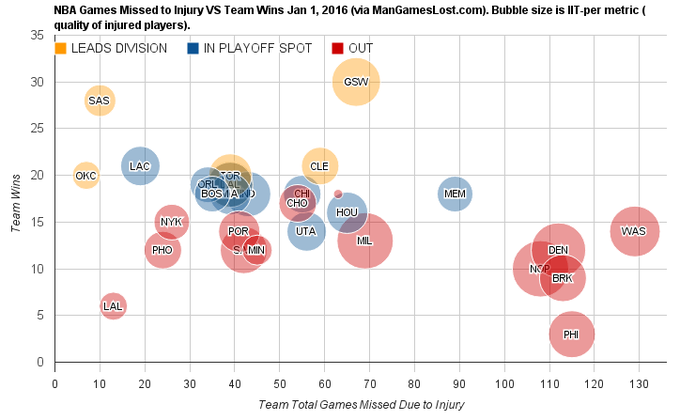
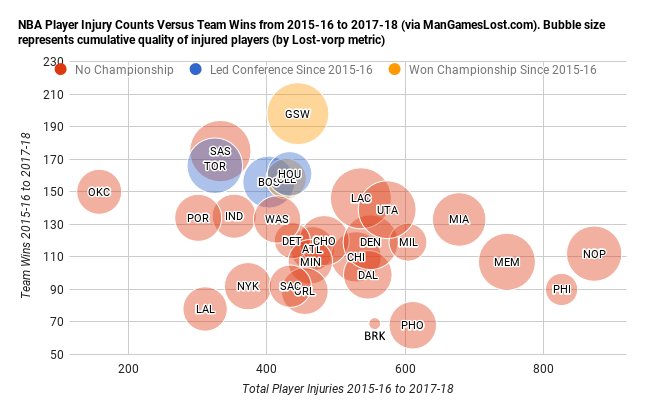
The New Orleans Pelicans, Philadelphia 76ers, Memphis Grizzlies, Miami Heat, and Phoenix Suns have the greatest number of injuries since the 2015-16 season
0
7
9
NBA top 5, wins lost due to injured players (Lost-ws metric)
1 DEN (8.04 wins)
2 UTA (7.74)
3 TOR (7.28)
4 MIA (6.67)
5 MEM (6.6)
0
8
10
NBA injury plot. Games missed by injured players versus team wins. Bubble size represents cumulative quality of players lost (Lost-ws metric)
1
4
10
NBA injury plot. Games missed by injured players and health protocols versus team wins. Bubble size represents cumulative quality of players lost for games (Lost-ws metric)
3
2
10
Are injuries up in NBA this season? Yes, definitely.
For 1608 games through Feb 6th, 3798 games missed due to injury.
Last season for 1630 games through Feb 11th, 2670 total games missed due to injury.
Great piece by
@tomhaberstroh
0
4
9
NBA injury plot. Games missed by injured players and health protocols versus team wins. Bubble size represents cumulative quality of players lost for games (Lost-ws metric)
1
1
8
I'm getting such a kick out of Suns fans getting all bent out of shape about PHO instead of PHX that I'm obviously going to continue doing it forever
0
0
8
Not only did the Golden State Warriors win the championship, they were the team most affected by injuries during the regular season (Lost-vorp metric). Amazing accomplishment
0
2
8
NBA top 5, wins lost due to injured players (Lost-ws metric, lost wins due to injured players)
1 DEN 5.45 wins lost
2 GSW 3.48
3 TOR 3.02
4 MIL 2.83
5 NOP 2.48
0
5
8
NBA top 10 games missed to injury
1st WAS 129
PHI 115
BRK 113
DEN 112
NOP 108
MEM 89
MIL 69
GSW 67
HOU 65
DET 63
1
17
9
From yesterday, NBA injury plot. Games missed by injured players and health protocols versus team wins. Bubble size represents cumulative quality of players lost for games (Lost-ws metric)
0
3
8
NBA injury plot. Games missed by injured players versus team wins. Bubble size represents cumulative quality of players lost (Lost-ws metric)
0
3
8
NBA injury plot. Games missed by injured players and health protocols versus team wins. Bubble size represents cumulative quality of players lost (Lost-ws metric)
0
0
9
@BrynnTannehill
Lost-vorp due to injured players
1PHO 3.248
2GSW 2.448
3PHI 2.250
4WAS 2.101
5CLE 1.940
2
2
8
NBA injury plot. Games missed by injured players versus team wins. Bubble size represents cumulative quality of players lost (Lost-ws metric)
3
1
9
From yesterday, NBA top 5, wins lost due to injured players (Lost-ws metric, lost win shares due to injured players)
1 BRK 11.15 wins lost
2 ATL 10.5
3 LAL 8.63
4 LAC 8.17
5 WAS 7.99
2
3
8
1/4
With a heavy heart I announce that and its business operations are up for sale. Having been a trusted injury analytics resource for 23 NBA teams, 21 NFL teams, 22 NHL teams, and 10 MLB teams over the past decade, I'm proud of what I've accomplished.

1
2
8
NBA top 5, most games missed by injured players. Number in brackets is league ranking when injuries are quality adjusted (Lost-ws metric). Denver Nuggets 1st in Lost-ws.
DEN 135 (1)
HOU 119 (14)
CHI 115 (27)
NYK 111 (17)
PHI 105 (18)
0
7
8
NBA top 3 player injury impact to team (by Lost-ws metric)
1 K Durant (3.8 wins lost)
2 G Hill (3.7)
3 C Paul (3.6)
0
6
7
NBA injury plot: # of injuries vs # of wins. Total player quality lost is bubble size (Lost-vorp metric)
0
10
8
NBA injury plot. Games missed by injured players versus team wins. Bubble size represents cumulative quality of players lost (Lost-ws metric)
0
1
8
NBA top 5, wins lost due to injured players (Lost-ws metric, lost win shares due to injured players)
1 PHI 3.94 wins lost
2 MIL 3.75
3 NOP 3.09
4 BRK 3.00
5 LAC 2.99
1
3
8
NBA top 5, impact on teams by players lost to injury (Lost-vorp metric, lost value over replacement player)
1 PHO
2 ORL
3 LAL
4 CHI
5 NOP
2
3
8
From yesterday, NBA top 5, most games missed by injured players.
ORL 233
LAL 167
LAC 161
MIA 159
MIL 145
2
4
8