

Jan Broder Engler
@JanBroderEngler
Followers
3K
Following
738
Media
194
Statuses
537
Scientist and software developer. Creator of https://t.co/jhDLNRoZqB.
Hamburg, Germany
Joined February 2016
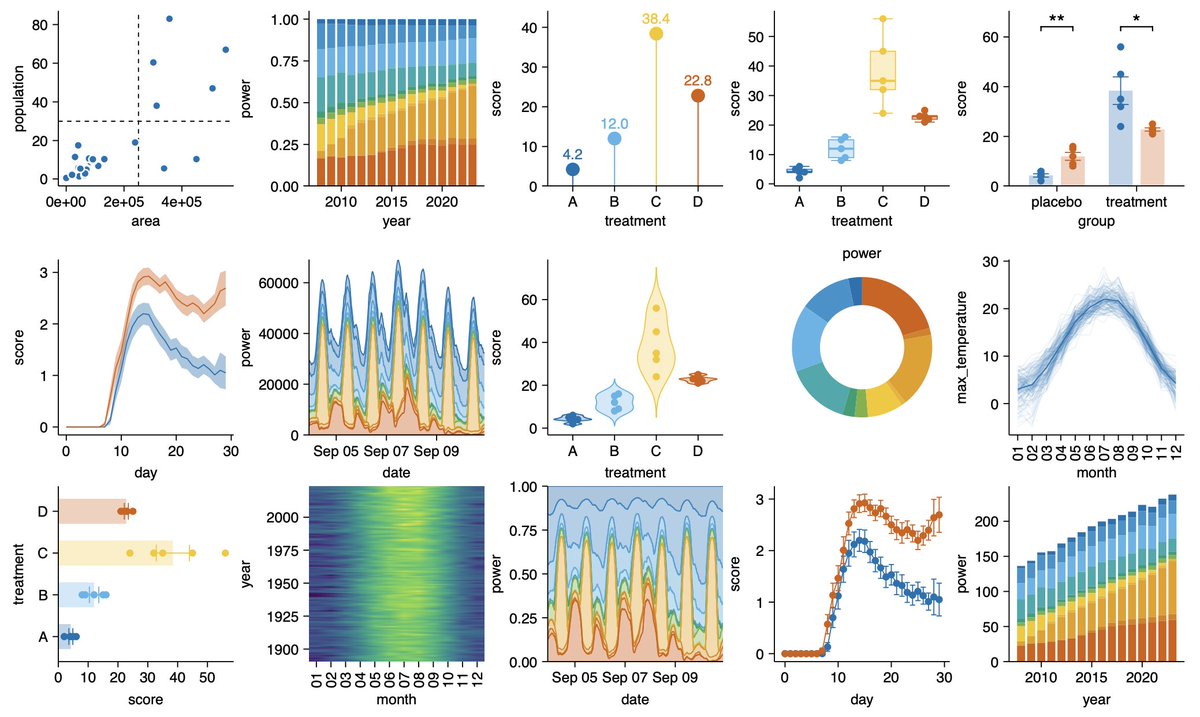
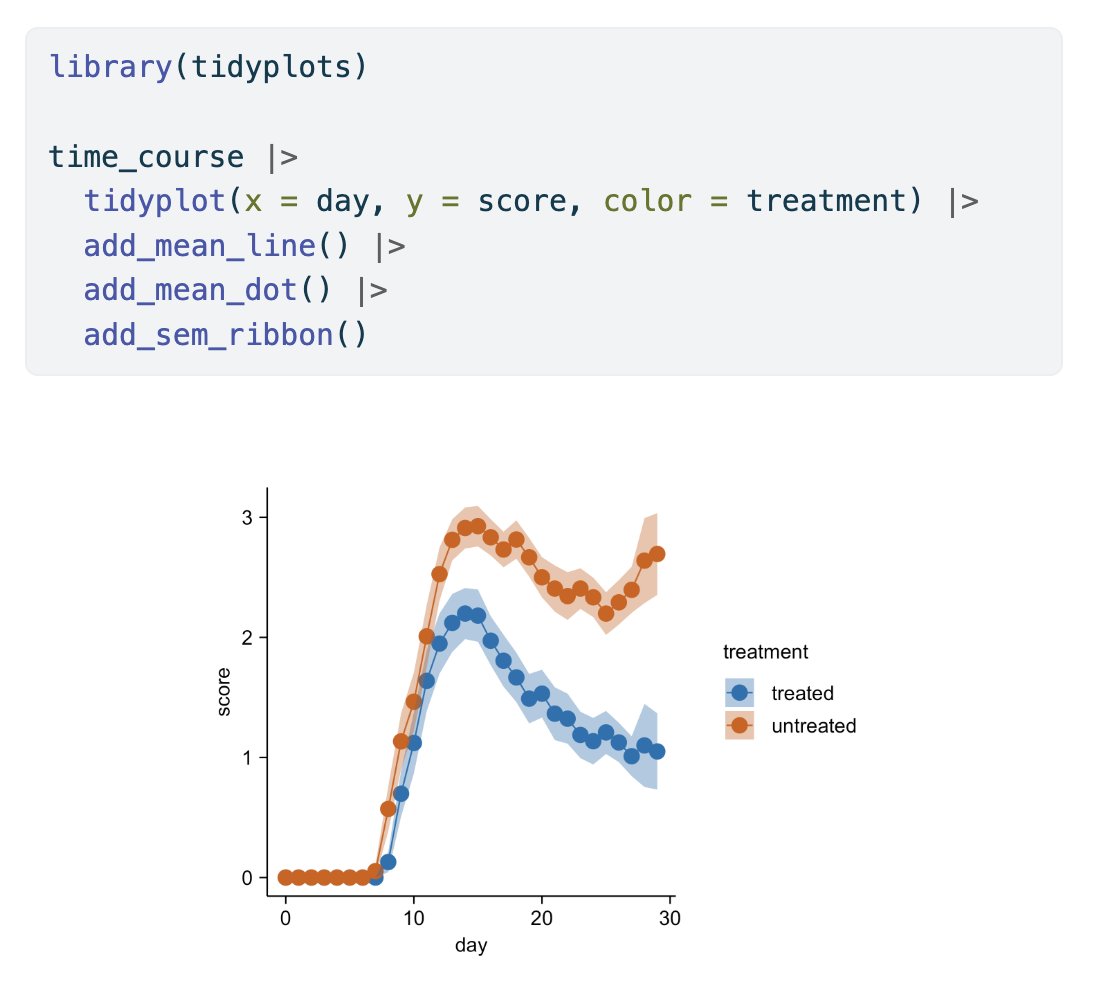
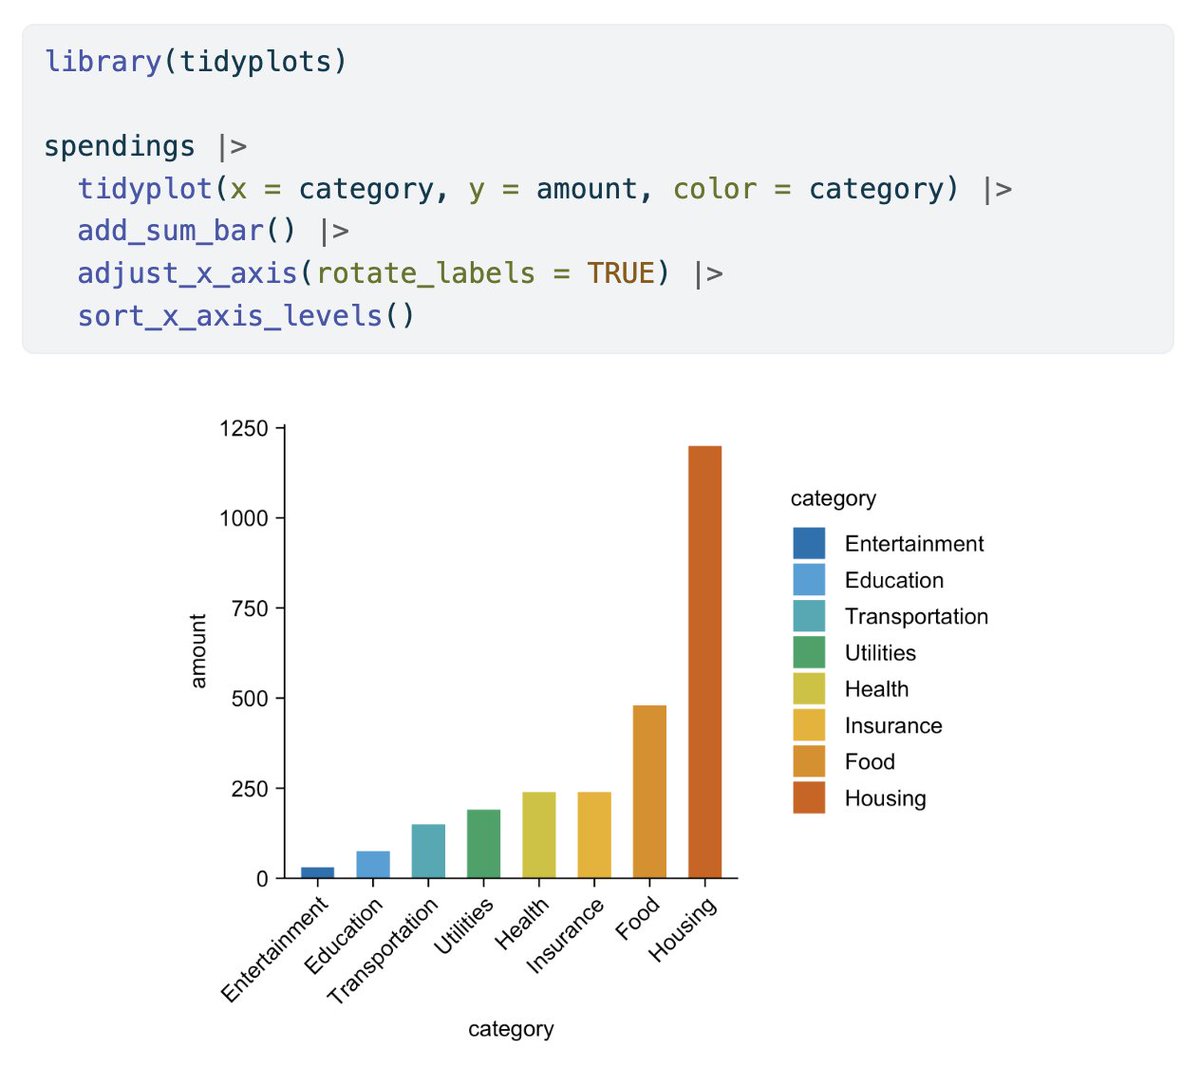
This is how you can save intermediate stages of #tidyplots by using `save_plot()` in the middle of a pipeline 💡. #rstats #dataviz #phd

1
8
125
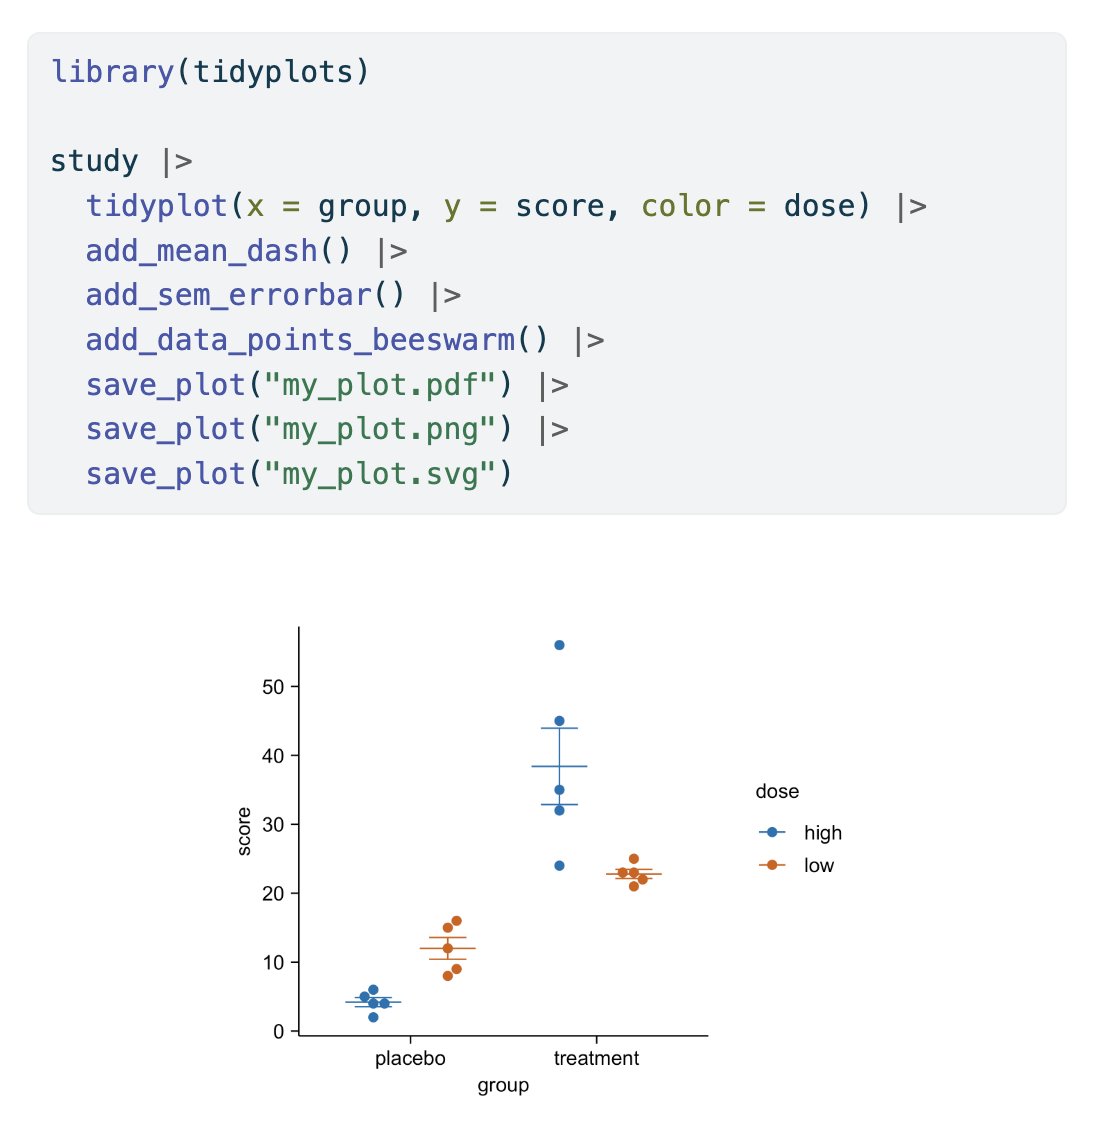
You can save #tidyplots in multiple formats by piping through multiple rounds of `save_plot()` 🤩. #rstats #dataviz #phd
0
16
143
RT @Shuntarooo3: tidyplots packageをようやく使ってみた.はじめの印象よりも小回りにきくし,凝ったことをしない限り,これでいいかもしれない.特に底がeの対数軸にできるのがいい.ggplotできないんだよ(知らないだけかも).オッズ比とかハザード比….
0
20
0
🥳 Woohoo! #tidyplots just hit 600 stars on GitHub 🤩. Huge thanks to all supporters!. #rstats #dataviz #phd

0
0
36

0
24
195

1
57
475

3
39
284
1
39
439
The Plot Builder in #JASP 0.95.0 is now powered by #tidyplots 🚀. Kudos to @matyasbukva. JASP is an open-source statistical software suite with a graphical user interface for conducting classical and Bayesian analyses. #rstats #dataviz #phd
0
27
178
Thank you for citing #tidyplots 🙏. Tomohiro Ishii et al. Pericyte-mediated regulation of angiogenesis during cutaneous wound healing in adult zebrafish. Communications Biology (2025). #rstats #dataviz #phd.
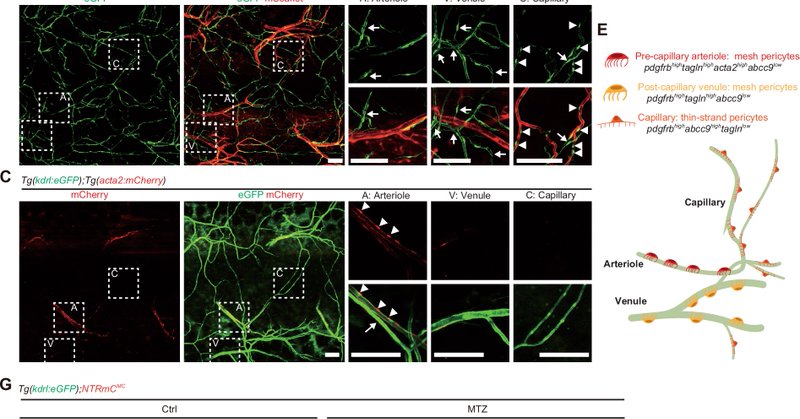
nature.com
Communications Biology - Live imaging in adult zebrafish reveals that pericytes actively regulate wound angiogenesis by restricting endothelial cell proliferation, sprouting, and directional...
0
1
31
Thank you for citing #tidyplots 🙏. Maria J. Pereira et al. Depot-specific metabolic and inflammatory profiles in perirenal and renal sinus adipose tissue, Molecular Medicine (2025). #rstats #dataviz #phd.
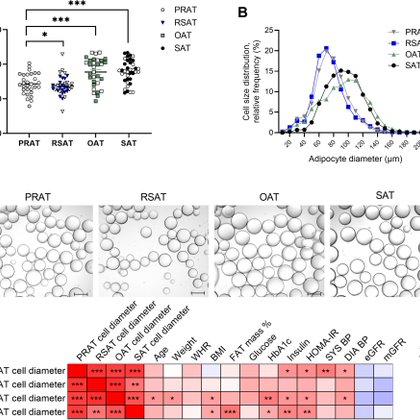
molmed.biomedcentral.com
Background Alterations in kidney-associated adipose tissue depots, specifically renal sinus (RSAT) and perirenal adipose tissue (PRAT), may contribute to metabolic, cardiovascular, and chronic kidney...
0
3
39

0
11
63

1
17
209

0
17
128

2
12
171

1
22
182

0
8
64
3
18
174
New paper citing #tidyplots 🥳. Ríos-Gallardo, P. T. et al. Reliability and Validity of an AI-Driven Smartphone Application for Measuring Countermovement Jump Height: A Comparison with Force Platform, Infrared Optical Timing, and Manual Video Analysis.
1
2
10

0
24
267