Cédric Scherer
@CedScherer
Followers
25K
Following
23K
Media
2K
Statuses
15K
Inactive account → find me on BlueSky and LinkedIn 🧙♂️✨📊 Independent #DataViz Consultant & Designer 👨🎓🌿🐗 PhD in Computational Ecology
Berlin, Germany
Joined March 2015
📊🧵 Collection of tweets featuring open-access materials that I have shared over the last years: .Talks, seminars, blog posts, hands-on notebooks, codes, and more!. #rstats #ggplot2 #tidyverse #dataviz 🧙♂️


18
623
3K
RT @R_Graph_Gallery: #dataviz is a long, iterative process. If you want to learn the required steps to create a great graph with R and ggp….
0
15
0

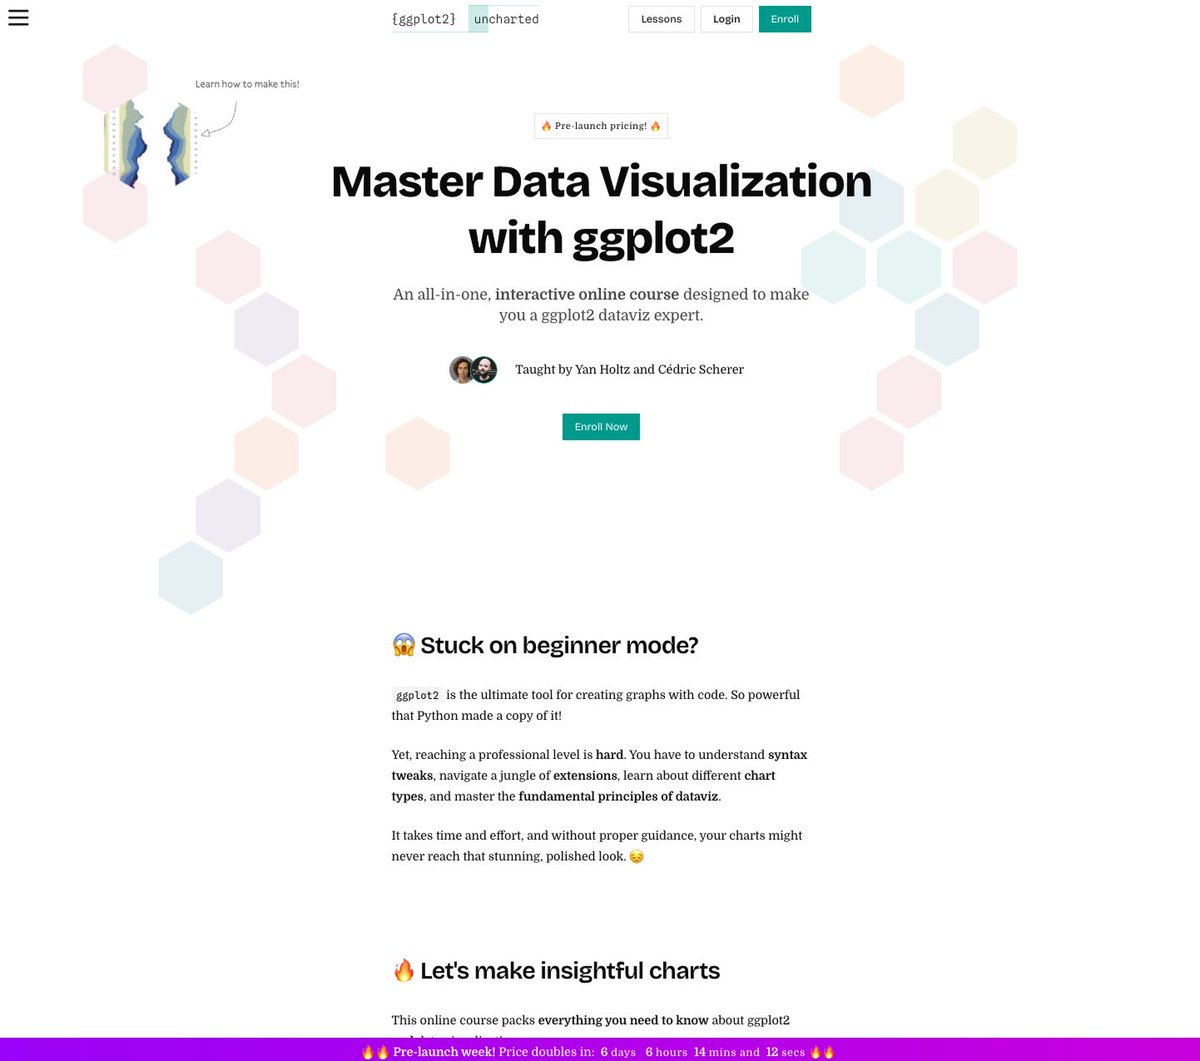
Our ggplot2 [un]charted course is live! 🎉. Lesson 1, “Why R and ggplot2?”, is free to explore — short, thoughtful & a bit different. Get the early-supporter price!.👉 Follow along as new content drops and learn while running your code in the browser 👩💻
1
1
5
Excited to launch "ggplot2 [un]charted" with.@R_Graph_Gallery! 🎉. An online course to master #DataViz with #ggplot2 with exercises, quizzes, modules—and hands-on #Rstats code running in your browser! . Still WIP—sign up now for a limited discount!.👉
0
4
31
RT @R_Graph_Gallery: ⏰ Last call!. If you want to create stunning charts with Python, there are a 8 hours left only to join Matplotlib Jour….
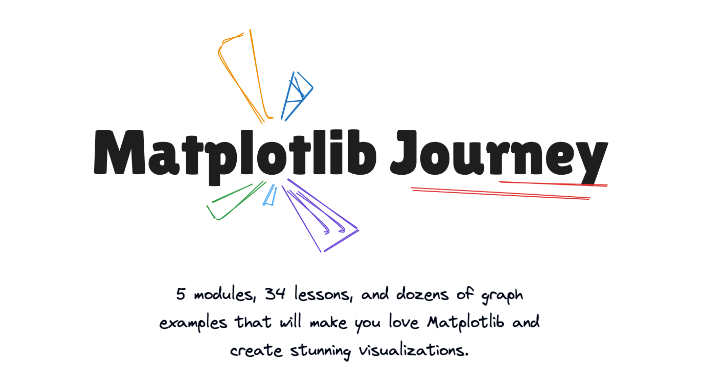
matplotlib-journey.com
An all-in-one, interactive online course designed to make you a python & matplotlib dataviz expert.
0
2
0
RT @mdancho84: R blows my mind. All of these were made with R by Cédric Scherer (3 is my favorite):

0
90
0
RT @JoachimSchork: Measuring streamflow droughts can be a statistical challenge! Recently, I stumbled upon an interesting project in this f….
0
9
0
I'm in Washington DC for a few days to host a workshop 🧑🏫. If you're around, feel free to reach out—I'd love to connect and hang out!

0
0
23
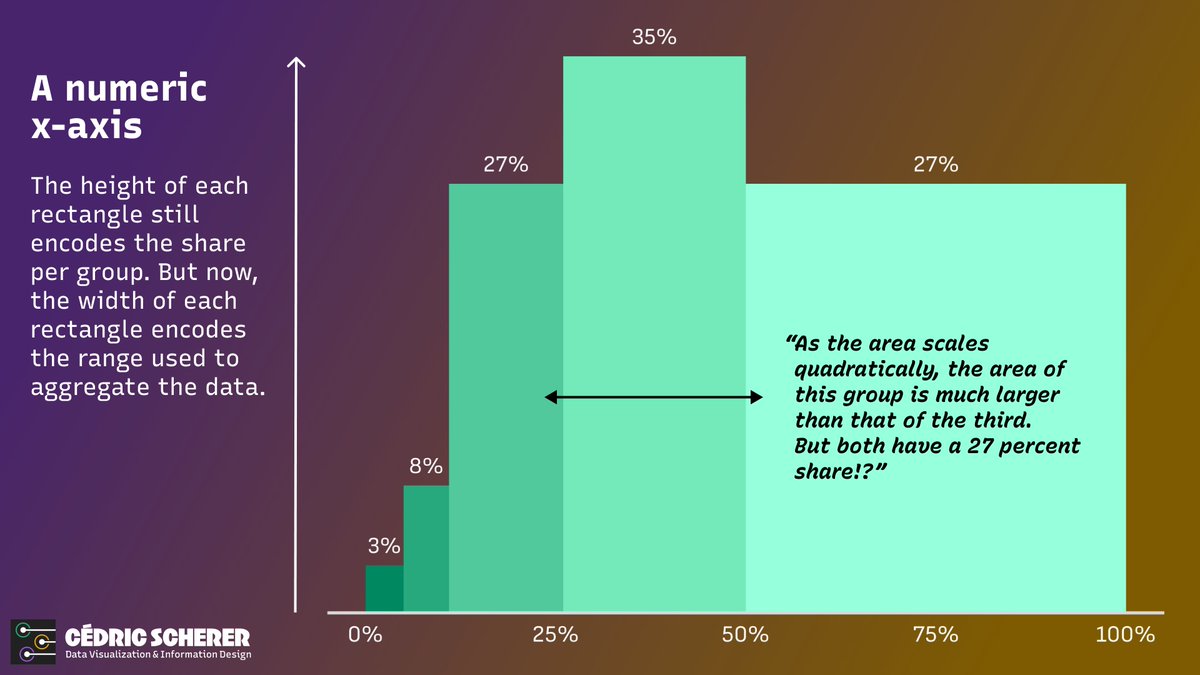
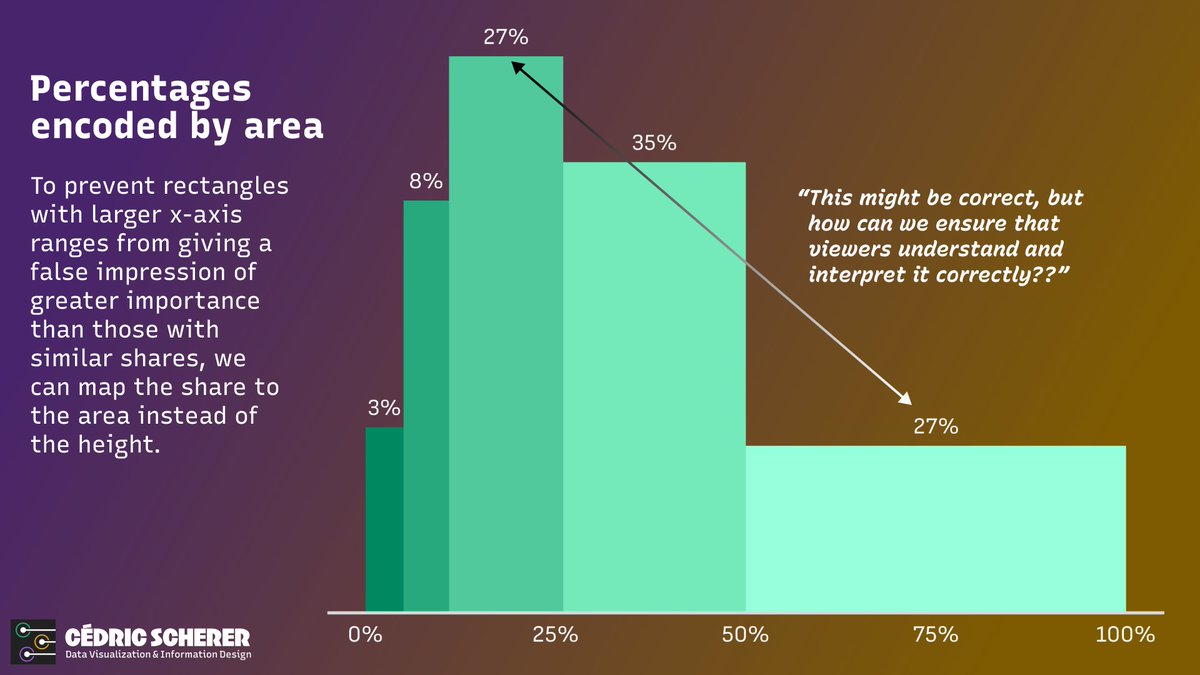
📊 Have you ever needed to create a bar chart when data is aggregated in groups of different ranges? #dataviz. While researching the pros and cons, I couldn't find a consensus on what the "best" approach is. "It depends" is, as often, the best recommendation I could find.
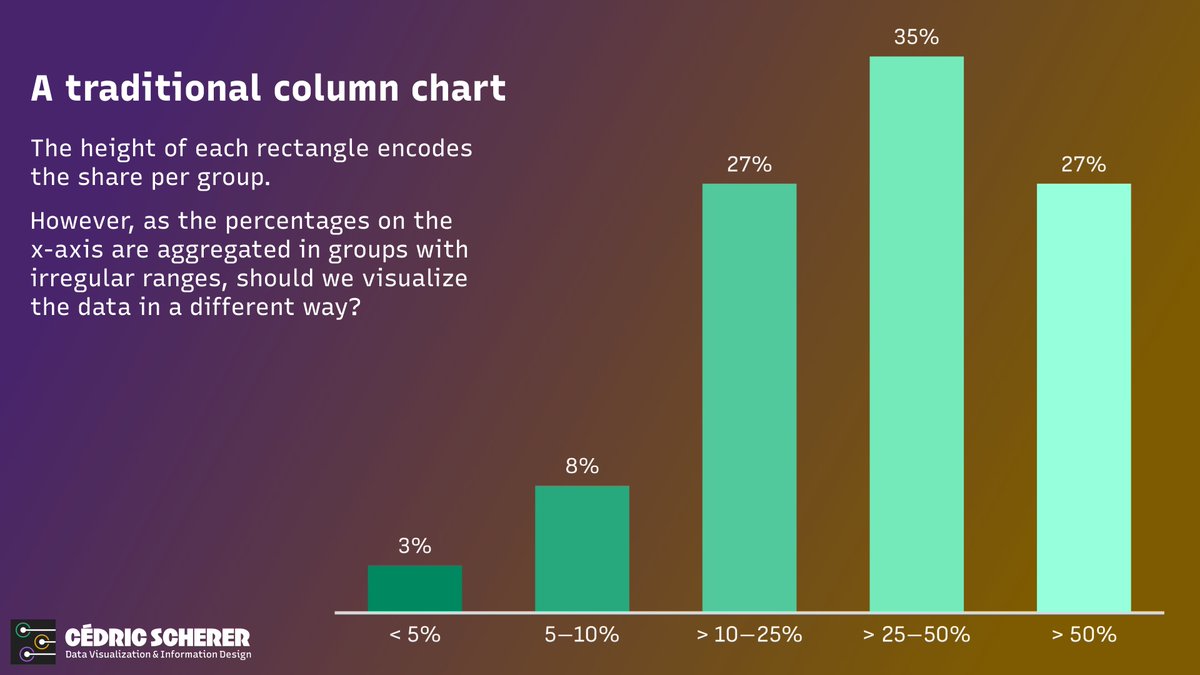

2
8
74
RT @jburnmurdoch: @sargo When people ask for the y-axis to be extended to zero, it’s because they want to know whether a trend or movement….
0
14
0


RT @karim_douieb: Land doesn't vote, people do! French edition. 🗳️. Each municipality was transformed into a dot, with the area of the dot….
0
4K
0
RT @chrispahm: Nicht die Fläche wählt, sondern die Menschen! . Für die Darstellung wird jeder Landkreis in einen Punkt umgewandelt, wobei d….
0
712
0

Maybe I missed the hype, but I fear those Elmo bar charts didn't get the attention they deserve. #DataViz #SesameStreet

2
1
23
RT @CedScherer: On Friday I am giving a talk at the #data2speak conference 2024!. You can watch my presentation and many other great talks….
0
4
0