

Pew Research Race and Ethnicity
@pewidentity
Followers
29K
Following
278
Media
4K
Statuses
8K
This account is no longer active. Please follow @pewresearch for our latest findings on race and ethnicity.
Joined December 2011
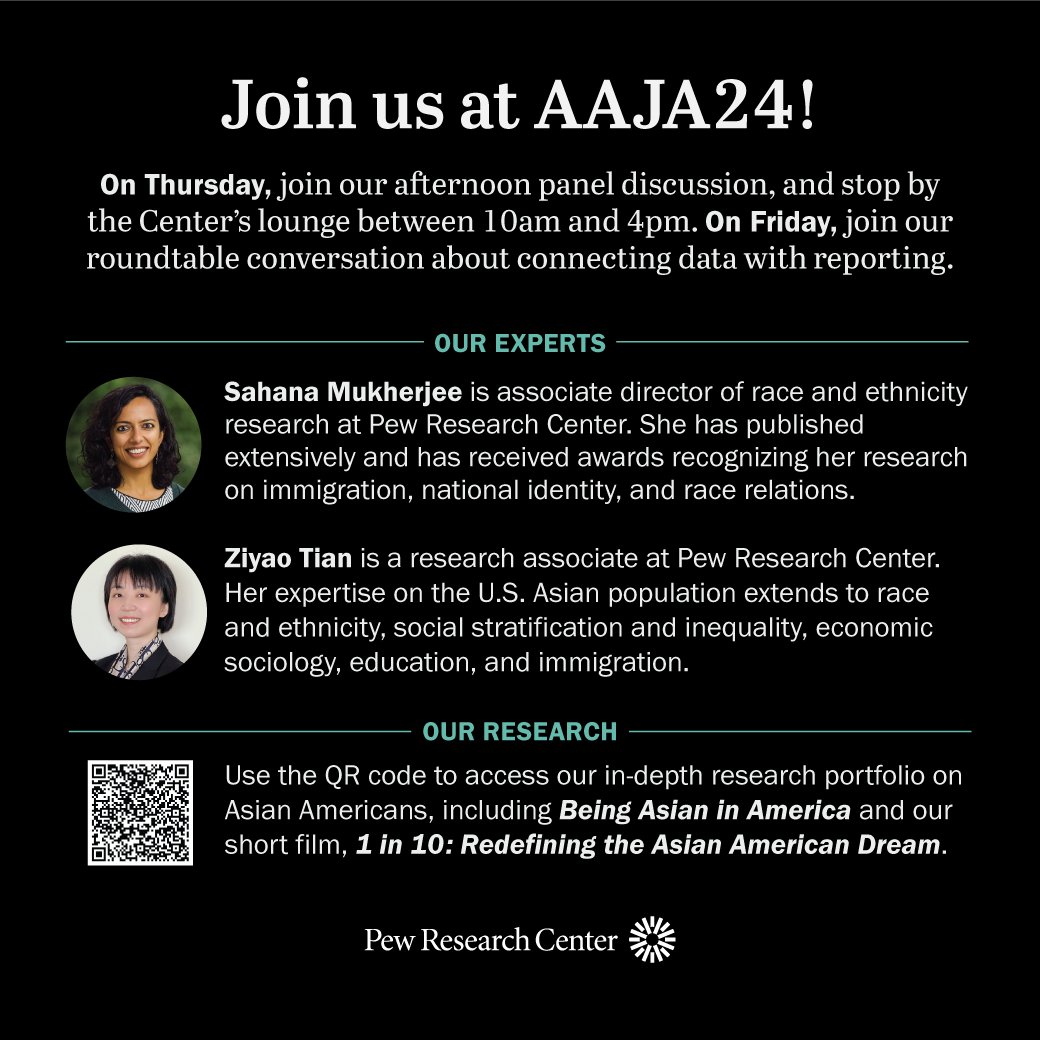
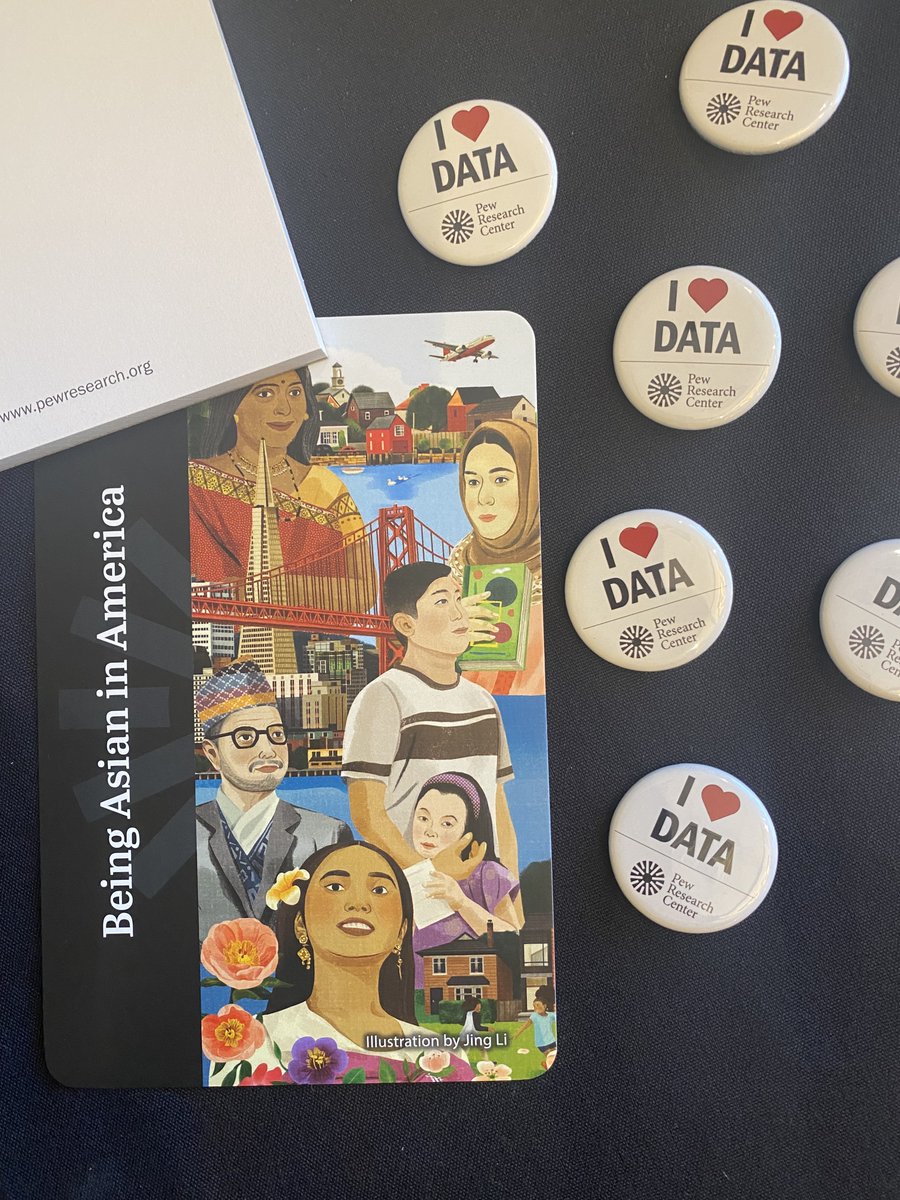
Less than one week until #AAJA24! Will we see you there? Learn and connect with @pewresearch by: 📔 exploring our Asian Americans research portfolio ( https://t.co/Imfgfsgafj) 🛋️ stopping by the Pew Research Center lounge 🗣️ attending our panel and roundtable discussions

0
2
3
Bridging the gap between interviewing formats raises many questions, so we embedded some experiments into recent international surveys to get some answers. A new post on our methodology blog, Decoded, describes how these experiments turned out.

pewresearch.org
We compared three different online survey methods in certain countries to see which one would most closely replicate our phone results.
0
0
0
If we move some of our international surveys online, we may need to make other changes to make sure that data from new projects is comparable to data from older ones. For example, online surveys do not use an interviewer, unlike our traditional in-person and phone surveys.
1
0
0
Most of Pew Research Center’s international survey work is conducted through face-to-face or phone interviews. As the survey landscape changes internationally, we’re exploring the possibility of using self-administered online polls in certain countries, as we do in the U.S.
1
0
0
Although many Black Americans view the fight against racism as their primary struggle for progress, they also view discrimination against LGBTQ people as problematic. 46% say they are extremely or very concerned about discrimination against LGBTQ people. https://t.co/X14qhRKllk

0
2
11
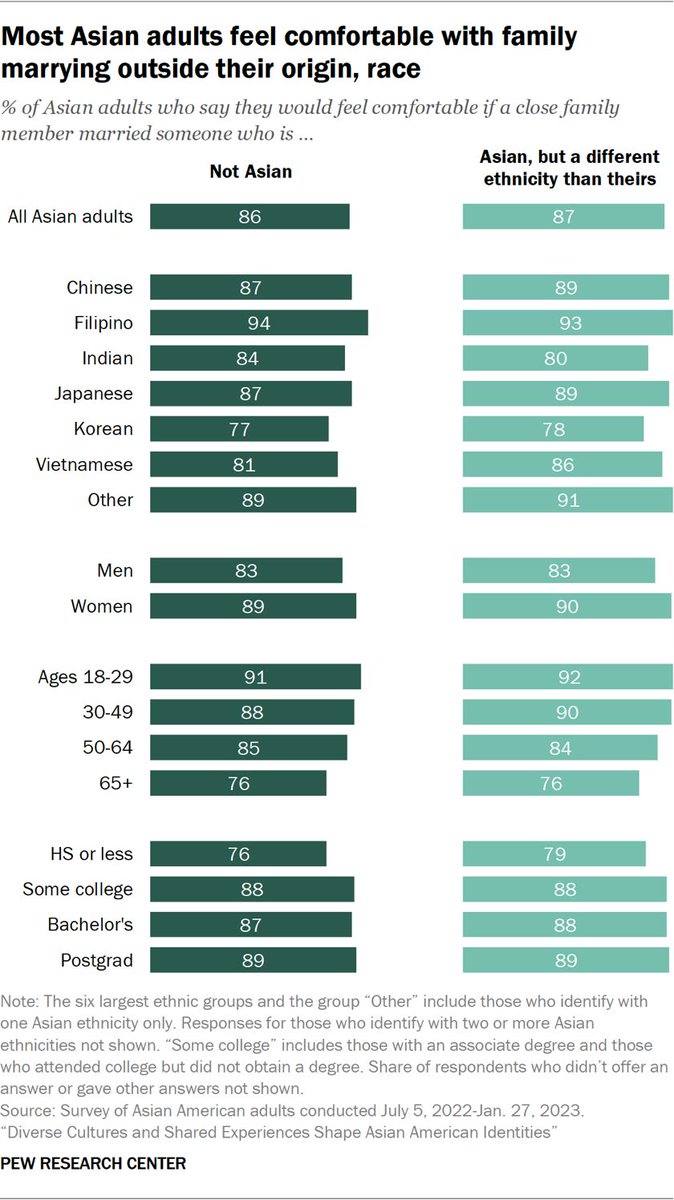
When it comes to marriage, nearly all Asian adults say they would feel comfortable if a close family member married someone who is not Asian (86%) or married someone who is Asian but from a different ethnic group (87%). https://t.co/AvjhV4hnk3
0
2
2
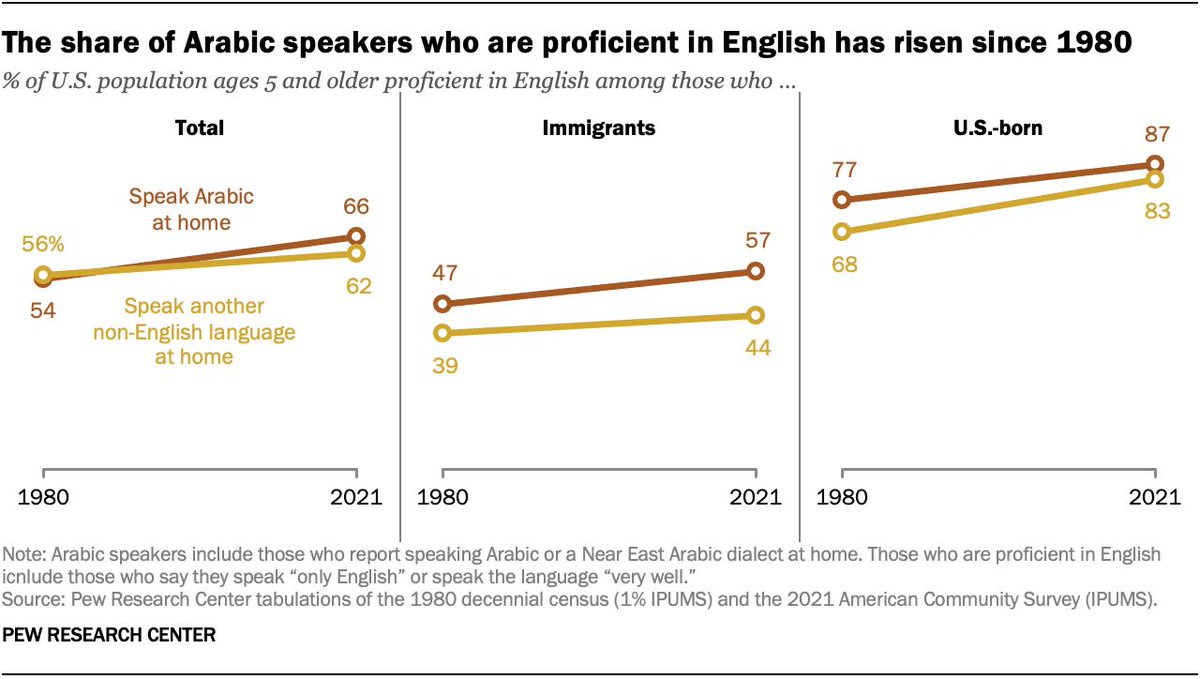
66% of U.S. Arabic speakers are proficient in English, up from 54% in 1980. By comparison, English proficiency has risen less among people who speak another non-English language at home. https://t.co/dpImaVOUxx

0
1
3
U.S. Hispanics with darker skin were more likely than those with lighter skin to say they experienced discrimination or were treated unfairly by someone who is not Hispanic (42% vs. 29%). https://t.co/0hrGaQHFuQ

0
2
5
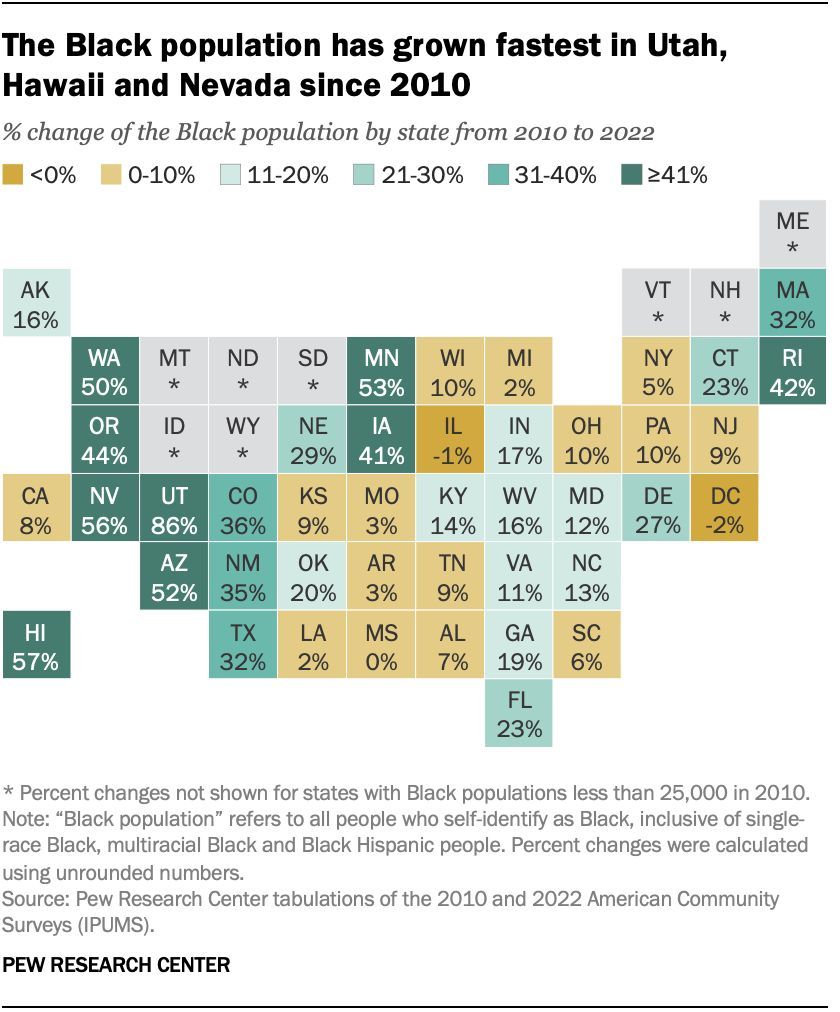
The Black population has grown fastest in states that historically have not had large numbers of Black residents. Utah experienced the fastest growth in its Black population between 2010 and 2022, with an increase of 86%. https://t.co/qjQ841O1ds
0
0
5
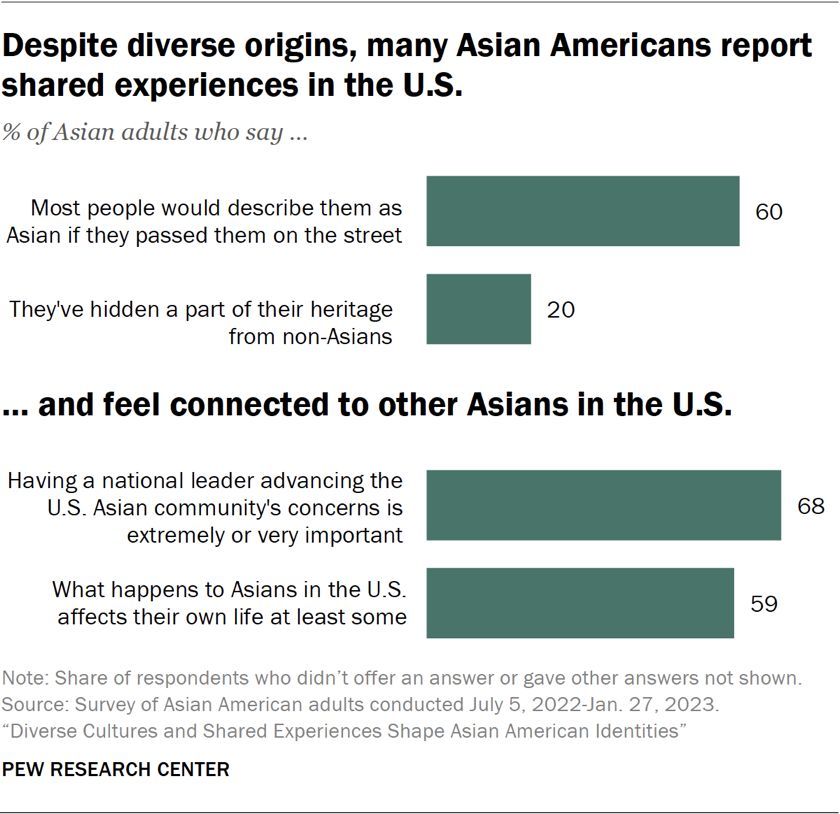
59% of Asian adults say what happens to other Asians in the U.S. affects their own lives, at least some, and 68% say it is extremely or very important to have a national leader advocating for the concerns and needs of the Asian population in the U.S. https://t.co/j1wh902Bet
0
1
3
How Temporary Protected Status has expanded under the Biden administration
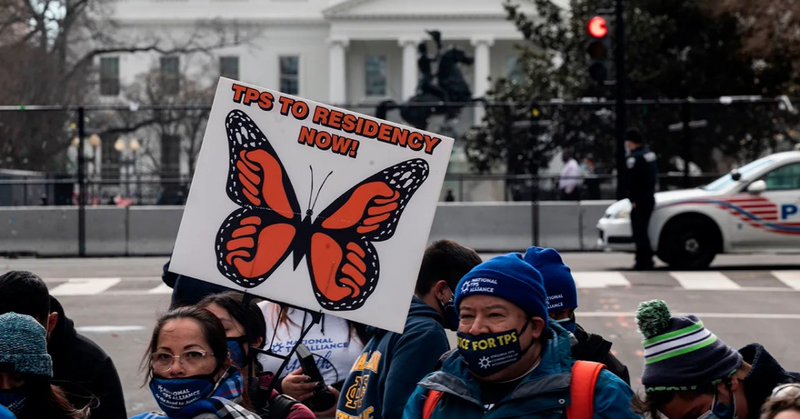
pewresearch.org
Since January 2021, the Biden administration has greatly expanded the number of immigrants who are eligible for Temporary Protected Status.
0
1
1
% of Black adults who consider themselves __ informed when it comes to the history of Black people in the U.S.: - Extremely: 16% - Very: 34% - Somewhat: 37% - A little: 9% - Not at all: 2% https://t.co/eX3iF35qzt

0
0
2
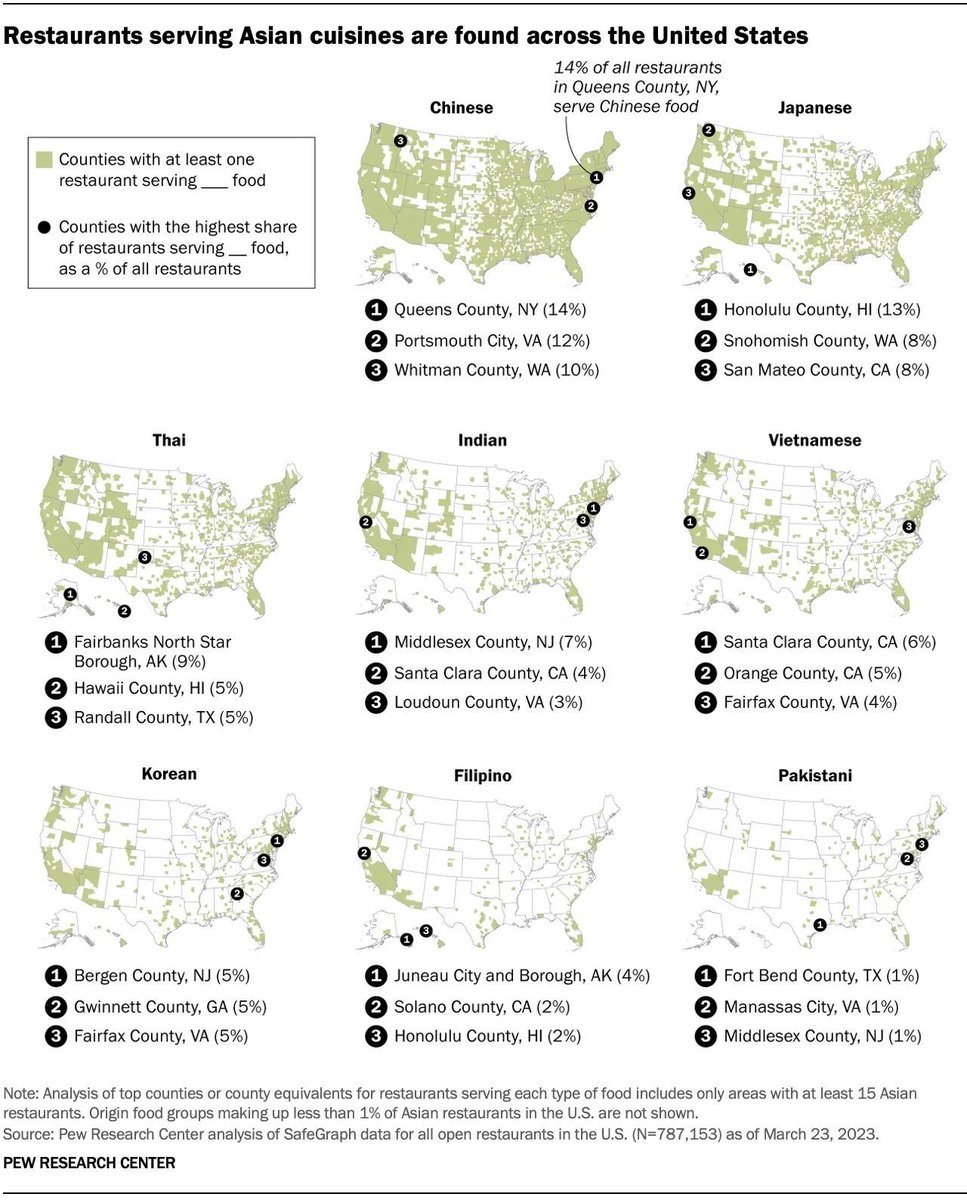
Chinese restaurants are found in every state and in 70% of all U.S. counties. Every state and a third or more of all counties also have at least one restaurant that serves Japanese (45%) or Thai (33%) food. https://t.co/X5i0xwa4T5
0
1
11
Immigrants and children of immigrants make up at least 15% of the 118th Congress
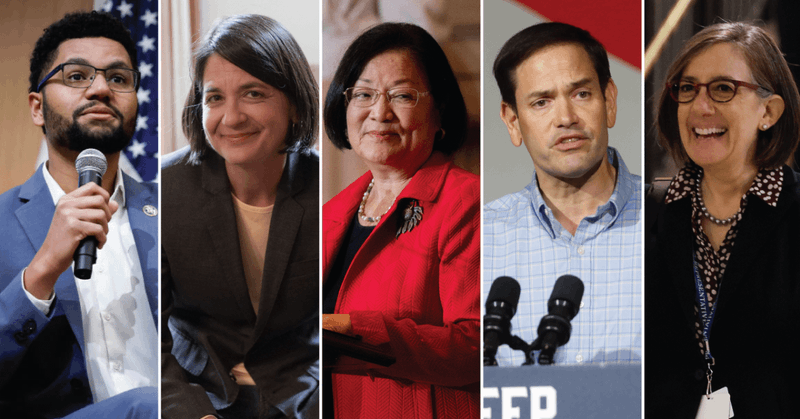
pewresearch.org
At least 81 voting members of Congress (15%) are foreign born or have at least one parent who was born in another country.
0
2
7
Puerto Rico’s population has declined by about 500,000 since 2010, from 3.7 million to 3.2 million in 2022. Puerto Rico has experienced a net population loss since at least 2005, driven by low fertility rates and migration to the U.S. mainland. https://t.co/Tz2VoHbyWZ

0
7
8
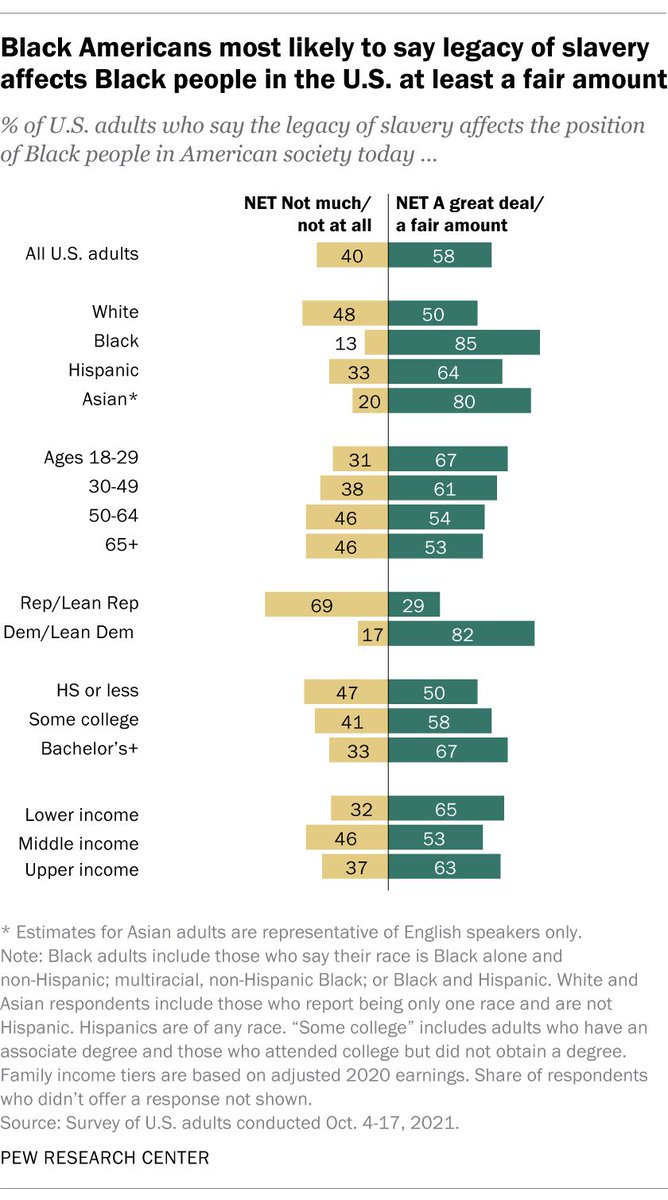
58% of Americans say the legacy of slavery affects the position of Black people in American society at least a fair amount. Four-in-ten say this has not much or not at all affected the position of Black Americans today. https://t.co/3AtmXi6UEn
0
2
5
51% of Asian American adults say all or most of their friends in the U.S. share their own ethnicity or are otherwise Asian. This is also the case among Asian immigrant adults, with 56% saying all or most of their friends share their ethnicity or are Asian. https://t.co/Bo5fgO3wgZ

0
1
6
66% of U.S. Arabic speakers are proficient in English, up from 54% in 1980. By comparison, English proficiency has risen less among people who speak another non-English language at home. https://t.co/B22dKzmk3c
0
1
3
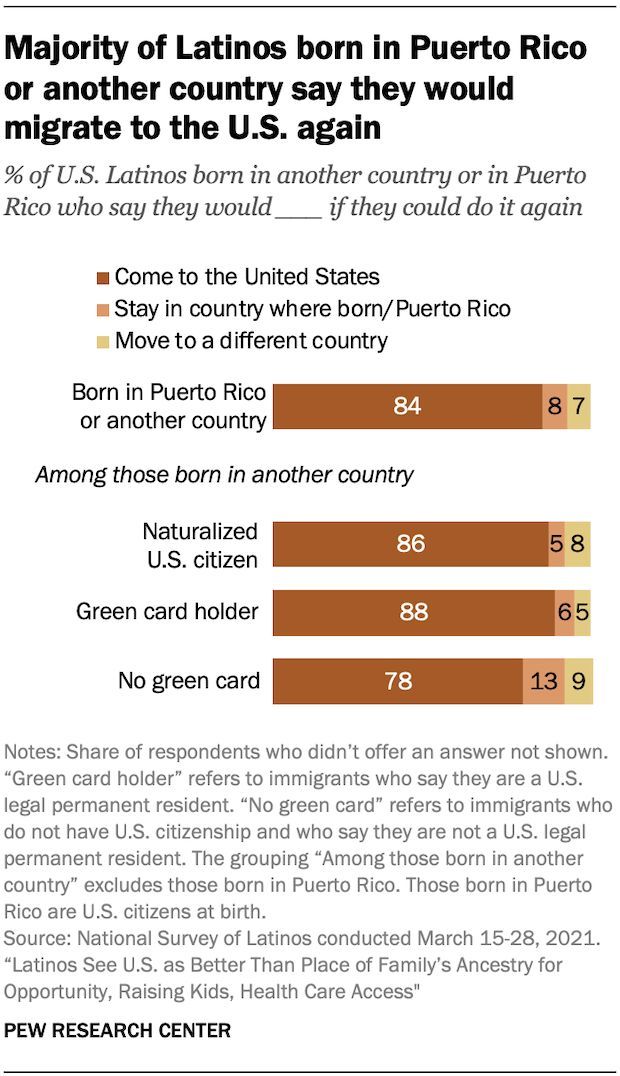
84% of Latinos born in another country say they would migrate to the U.S. if they had to do it again. Mostly similar shares say so across immigrant groups by legal status, including 78% of those who are not U.S. citizens and do not have a green card. https://t.co/sYutWL3438
0
1
4