

Orwell2024🏒
@orwell2022
Followers
11K
Following
83K
Media
14K
Statuses
34K
If it disagrees with the expert, it’s wrong. In that simple statement is the key to consensus. https://t.co/MYLncQl3Uh
Everglades
Joined September 2009
Wow. We now have Florida in Europe. Travel time to the real US deal? Same. So maybe play it safe: Miami. Climate change™ means:.Stay flexible. Pack light. Book hotels day by day. Move daily if needed. ✈️.Chase summer like it’s fleeing the continent.


@orwell2022 10 km west of Syracuse you can find Floridia, the new record holder in Europe with 48.8°C on August 11, 2021. The WMO only needed two years to confirm the record. 🤔


1
1
3
We can’t hold it. It’s coming south. The cold enemy breached the first defense line: Tuscany. Only one move left:.Retreat further 1000 km south. Siracusa. Running miles. ☀️ Last resort. Final summer defense line. We’re not surrendering!


2
2
19
Important: If you want to measure climate, do so where the map is green. If your station sits in concrete, cropland, or suburbia you’re not measuring climate. You’re measuring real estate and agriculture. The error isn’t minor. It’s several degrees. Always towards warming.


@KoudijsHenk @deheij And this is how it should look like if you want to measure climate. And if you do that using the best locations that exist on this planet, USCRN, you get the result on the right hand side.


3
25
66
10 °C letzte Nacht in Deutschland. Wie viele hatten wohl die Heizung an? Im wärmsten Juli seit dem Urknall…

10
21
128
Die Maßnahmen wirken: Wärmepumpen laufen hervorragend selbst im wärmsten August seit Beginn der Aufzeichnungen wird wieder im August geheizt. Ziel erreicht: 24 °C im Wohnzimmer, draußen Hitzewarnung bei 14 °C.


"Wetterprognosen können sich kurzfristig ändern ‒ vor allem aufgrund des Klimawandels." 🤡.
1
5
27
90m altitude: slightly lower pressure measured 100076. Explains the 1.2m. air pressure was 100076 Pa. Nominal 101325 Pa (1 atm), this pressure causes a ≈ -0.127 m (-12.7 cm) error on water depth. So, a 1.2 m pool measurement actually means ≈ 1.32 m depth. Seems right. ~1.4m.
0
0
3
Pool test. Very rapid response of sensors. Depth seems correct too. 1.2m.


1
0
3
South France. No “climate power”. We abandon and move 1000 km south to the real deal. Lat south of Florence are reliable summer conditions. S-East side hottest. 🤝.32°C in deep shade (veranda). 34°C in shaded street. 36°C on sunlit street (burning hot soil). RH 20%.0.5m air T.


1
0
7

Und jetzt die Wettervorschau für Wetzlar bis Ende Juli:. 🌧️ Dauerherbst bei 10 °C.❄️Wer jetzt die Heizung aufdreht, hat nicht nur verloren, sondern den Klimawandel besiegt. Tipp des Tages: Tee statt T-Shirt.

1
2
7
@BerkeleyEarth “…If there’s built-up🟥 land, cropland🟪….”. (Correction: 🟪 is crop, not 🟧. Still getting used to this new thing/tool).


0
0
3
Well. We found it. 2 years late….but 10 years ahead before @BerkeleyEarth will find it….? Anyone home there? Still on MODIS 2011?.

The European Space Agency @esa proudly announces the release of the WorldCover2021 map based on Sentinel-2 & Sentinel-1 constellations with 11 classes, 10m resolution, 77% accuracy independently validated.Visit @ESA_EO .#EuropeanSpaceAgency #WorldCover2021

1
0
3
US has the best climate data in almost untouched locations. Select only (10–50 km clearance).🟩🟧 (ideal).🟨 (backup) grassland. Exclude.🟥🟪 (urban).⛰️ (mountains).❄️ (snow zones). Where thermometers are clean and sites human-free, there’s no hockey stick.

25/ After hard work, it's here—presented for the first time: the historic USCRN temperature series. HUSCRN . The most accurate temperature series assembled. No models. No infilling. No “adjustments.” A hard reality check—clear, stable, undeniable. @NOAA, time to pay attention.

1
5
15
Some of the “best” European stations? Total junk. Built-up, cropped, snow-covered, chunky data. Not one meets the minimum standard for GHG climate monitoring except Valentia (Ireland). The rest?.📉 Urban heat. 📉 Site contamination. 📉 Garbage for climate trends. One station.

3
3
9
AI is "just a search engine". Well, no. GPT suggested this link👏. Check if a “rural” station is actually urban or rural? Look it up. @BerkeleyEarth doesn't. If there’s built-up🟥 land, cropland🟧, or seasonal snow,.that station is 100% useless❌ for GHG climate monitoring.

Perfect real estate alignment again. Funny how the “heatwave” always knows where the real estate and farmland are. You can forecast the heatwave shape directly from satellite urbanization layers and cadaster maps.


3
7
26
RT @mckaywrigley: So I gave Claude Code a Mac Mini. And it’s called Claudeputer. It runs 24/7 and it’s allowed to do whatever it wants -….
0
794
0
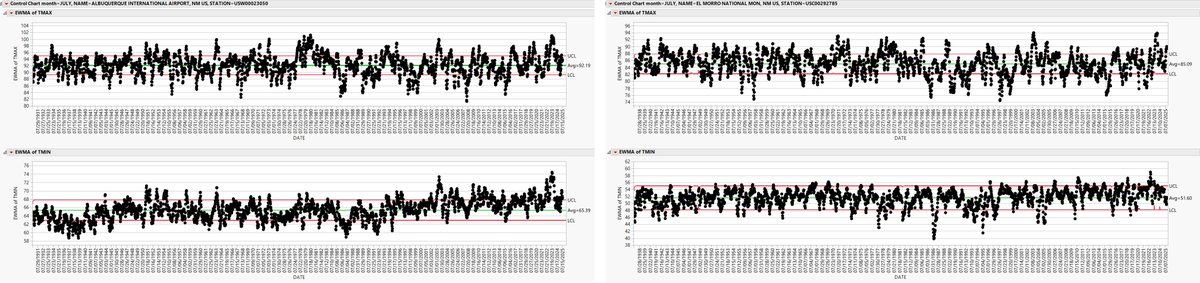
The signal fails to appear in rural thermometer data. No trend. No crisis. Example: El Morro National Monument (USC00272785). And remember: averaging thermometers isn’t physics. It’s not statistical physics. It’s not even valid engineering, so not science. It’s sociology.


Exponentially weighted moving averages of daily max and min temps measured at Albuquerque Intl. Airport (urban) and El Morro Nat. Monument (rural) in June and July. Man made global warming is actually local warming primarily caused by less cooling at night. I.e. civilization.


1
5
13
This is the best temperature data ever recorded—USCRN site (pristine siting, triple sensors, hourly, rural). Plotted raw, with USHCN and Jefferson (1776–1826). No crisis. No warming spike. If you need to change the data to see the signal, it’s not science. It’s a sham.


5/ Cleaner graph – daily. 🔴 MONTICELLO – T. Jefferson .🟢 BLACKVILLE_3W (USHCN) – USC00380764 .🔵 BLACKVILLE_3W (USCRN) – USW00063826. 🎶 ". O'er the land of the free . 🎶🎶🎶 . and the home of the brave"🎶👏👏👏

4
13
33
5/ Cleaner graph – daily. 🔴 MONTICELLO – T. Jefferson .🟢 BLACKVILLE_3W (USHCN) – USC00380764 .🔵 BLACKVILLE_3W (USCRN) – USW00063826. 🎶 ". O'er the land of the free . 🎶🎶🎶 . and the home of the brave"🎶👏👏👏
1
0
7