
Mind the Graph
@mindthegraph
Followers
1K
Following
1K
Media
2K
Statuses
5K
The best tool to create #ScienceFigures! 🧠 We help you illustrate your research easily - no design skills needed | A @cactusglobal solution | #AcademicTwitter
Joined November 2011
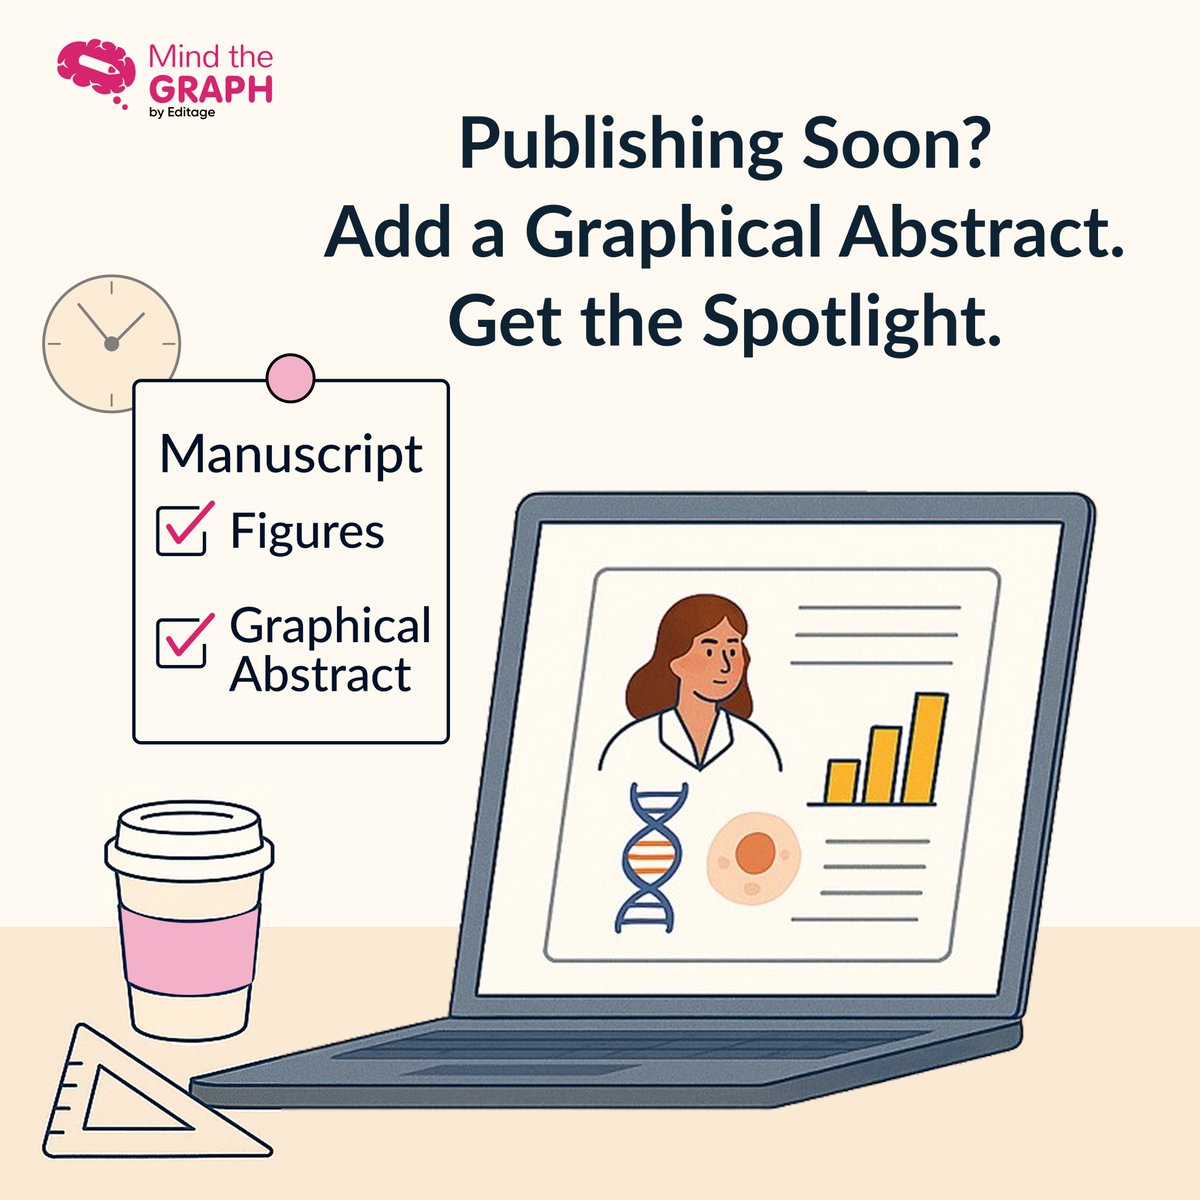
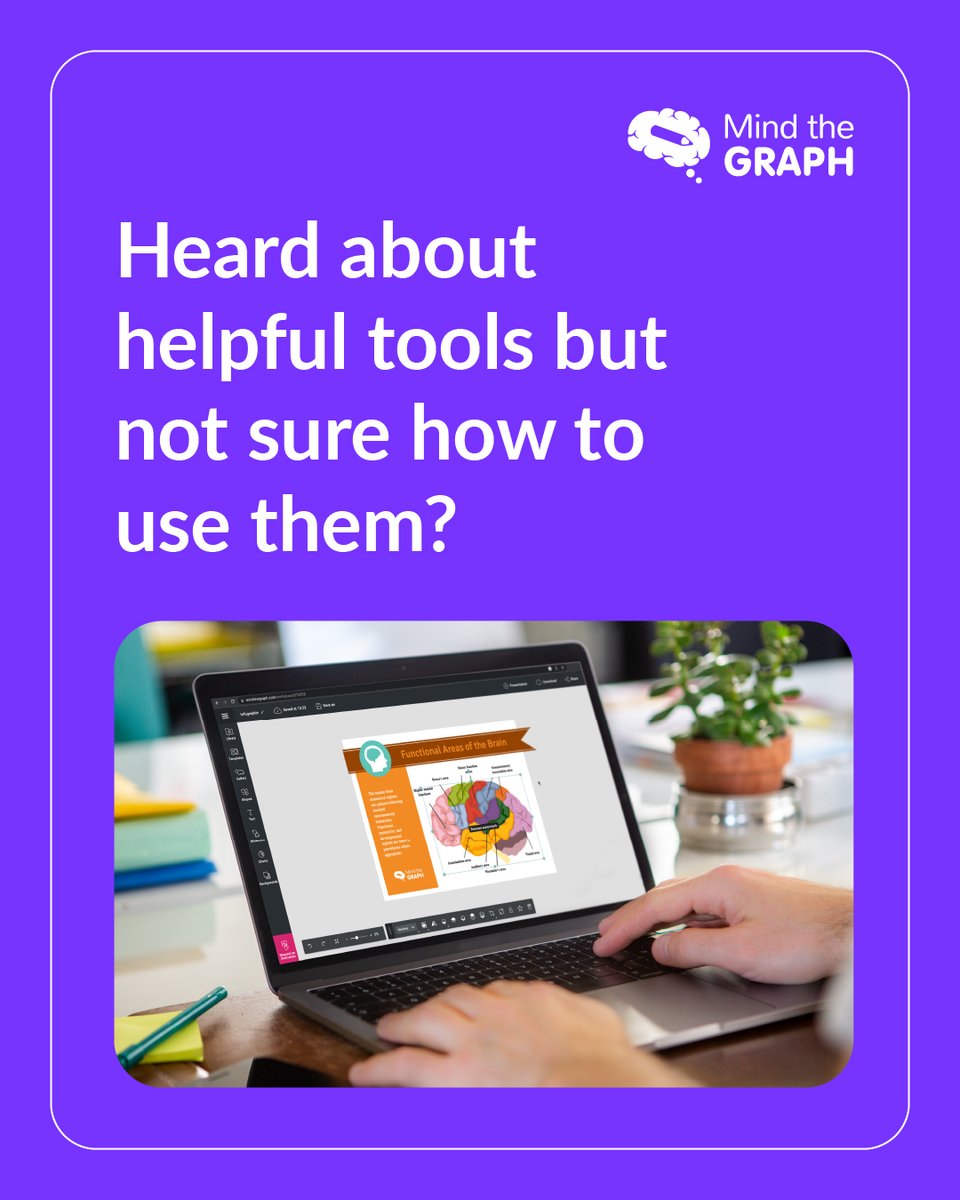
Did you know? 📊.More journals—from Nature to The Lancet—now require graphical abstracts to make research more accessible and engaging. Simplify findings, boost visibility, & meet journal needs with ease using Mind the Graph!. Try it now:
0
1
0


Struggling to make your research stick with readers?.Visuals speak faster than words—and they stay longer too. Level up your science communication with stunning graphical abstracts 🧠✨. 🎨 Try Mind the Graph now: #MindTheGraph #ScienceDesign #AITools

1
0
0
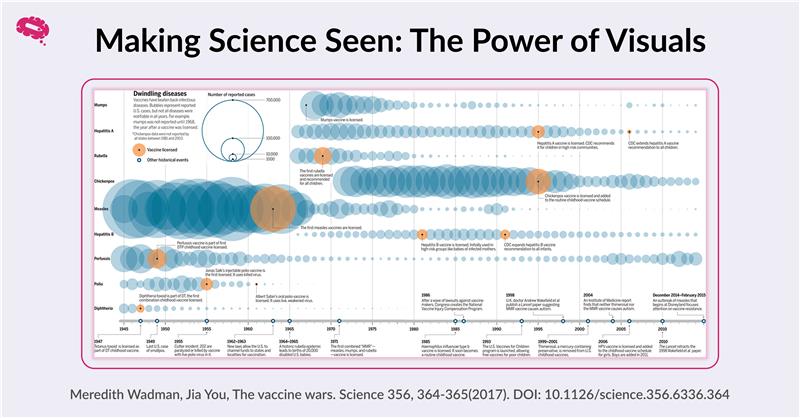
Transform Complex Science into Clear Visuals!. Scientific concepts can be intricate, but the right visuals make them accessible & engaging. From infographics to data visualizations, learn how to effectively communicate your research. Read the blog here:

0
0
0
In a world flooded with opinions, clear visuals help science reach all audiences, sparking understanding and trust. Let’s make science visible and understandable for everyone, everywhere! . Check it out here: #MindtheGraph #AcademicChatter #Science
0
1
1
Transform complex ideas into clear, engaging visuals with Mind the Graph. Use exclusive scientific illustrations + easy tools to create impactful stories. Perfect for data, presentations & more. Start now → #ScienceCommunication #Infographics

0
1
1
🚨Today’s the day! 🚨. 🎨 Learn the visual science secrets behind high-impact publications with Sandra Bonilla, Digital Scientific Illustration Expert & Science Communicator. 🗓️ April 10 | ⏰ 10 AM Brasilia Time. Secure your spot now! Register Here:
0
2
1
📅 April 10, 2025 | ⏰ 10 AM Brasilia Time .Don’t miss this chance to discover how the right illustration can be a game-changer for your academic impact. 📌 Register now: #Reseach #academia #ScientificIllustrations

0
0
0
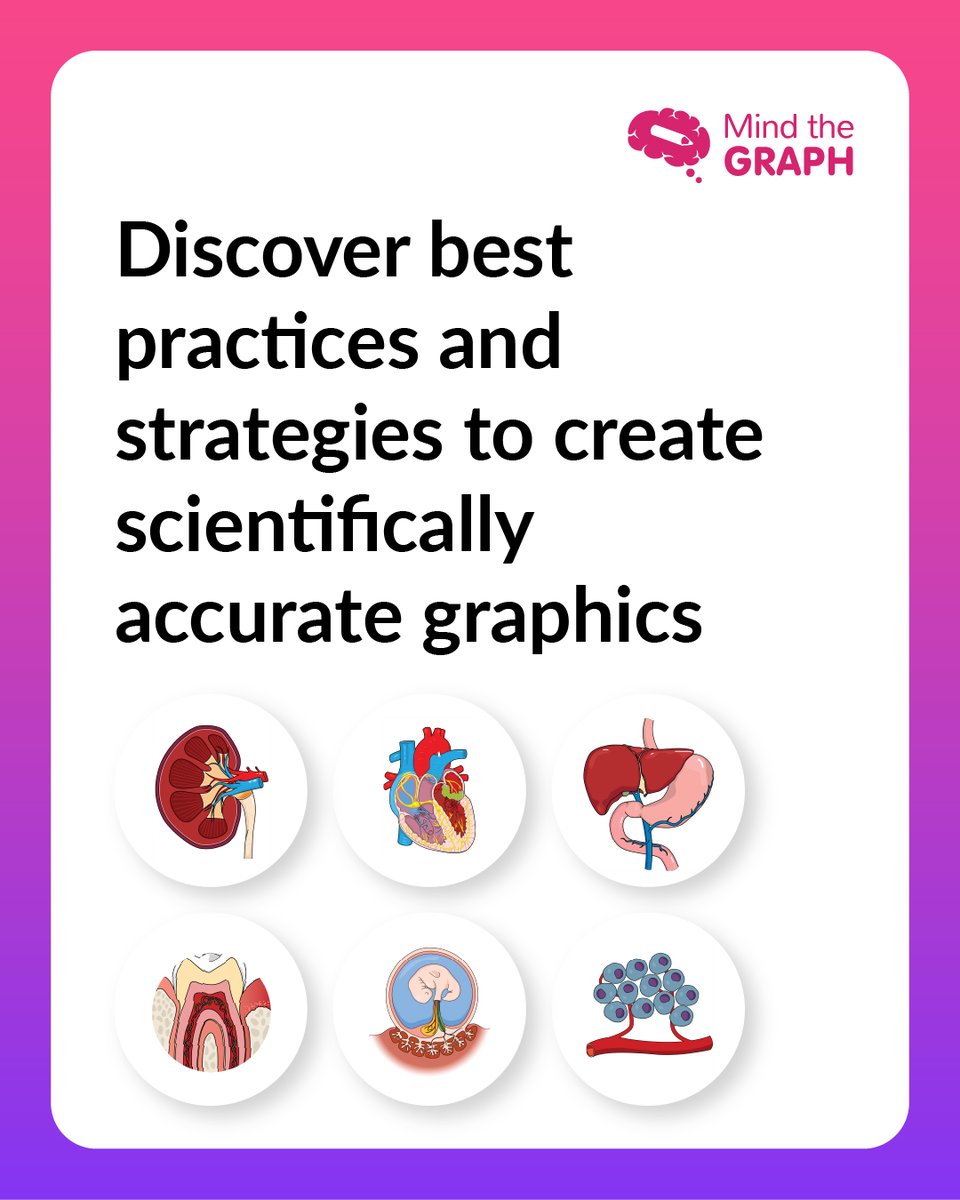
Learn how to turn complex scientific concepts into clear, eye-catching visuals that elevate your work and improve engagement.


1
0
0
Want your research to grab attention at first glance? 🎯.Join Sandra Bonilla, Digital Scientific Illustration Expert & Science Communicator, for an engaging workshop: "Scientific Illustrations for High-Impact Publications: Exploring Mind the Graph."

1
0
0
Discover how the right illustrations can make your research stand out in the academic world. Don’t miss out!.Register now:

0
0
0
Join Sandra Bonilla, Digital Scientific Illustration Expert & Science Communicator, for an interactive session on "Scientific Illustrations for High-Impact Publications: Exploring Mind the Graph.


2
0
2
If creating impactful visuals for your research feels overwhelming, this workshop is for you!

1
2
1
Struggling to create engaging visuals for your research? . Join us for an exclusive free webinar on “Scientific Illustrations for High-Impact Publications: Exploring Mind the Graph” with expert Sandra Bonilla!. 📅Date: April 10, 2025 . Register now:

0
2
2
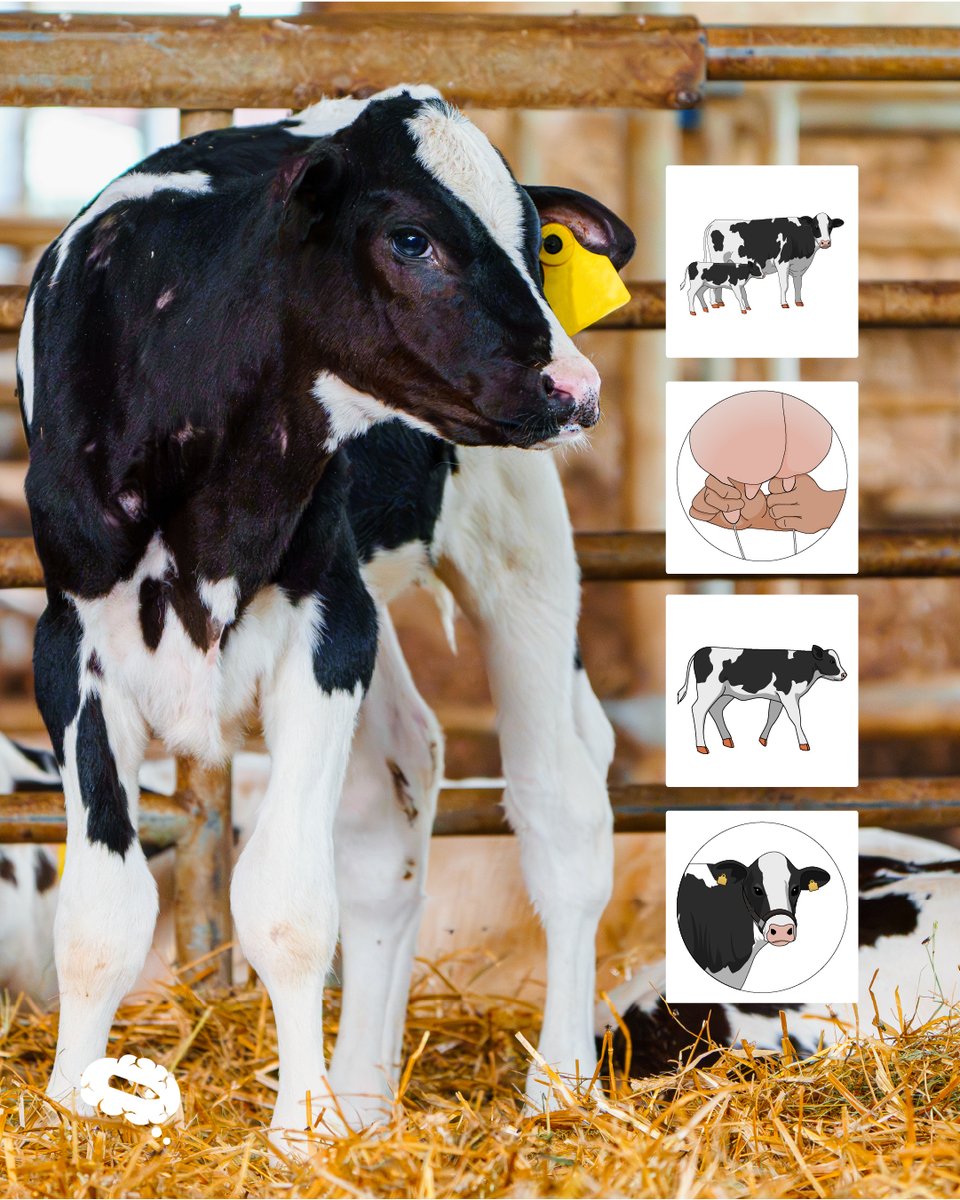
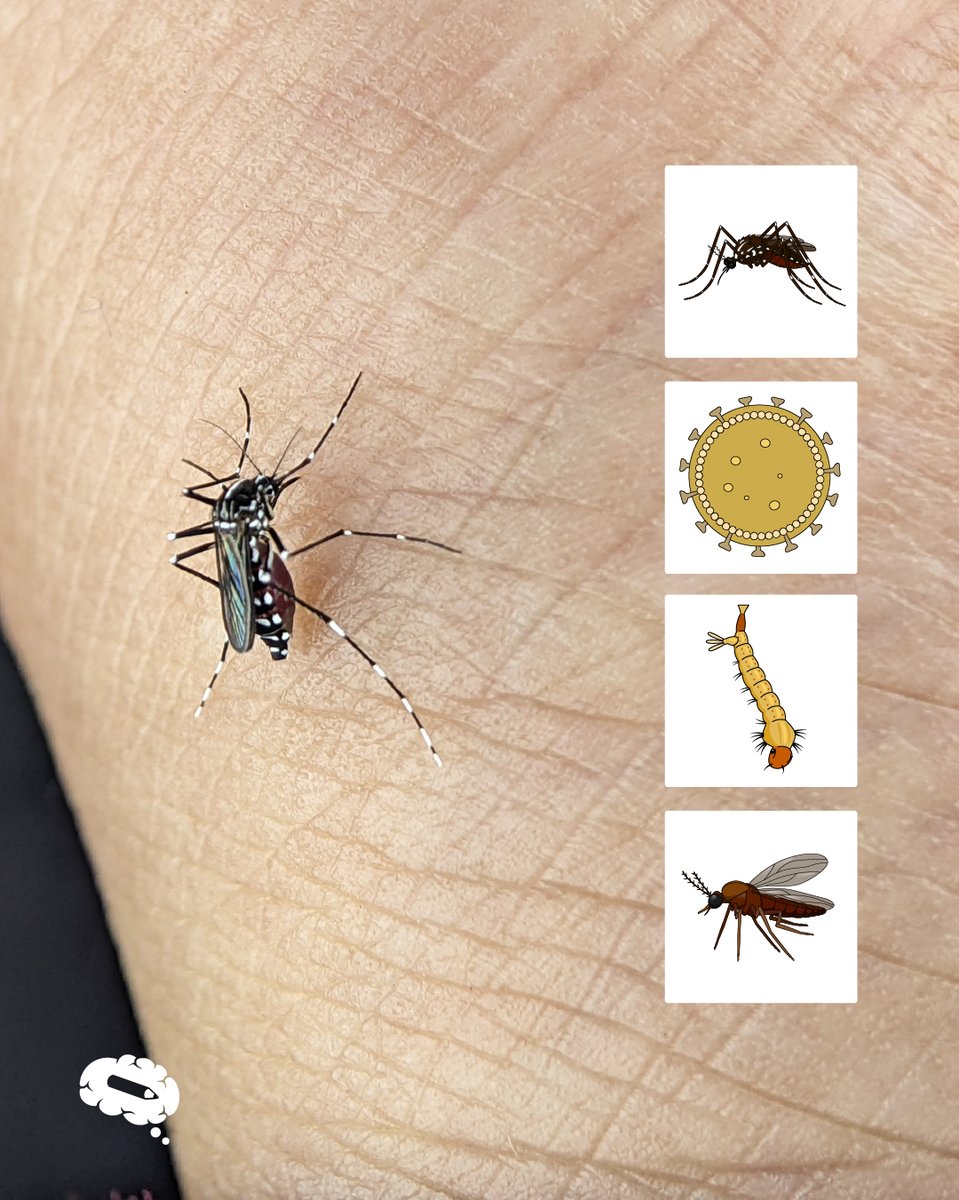
From Zika to calf development, water pollution to tomography scans, we have the scientific illustrations you need! 🌿🧬. Explore:


1
1
2
Science humor to fuel your day of research! 🧑🔬💡. @particle_science @studymeta_008 @teabag.cartoon @scienceoftheuniverse


0
0
0
Great writing starts with the right words! ✍️. Want to make your essays clearer and more engaging? Learn how word choice can transform your arguments and structure. Check out our latest blog post!. 🔗
mindthegraph.com
Use this comprehensive list of words to use in essays to elevate your writing. Make an impression and score higher grades with this guide!
0
0
0
Today is International Day of Women and Girls in Science!. From past pioneers to today’s innovators, women have shaped science in extraordinary ways. Let’s celebrate their contributions!. Who’s a woman in science that inspires you? Tag them!.
0
0
0
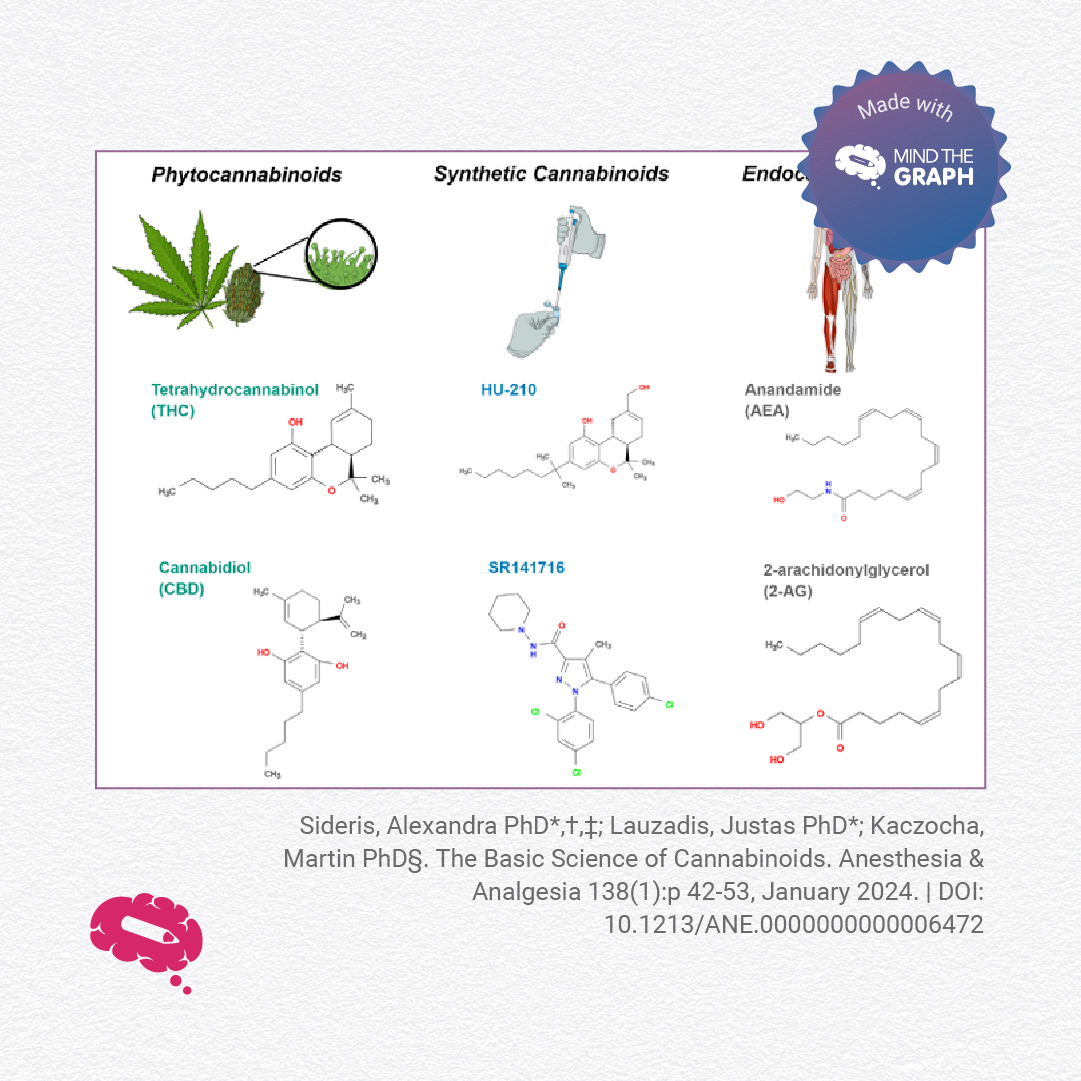
How do cannabinoids interact with the body?. A study by Sideris, Lauzadis & Kaczocha in Anesthesia & Analgesia explores CB1 & CB2 receptors, neurotransmitter regulation, and cannabinoid pharmacology—all illustrated with Mind the Graph. Read more:


0
1
1